Market Brief · by Aidan Sowa · October 5, 2026
How Can Old Northeast Show Different Medians From Different Sample Sizes? Reading a Median on Few Sales and a Median on Many
Reading a Median on Few Sales and a Median on Many for Old Northeast, FL, with each source dated and its limits noted, for owners weighing a listing against a direct sale.
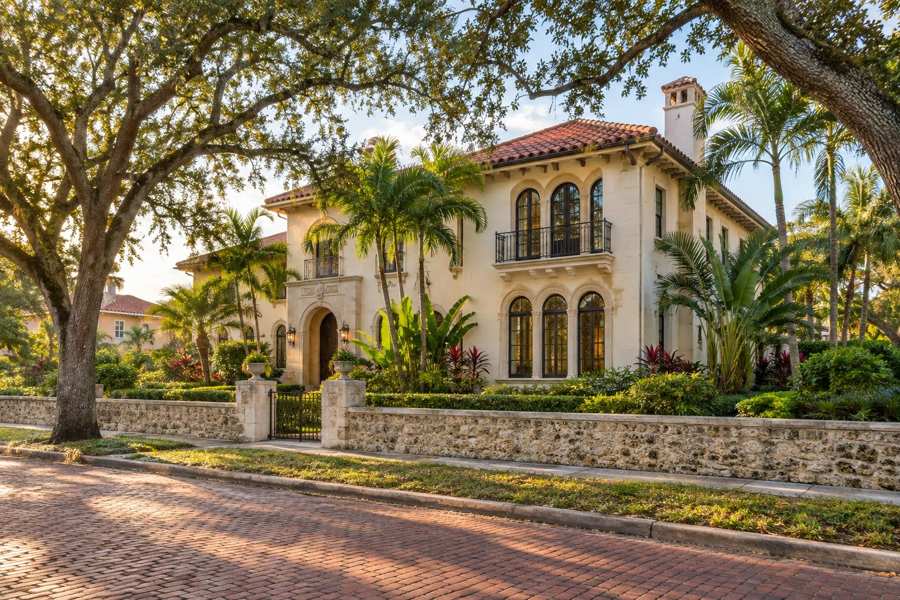
St. Petersburg's Old Northeast is a neighborhood of brick streets, large old houses and a bay view, and in the spring of 2026 it produced three different medians from three pages. Redfin's Old Northeast page says the median sale price in March was $1,660,000, up 111.1%, and that 3 homes sold. Redfin's page for Historic Old Northeast says $1,104,616 for the three months to June, up 13.3%, with 52 homes sold in June. A local MLS review says $980,000 for May on 15 closed sales.
The gap from the highest to the lowest is $680,000, or 69% of the lowest. The waits differ too: 55 days against 48 on the first page, 35 days against 51 on the second and an average of 12 days on the third. The pages describe a neighborhood that sells fast and slowly, high and low, depending on which one a seller reads.
This brief reads the three pages with the Census profile of the postal area that includes Old Northeast and a Realtor.com series for the Tampa area. It asks what a median of three sales can say, why the counts differ, and what the Census shows about the age of the homes. It then sets out what a private sale changes for an owner of an old house in a neighborhood with a name.
Key Findings
- Redfin reported an Old Northeast median sale price of $1,660,000 for March 2026 (up 111.1%), $476 per square foot (up 8.9%), 55 days on market against 48 and 3 homes sold against 8 (Redfin, Old Northeast).
- Redfin reported a Historic Old Northeast median sale price of $1,104,616 for the three months to June 2026 (up 13.3%), $567 per square foot (up 11.6%), 35 days on market against 51 and 52 homes sold in June against 55, and called the market somewhat competitive (Redfin, Historic Old Northeast).
- A local brokerage review of May 2026 MLS data reported a median sold price of $980,000, 12 average days on market, $526 average per square foot and a 98% list-to-sale ratio across 15 closed sales, against $460,000 and 505 sales citywide (Living Central FL, Old Northeast May 2026).
- In the Census postal area, 6,986 of 8,879 housing units (78.7%) were built before 1980, 2,420 (27.3%) before 1940, owners occupy 5,120 of 7,756 occupied homes (66.0%) and 1,123 units (12.6%) are vacant (U.S. Census Bureau, 2020-2024).
- In the Tampa-St. Petersburg-Clearwater area the median days on market rose from 67 in May 2026 to 76 in September (Realtor.com, days on market).
Which Old Northeast is which?
Redfin lists Old Northeast and Historic Old Northeast as separate neighborhoods, each with its own page and its own boundary. Neither page draws the line in words that I could read, and the local review uses the name Old Northeast for what it also calls Historic Old Northeast. A seller who searches the name will find all of them.
The two Redfin pages tell different stories. The first has 3 sales in March, down from 8 a year earlier, a median of $1,660,000 and a price per square foot of $476. The second has 52 sales in June, down from 55, a median of $1,104,616 and $567 a foot. The first page has the higher price and the lower price per foot, which means the three homes that sold were large, or were priced for something other than their size, such as a lot or a view.
The 111.1% rise on the first page is a rise on 8 sales a year earlier, which implies a median of about $786,000 then. A median of 8 sales that rose to a median of 3 sales has little to say about the neighborhood. It says that three homes sold in March and that they were more expensive than the eight a year before.
The second page, with 52 sales, can bear more weight, though a count of 52 in one month is more than three times the 15 closed sales that the local review reports for May. The pages may be counting different property types, such as condominiums, or different boundaries. I cannot tell from them, and a seller should ask which homes any figure covers.
A last point on names. A buyer who searches for Old Northeast will find the pages above and may take one of them as the price of a house. A seller who has read all three can say, calmly, that the figure depends on the page, and that the best comparison is a short list of sales of homes like this one on streets like this one in the last few months.
| Measure | Redfin, Old Northeast (March) | Redfin, Historic (3 months to June) | Local MLS review (May) |
|---|---|---|---|
| Median sale price | $1,660,000 (up 111.1%) | $1,104,616 (up 13.3%) | $980,000 |
| Price per square foot | $476 (up 8.9%) | $567 (up 11.6%) | $526 average |
| Days on market | 55 (48 a year earlier) | 35 (51 a year earlier) | 12 average |
| Homes sold | 3 (8 a year earlier) | 52 in June (55 a year earlier) | 15 closed |
Sources: Redfin and Living Central FL pages as cited. The $680,000, 69% and $786,000 figures are this brief's arithmetic. Commercial content; not independently verified.
Is the wait 12 days, 35 days or 55?
The local review reports an average of 12 days on market for the 15 homes that closed in May and compares it with 24 days for the whole city. Redfin's Historic page says the median is 35 days, down from 51, and Redfin's Old Northeast page says 55, up from 48. A wait of 12 days and a wait of 55 are far apart.
An average of 12 days over 15 sales means that most homes sold within days, though a few may have sat longer, since an average can hide a long tail. A median of 35 over 52 sales means that half sold in under five weeks and half took longer. A median of 55 over 3 sales means the middle one took almost two months.
The honest reading is that the best-priced homes sell within days and the rest take weeks to months. The local review says as much when it says that well-priced homes are absorbed almost immediately. The word that carries the weight is well-priced, and it is the seller who decides whether a home is.
The Tampa-St. Petersburg-Clearwater series shows the region's wait rising from 67 days in May to 68 in June, 72 in July, 74 in August and 76 in September, which is 9 days or 13%. Old Northeast is faster than the region on every page. The Historic page shows a wait that is shorter than a year ago, which is the opposite direction from the region, and the other Redfin page shows a longer one.
There is also the question of what a count of 52 in a single June includes. If the page counts condominiums and townhouses along with houses, the median is a blend of two kinds of home, and the price per square foot of $567 may reflect smaller units that sell for more per foot. The pages do not split the sales by type, so a seller of a house should be careful in comparing with a figure that may include units.
Sources: Redfin, Living Central FL and Realtor.com series as cited. The 9-day and 13% figures are this brief's arithmetic. Commercial content; not independently verified.
What can a median of three sales tell a seller?
A median of three is the second sale in order of price. If the three homes were $1,100,000, $1,660,000 and $2,400,000, the median is $1,660,000, and replacing the largest with a sale at $1,900,000 would leave it unchanged, while replacing the smallest with a sale at $1,800,000 would lift it to $1,800,000. The example is invented, to show the mechanism. A median this thin follows whichever home happens to sit in the middle.
That is why the 111.1% rise on the first Redfin page should not be read as a boom. It compares one small group of sales with another small group a year before, and the second group had 8 homes. Redfin reports the figure faithfully, and the figure is accurate for the homes it counts. It simply does not describe the neighborhood.
The way to use a small count is to read it as a range of what happened and not as a price. Three sales in March at a median of $1.66 million says that at least some buyers paid that much for large homes. The local review's 15 sales at $980,000 says what the middle of a fuller month looked like. The 52 sales at $1,104,616 lies between.
None of the three is a quotation for a particular house. A seller who has a house of 3,000 square feet on a brick street near the water has a different product from a seller with a 1,500 square foot cottage on a side street, and a buyer will treat them differently.
Sources: Redfin and Living Central FL pages as cited. The three-sale example is invented to show the mechanism and is not a recorded sale. Commercial content; not independently verified.
What does a 98 percent list-to-sale ratio cost a seller?
The local review reports that homes sold for 98% of the list price, the same ratio as the city as a whole. A ratio of 98% means a discount of 2%. On a home listed at $1,000,000 that is $20,000 off, which gives the $980,000 median in the review if the median home was listed at that figure. The review does not state it, so this is an illustration.
The ratio compares the sale with the last list price, and a home that was cut during its listing has a lower list price than the one it started with. A home listed at $1,100,000, cut to $1,000,000 and sold at $980,000 shows 98% against the last price and 89% against the first. The page does not say which it uses, and I do not guess.
A discount of 2% may seem small beside a median of $980,000. It is the part that is visible. The sale is also reduced by the fees of a public sale and by whatever the buyer's inspection takes. The sources here do not give the rates or the typical amounts of either in St. Petersburg, and I do not state them.
For an owner, the useful figure is the price received after every charge, and that depends on terms that a median cannot show.
Source: Living Central FL page as cited. The $1,000,000, $20,000, $1,100,000 and 89% figures are this brief's arithmetic and are illustrations, not recorded sales. Commercial content; not independently verified.
What does the Census say about the age of Old Northeast homes?
The Census profile describes the postal area that includes Old Northeast and neighboring parts of St. Petersburg. It counts 16,232 people and 8,879 housing units, of which 7,756 are occupied and 1,123 are vacant, a vacancy rate of 12.6%. Owners live in 5,120 homes (66.0%) and renters in 2,636 (34.0%). Median household income is $107,889 and median gross rent is $1,495 a month.
The homes are old. The median year built is 1955, and 6,986 of the 8,879 units (78.7%) were built before 1980. The largest group, 2,420 homes (27.3%), dates from 1939 or earlier, followed by 1,708 (19.2%) from the 1950s and 1,199 (13.5%) from the 1940s. Altogether 3,619 homes, 40.8%, predate 1950. Only 742 homes, 8.4%, were built since 2010.
Owners estimate the median home at $753,600, with a margin of error of $61,467, or 8.2%. That is between the $460,000 citywide median in the local review and the $980,000 for the neighborhood. It is an estimate for a wider area, so it is not a figure for Old Northeast itself.
The vacancy rate of 12.6% is high. The table I used does not give the reason, and a coastal city may have homes used for part of the year, but I do not claim the cause.
| Indicator | Value | Note |
|---|---|---|
| Population | 16,232 | Whole postal area |
| Housing units | 8,879 | All units |
| Built before 1950 | 3,619 | 40.8% of all units |
| Built before 1980 | 6,986 | 78.7% of all units |
| Vacant units | 1,123 | 12.6% of all units |
| Median household income | $107,889 | Estimate |
| Owner-estimated median value | $753,600 | Margin of error $61,467 |
| Median year built | 1955 | Estimate |
Source: U.S. Census Bureau, American Community Survey 2020-2024 five-year estimates. The 3,619, 40.8%, 742 and 8.4% figures are this brief's arithmetic.
What does a house of 1925 need to sell?
A house built before 1940 is in the largest group in the Census count, 2,420 homes or 27.3% of the area's housing. In a coastal Florida city, such houses carry particular questions. Their roofs and windows may be old, their foundations may be of an earlier type, their wiring and plumbing may have been replaced in parts, and their position near the water may bring questions about flood zones and insurance. I have no source for the condition of Old Northeast homes and make no estimate of costs.
A buyer of such a house asks for records: permits for past work, the age of the roof, the date of the last wiring or plumbing work, any flood or wind-mitigation reports and any insurance history. A seller who has them in a folder answers in a day. A seller who does not has to find them, and the days of searching are days in which a buyer may lose interest.
A buyer also asks what the house will cost to insure. In coastal Florida, insurance can decide whether a buyer proceeds, and a house that is hard to insure is hard to finance. The sources used here do not give insurance costs for St. Petersburg, and I do not estimate them.
For an owner who does not want to gather the records, repair the roof or wait while a buyer's lender and insurer review the house, a direct buyer who takes the property as it is offers a shorter path.
Source: U.S. Census Bureau as cited. The points about older coastal houses are this brief's general reasoning and not findings about Old Northeast.
What do Tampa Bay listings say about the climate?
The Tampa-St. Petersburg-Clearwater series from Realtor.com, published by the Federal Reserve Bank of St. Louis, covers a large region with a median listing price near $400,000. Old Northeast homes sell at more than twice that. The series can show direction.
Active listings were 17,967 in May, 18,022 in June, 18,292 in July, 17,996 in August and 17,965 in September (Realtor.com, active listings). That is flat. New listings fell from 6,200 in May to 5,534 in July. The median listing price was $400,000 in May and $397,450 in July (Realtor.com, median listing price).
Listings with a price reduction numbered 7,004 in January and 7,938 in March, and then 7,596 in May (Realtor.com, price reduced listings). The series I could read ended in May for this measure. With 17,967 active listings in May, 7,596 reductions is about 42% of the stock, if the two series count the same homes.
A flat supply, a longer wait and a large share of cut listings describe a region in which sellers who price high are made to wait. The local review describes a neighborhood in which the best homes sell in days. Both can hold at once. Readers comparing markets can also read the Bella Collina brief and the Crescent Lake brief.
Sources: Realtor.com series on FRED as cited. The 42% figure is this brief's arithmetic and assumes the two series count the same homes. Commercial content; not independently verified.
What does a private sale change for an owner of a historic house?
Privacy is the first change. A listing in a neighborhood whose streets are known by name puts the house, its interior and its price in front of neighbors and local writers, and a local brokerage may publish the sale in a monthly review with the median and the days on market. A private sale involves no showings and no talk among neighbors about the sale.
A flexible closing date is the second. An owner who is moving, settling an estate or buying elsewhere can set the date. No commission and no closing costs are the third and fourth. On a home at $1,100,000, each 1% is $11,000, and I do not state a rate because no source here gives one.
Avoiding inspections and repairs is the fifth, and for a house of the 1920s it carries weight. Old roofs, wiring, plumbing, windows and foundations are the items that fill an inspection report, and in a neighborhood where 40.8% of homes predate 1950, the seller of a historic house should expect a long list. A buyer who purchases as is does not send an inspector, and the seller does not repair or credit anything.
A public listing may produce a better price for a renovated house on a good street, where the local review says homes sell within days. The pages above do not rule that out. They show that three pages give three medians, that the best homes sell quickly and that the rest wait.
An owner choosing a route can use a simple test. Ask what the sale needs to achieve: the highest figure the market might pay, or a sale that is quiet, certain and soon. A historic house on a famous street may attract a buyer who values the address, and a listing may bring that buyer out. It may also bring weeks of showings, an inspection that reads like a history of the house and a negotiation that follows. A seller who prefers to avoid those can ask for a private offer and compare it with what a listing is likely to leave after every charge.
Whichever way the owner leans, it is sensible to ask for the offer in writing, with the price, the closing date, who pays what and any conditions. In a neighborhood where three pages give three medians, the terms of a real offer are firmer than any of them, and a written offer can be set beside a listing plan without guesswork.
Sources: Living Central FL, Redfin and U.S. Census Bureau as cited. The $11,000 figure is this brief's arithmetic for 1% of $1,100,000. The reasoning about owners is this brief's and not a measured finding.
Methodology and limitations
Prices, price per square foot, days on market, sales counts and list-to-sale ratios for Old Northeast come from three commercial pages: two Redfin neighborhood pages with different boundaries and a local brokerage's review of MLS data. They cover different periods and were not independently verified.
Age, tenure, vacancy, income, rent and owner-estimated value come from the American Community Survey 2020-2024 five-year estimates for the postal-code area that includes Old Northeast, which is larger than the neighborhood. Shares are calculated from published counts, and owner-estimated value carries a margin of error.
Days on market, active and new listings, median listing price and price reduced counts are Realtor.com series published by the Federal Reserve Bank of St. Louis for the Tampa-St. Petersburg-Clearwater metropolitan area. They describe the region and not the neighborhood. The brief makes no forecast and values no home.
Conclusion
The Old Northeast record shows three medians, $1.66 million, $1.1 million and $980,000, resting on 3, 52 and 15 sales, waits of 12 to 55 days and a stock of homes in which 78.7% predate 1980.
It does not fix a price for any one home. The choice between a public listing and a private sale comes down to whether an owner would rather compete for a premium on a historic house or take privacy, a flexible closing date, no commission, no closing costs and no inspections or repairs. To see what a direct offer would look like for your home, use the contact form on this page.
Frequently Asked Questions
What is the median home price in Old Northeast, St. Petersburg?
Redfin's Old Northeast page shows $1,660,000 for March 2026 on 3 sales, its Historic Old Northeast page $1,104,616 for three months to June, and a local review $980,000 for May on 15 sales.
Why do the figures differ?
The pages cover different periods and boundaries, and the sales behind them are few.
How fast do Old Northeast homes sell?
From an average of 12 days on one page to a median of 55 days on another.
Are Old Northeast homes old?
In the postal area, 78.7% were built before 1980 and 40.8% before 1950.
Does a private sale always beat a public listing?
No. A public listing can attract competing bids. A private sale offers privacy, a flexible closing date, no commission, no closing costs and no inspections or repairs.
Compare your options before committing. Request a written private offer for your property, with no obligation, then weigh it against your listing plan.
Sources
- Redfin, 2026. Old Northeast, St. Petersburg Housing Market. https://www.redfin.com/neighborhood/73928/FL/St-Petersburg/Old-Northeast/housing-market.
- Redfin, 2026. Historic Old Northeast, St. Petersburg Housing Market. https://www.redfin.com/neighborhood/72608/FL/St-Petersburg/Historic-Old-Northeast/housing-market.
- Living Central FL, 2026. Old Northeast St. Petersburg: May 2026 Sales Data and Buyer's Guide. https://www.livingcentralfl.com/blog/old-northeast-st-petersburg-may-2026-sales-data-buyers-guide/.
- U.S. Census Bureau, 2026. American Community Survey 2020-2024 five-year estimates, the Old Northeast area (via Census Reporter). https://censusreporter.org/profiles/86000US33704-33704/.
- Realtor.com, 2026. Housing Inventory: Median Days on Market in Tampa-St. Petersburg-Clearwater, FL (CBSA). https://fred.stlouisfed.org/series/MEDDAYONMAR45300.
- Realtor.com, 2026. Housing Inventory: Active Listing Count in Tampa-St. Petersburg-Clearwater, FL (CBSA). https://fred.stlouisfed.org/series/ACTLISCOU45300.
- Realtor.com, 2026. Housing Inventory: Median Listing Price in Tampa-St. Petersburg-Clearwater, FL (CBSA). https://fred.stlouisfed.org/series/MEDLISPRI45300.
- Realtor.com, 2026. Housing Inventory: Price Reduced Count in Tampa-St. Petersburg-Clearwater, FL (CBSA). https://fred.stlouisfed.org/series/PRIREDCOU45300.
Related research

Seller Guide · October 6, 2026
How to Prepare Point Pleasant Beach Rental Records Before Selling
Separate rental approval, income history and booked stays before comparing sale terms.

Seller Guide · October 6, 2026
How to Prepare Rumson Flood and Waterfront Records Before Selling
Separate flood disclosure, elevation, repairs and waterfront rights before comparing sale terms.

Seller Guide · October 6, 2026
How to Prepare Sarasota Condo Inspection and Reserve Records Before Selling
Separate building condition, reserve funding and resale documents before comparing sale terms.