Market Brief · by Aidan Sowa · October 5, 2026
Why Did the Silverleaf Wait Grow? Reading a Longer Wait on the Market
Reading a Longer Wait on the Market for Silverleaf, AZ, with each source dated and its limits noted, for owners weighing a listing against a direct sale.
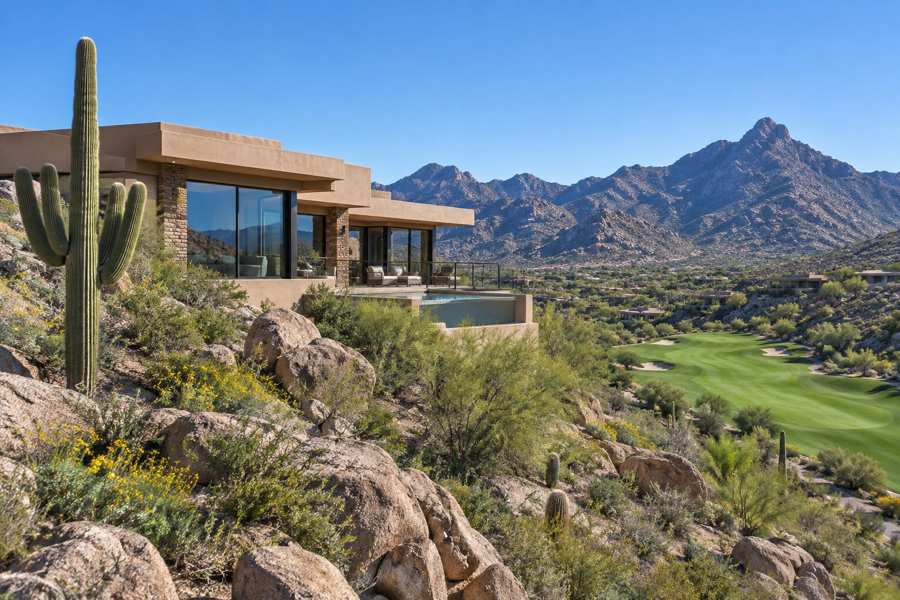
How long does it take to sell a home in Silverleaf? On the Realtor.com page for the neighborhood, the answer is a median of 114 days in May 2026, up 35.71% on the month. On the page for DC Ranch, built from charts that end in February, the same neighborhood shows 80 days. A brokerage report puts it at 84 days for March and Redfin at 74. In three months the wait on one site grew by 34 days, or 42.5%, while the median sold price rose 19.17% on the year to $5,750,000.
The price story has two sides. The median listing price on the latest page is $5,972,500, down 11.52% on the year. On the February page it was $6,895,000. A fall of $922,500, or 13.4%, in three months does not look like a market with rising prices, yet the sold median is up by a fifth. Both can be true in a place where a few dozen homes are for sale and the mix changes with each sale.
This brief reads the Realtor.com page beside two local brokerage reports, adds the Census profile of the postal area and the Phoenix area series, and asks what the numbers mean for an owner who is choosing between a public listing and a private sale.
Key Findings
- Realtor.com reported, as of May 2026, a median listing price of $5,972,500 for Silverleaf (down 11.52% on the year and up 42.29% on three years), a median sold price of $5,750,000 (up 19.17% and up 85.10%), $1,081 per square foot (down 2.44% and up 19.58%), 65 homes for sale (down 5.08% and up 16.67%) and a median of 114 days on market (down 2.56% and up 60.56%).
- The same page gave a sale-to-list ratio of 98%, with homes selling 2.07% below the asking price, and called May 2026 a balanced market. It counted 6 rentals at a median rent of $18,000 a month, up 26.32% on the month.
- A local brokerage report gave a Redfin median sale price of $5.075 million for March 2026 (up 11.3%), $1,040 per square foot (up 23.0%), 20 homes sold and 74 days on market. It gave Realtor.com figures of 68 active listings, a median listing price of $6.8 million and 84 days, and said Realtor.com classed March as a buyer's market.
- In the Census postal area that includes Silverleaf, 19,829 of 23,364 housing units are occupied, 3,535 (15.1%) are vacant, owners hold 14,490 of the occupied homes (73.1%), the median household income is $140,616 and the owner-estimated median home value is $1,036,800 (Census Reporter, American Community Survey profile).
- In the Phoenix-Mesa-Scottsdale area the median days on market was 60 in May 2026 and 62 in September (Realtor.com, days on market).
How many homes are really for sale?
The Realtor.com page for Silverleaf shows 65 homes for sale in May. The page for DC Ranch shows 73 in February, up 16.67% on the year. The brokerage report from March shows 68. A second local report, written from data to January, says there are about 40 active listings at any given time. That makes four counts, from 40 to 73.
The second report also gives the size of the neighborhood: 736 homesites across more than 2,000 acres. Against that, 65 homes for sale is 8.8% of the homesites, 73 is 9.9% and 40 is 5.4%. A neighborhood with roughly one home in eleven on offer is not a thin market for a place of its size, but it is thin in absolute terms, and one extra sale or listing moves the count by 1.5%.
On the May page the stock is down 5.08% on the year and 9.68% on the month, and up 16.67% on three years. The year-ago count works out near 68 and the count three years earlier near 56, which is this brief's arithmetic from the stated changes. The neighborhood has more homes on offer than it had in 2023, but fewer than a year ago.
The two stock figures are worth setting beside the wait. From 73 to 65 is a drop of eight homes, 11.0%, over three months in which the wait rose by more than 40%. Fewer homes and a longer wait together are unusual, and they suggest that the listings which remain are the harder ones to sell, and not that demand has fallen across the board.
A buyer sees 65 choices and a seller sees 64 rivals. In a market of identical flats that would be a lot. In a market of estates, no two of which are alike, most of the 64 are not rivals at all. A $4 million villa and a $20 million hillside estate do not compete for the same buyer, and the count says little about either.
| Source and date | Homes for sale | Median listing price | Days on market |
|---|---|---|---|
| Realtor.com DC Ranch page, February 2026 | 73 | $6,895,000 | 80 |
| Brokerage report, March 2026 | 68 | $6.8 million | 84 |
| Realtor.com Silverleaf page, May 2026 | 65 | $5,972,500 | 114 |
| Second brokerage report, data to January 2026 | about 40 | about $7.2 million | not stated |
Source: Realtor.com page as cited and two local brokerage reports. The 8.8%, 9.9%, 5.4%, 1.5%, 68 and 56 figures are this brief's arithmetic. The reading of what the counts mean is this brief's reasoning. Commercial content; not independently verified.
Why did the wait grow from 80 days to 114?
The Silverleaf table on the DC Ranch page showed 80 days, down 28.57% on the year. The Silverleaf page shows 114, down 2.56% on the year and up 60.56% on three years. The brokerage report shows 84 on Realtor.com and 74 on Redfin for March. The wait has risen 34 days since February, and it is 43 days longer than the three-year-old figure of about 71.
A rise in a median wait does not always mean that homes got slower. The median for listed homes counts the days that every current listing has been on the market. When a few quick sales leave and the stale listings stay, the median rises even if nothing about demand has changed. In a neighborhood with 65 homes, a change of a handful of listings can add weeks.
The page's own rise is large. The month-on-month change is 35.71%, and the median listing price fell 12.17% in the same month. Taken together, the homes for sale in May are cheaper and older than the homes for sale in April. That fits the idea that the homes which were priced right sold and the rest are being cut.
A seller can read the four figures as a range. Redfin's 74 days for March is the quickest, since it counts only homes that sold. Realtor.com's 80, 84 and 114 count homes that were listed at the time, and they rise with each snapshot. If the seller's home is priced where the buyers are, the shorter figure is the right one. If the price is in the upper part of the range, the longer one is a fairer guide.
The region is a good comparison. The Phoenix median in May was 60 days. Silverleaf at 114 is 54 days, or 90%, longer than the region. A buyer at $5 million or more is a rarer person than a buyer at $475,000, and it takes longer to find them. A seller of an estate should plan on a wait of three or four months, and more if the price is above the bracket.
Source: Realtor.com pages and local brokerage reports as cited, and Realtor.com series for the Phoenix area. The 34 day, 42.5%, 71 day, 43 day, 54 day and 90% figures are this brief's arithmetic. The explanation of the median is this brief's reasoning and not a statement of the pages. Commercial content; not independently verified.
Can the listing price fall while the sold price rises?
Yes, and the Silverleaf pages show both. The listing median fell from about $7.2 million in January to $6,895,000 in February, $6.8 million in March and $5,972,500 in May. From January to May that is a fall of 17.0%. The sold median was $5.05 million in January in the second report, $5.075 million in March on Redfin and $5,750,000 in May on Realtor.com, a rise of 13.9% from the first figure to the last.
Part of this is the mix of homes. The latest listing median implies a typical asking price near $6.75 million a year earlier, and the sold median implies about $4.83 million. The typical sale is now above the typical sale of a year ago while the typical asking price is below. The sales that closed were of more expensive homes than before, and the homes still for sale are cheaper than the ones that left.
There is a simple lesson for an owner who is deciding how to price. An asking price of $6 million that is cut to $5.75 million closes a sale at 95.8% of the original. An asking price of $7 million that sits for 114 days and is then cut to $5.75 million closes at 82.1% of the original, after nearly four months of carrying costs. The second path costs far more than the first, though the final price is the same. These are illustrations of arithmetic and not claims about any listing. The point is that time on the market is a cost, and a price that starts too high turns a short wait into a long one.
The gap between the two latest medians is $222,500, which is 3.7% of the listing median. The sale-to-list ratio of 98% and the 2.07% discount imply that a typical $5.75 million sale gave up about $119,000 from its asking price. That is a negotiation of a size an owner can plan for, and it is small beside the swings in the medians.
The price per foot is steadier. It is $1,081, down 2.44% on the year, against $1,105 on the February page and $1,040 in March on Redfin. An asking price of $5,972,500 at $1,081 per foot implies a typical home near 5,500 square feet. For an owner, the per foot figure is the one to check first.
Source: Realtor.com pages and local brokerage reports as cited. The 17.0%, 13.9%, $6.75 million, $4.83 million, $222,500, 3.7%, $119,000 and 5,500 square foot figures are this brief's arithmetic from the stated figures. The reading of the mix is this brief's reasoning. Commercial content; not independently verified.
Which Silverleaf is the median describing?
The second brokerage report describes a neighborhood with very different parts. The entry points, around $3 million, are attached residences in Park Villas, Verandah and Casitas, of 2,750 to 4,700 square feet. Custom estates in Horseshoe Canyon and The Parks trade between $5 million and $12 million. Upper Canyon estates run from about $8 million to over $30 million.
The same report says that the most expensive home sold in Scottsdale in December 2025 was a Silverleaf property at $25.8 million. It also says that Scottsdale's overall 2025 median sold price was $1,180,000, so a Silverleaf sold median of $5,750,000 is 4.9 times it. A median is the middle of that spread, and a house at either end is a different case.
The practical point for an owner is that a Silverleaf median is a weak guide. A villa at $3.5 million and an Upper Canyon estate at $15 million share an address, a gate and a club, and little else. A buyer of one will not look at the other. An owner should find the sales in their own group before reading anything into the neighborhood number.
The table of nearby areas on the Realtor.com page shows the contrast with the surroundings. North Scottsdale has a median listing of $1,399,000, DC Ranch $3,500,000 and Ironwood Village $1,067,500. Silverleaf's $5,972,500 is 4.3 times the first, 1.7 times the second and 5.6 times the third. Silverleaf is the top of a ladder, and each rung up is a smaller group of buyers.
Source: Realtor.com page and a local brokerage report as cited. The 4.9, 4.3, 1.7 and 5.6 figures are this brief's arithmetic. The reading of the spread is this brief's reasoning. Commercial content; not independently verified.
What does the Census say about the postal area around Silverleaf?
In the postal area that includes Silverleaf, the median household income is $140,616 and the owner-estimated median home value is $1,036,800, with a margin of error of $47,867. The Silverleaf sold median of $5,750,000 is 40.9 times the income and 5.5 times the Census value. The neighborhood lies far outside the area's ordinary range.
The area has 23,364 homes and 45,346 people. Its stock is young: 9,254 homes from the 1990s (39.6%), 6,736 from the 2000s (28.8%), 3,861 from the 2010s (16.5%) and 972 from 2020 or later (4.2%). Homes from the last fifteen years number 4,833, which is 20.7%. The median year built is 2000.
The age of the area matters less to an estate than to a typical house, since the homes in Silverleaf are mostly newer than the postal area as a whole and are built to a higher standard. The area's numbers are still a useful reminder that a buyer comparing Silverleaf with the rest of the area is comparing a very small, very costly part with a large and ordinary whole, and that the pull of the ordinary median is strong in any figure that mixes the two.
Owners hold 14,490 of the 19,829 occupied homes, 73.1%, and renters 5,339, 26.9%. The 3,535 vacant homes are 15.1% of the stock. The rent shows the gap again. The Census median gross rent is $2,483, and the Silverleaf median rent on Realtor.com is $18,000, 7.2 times as much. A year of that rent, $216,000, is 1.5 times the area's median household income.
Source: U.S. Census Bureau, American Community Survey 2020-2024, and Realtor.com as cited. Ratios, shares and gaps are this brief's arithmetic.
What does the Phoenix series add, and what should an owner ask?
The neighborhood figures end in the spring. The Phoenix series run to the autumn. The regional median listing price fell from $498,000 in May to $475,000 in August and September (Realtor.com, median listing price), a fall of 4.6%, and the Silverleaf listing median is 12.0 times the May figure. Active listings were 19,517 in May and 18,437 in September (Realtor.com, active listings), a fall of 5.5%.
New listings fell from 8,670 in March to 5,854 in July (Realtor.com, new listings), and homes with a price cut from 10,902 to 8,348 (Realtor.com, price reduced listings). In July, 47.3% of the region's active homes had a cut, and Silverleaf's own fall in the listing median suggests that many of its sellers have cut too.
The regional price cut figure is a useful reminder of how common a cut is. In July, 8,348 of the region's 17,661 active homes had cut their price. A seller who lists high and expects to hold may find that a buyer who has watched the market expects a cut too, and the first cut often invites a second.
Whether an offer is public or private, an owner can test it with plain questions. What is the price, and is any part conditional on an inspection, a loan or the sale of another home? What will I take home after every charge? When will the sale close, and can the date move? Who pays for repairs the buyer asks for?
For an estate there are more. What are the club's membership transfer rules and costs? What do the design guidelines allow a buyer to change? What does an inspection say about a large roof, several cooling units, a pool, a guest house and hillside drainage? At 114 days, how much does an owner pay in taxes, insurance, staff and upkeep before a buyer arrives? Readers comparing markets can also read the DC Ranch brief and the Pinnacle Peak brief.
Source: Realtor.com series published by the Federal Reserve Bank of St. Louis as cited. The 4.6%, 12.0, 5.5% and 47.3% figures are this brief's arithmetic. The questions are this brief's general reasoning and not statements of any source.
What does a private sale change?
Maison Off-Market buys homes directly from their owners. It does not list a home, hold showings or put a home on a public listing. For a Silverleaf owner, the five benefits are plain. There are no showings and no neighbors talking about the sale. The closing date can be flexible, which gives time to find a new home. There are no commission costs and no closing costs for the seller, and there are no inspections and repairs.
A little arithmetic shows what that is worth. Each 1% of a $5,750,000 sale is $57,500. A seller who gives up 3% gives up $172,500, and one who gives up 5% gives up $287,500. This brief does not claim that those are the costs of any sale, since the real figures depend on the agreement the seller signs. It shows how quickly a percentage becomes a sum.
At this price level, privacy has a value of its own. A public sale of an estate brings tours, photographs and a record of the price, and many owners at this level would rather avoid all three. The trade is that a private buyer may offer a price that differs from what a public sale could bring. The useful comparison is the price after every cost and every week of waiting, set against a closing date the seller picks.
Maison Off-Market speaks only to sellers. An owner who wants to know what a direct offer would look like can use the contact form below, or call 401-219-4207, and ask for a figure with no showings, no listing and no obligation.
Source: Maison Off-Market. The fee figures are this brief's arithmetic and not claims about any sale.
Methodology and limitations
Prices, price per square foot, days on market, listing and rental counts and the nearby-area tables for Silverleaf come from a national listing site page with charts to April 2026, from the same site's page for DC Ranch with charts to February 2026, and from two local brokerage reports with figures to January and March 2026. They count different things and are not independently verified.
Age, tenure, vacancy, income, rent and owner-estimated value come from the American Community Survey 2020-2024 five-year estimates for the postal-code area that includes Silverleaf. Shares are calculated from published counts, and owner-estimated value carries a margin of error.
Days on market, active and new listings, median listing price and price reduced counts are Realtor.com series published by the Federal Reserve Bank of St. Louis for the Phoenix-Mesa-Scottsdale metropolitan area. They describe the region and not the neighborhood. The brief makes no forecast and values no home.
Conclusion
The Silverleaf record shows a sold median of $5,750,000 up 19.17% while the listing median fell from $6.9 million to $6.0 million, a wait that grew from 80 days to 114, counts of homes for sale from 40 to 73 and a neighborhood whose parts span $3 million to over $30 million.
It does not fix a price for any one home. The choice between a public listing and a private sale comes down to whether an owner would rather compete in that market or take privacy, a flexible closing date, no commission, no closing costs and no inspections or repairs. To see what a direct offer would look like for your home, use the contact form below or call 401-219-4207.
Frequently Asked Questions
What is the median home price in Silverleaf?
Realtor.com reports a median sold price of $5,750,000 for May 2026, up 19.17%, and a median listing price of $5,972,500, down 11.52%.
How long do Silverleaf homes take to sell?
Realtor.com reports a median of 114 days for May 2026, against 80 days on an earlier page. A local report quoting Redfin gives 74 days for March.
Is Silverleaf a buyer's or a seller's market?
Realtor.com calls May 2026 balanced, with a sale-to-list ratio of 98%, and a local report says it called March a buyer's market.
How many homes are for sale in Silverleaf?
Realtor.com reports 65 in May 2026. Other sources give between about 40 and 73.
Does a private sale always beat a public listing?
No. A public listing can attract competing bids. A private sale offers privacy, a flexible closing date, no commission, no closing costs and no inspections or repairs.
Compare your options before committing. Request a written private offer for your property, with no obligation, then weigh it against your listing plan.
Sources
- Realtor.com, 2026. Silverleaf Neighborhood of Scottsdale, AZ Housing Market. https://www.realtor.com/local/market/arizona/scottsdale/silverleaf.
- North Scottsdale Real Estate Advisors, 2026. Silverleaf Real Estate Market Report: Current Home Values, Trends and Inventory. https://www.northscottsdale.realestate/blog/silverleaf-real-estate-market-report-current-home-values-trends-inventory/.
- Neighbors Luxury Real Estate, 2026. DC Ranch and Silverleaf Real Estate Market Trends in 2026. https://neighborsluxury.com/blog/dc-ranch-and-silverleaf-luxury-market-trends-for-buyers-and-sellers.
- U.S. Census Bureau, 2026. American Community Survey 2020-2024 five-year estimates, the Silverleaf area (via Census Reporter). https://censusreporter.org/profiles/86000US85255-85255/.
- Realtor.com, 2026. Housing Inventory: Median Days on Market in Phoenix-Mesa-Scottsdale, AZ (CBSA). https://fred.stlouisfed.org/series/MEDDAYONMAR38060.
- Realtor.com, 2026. Housing Inventory: Median Listing Price in Phoenix-Mesa-Scottsdale, AZ (CBSA). https://fred.stlouisfed.org/series/MEDLISPRI38060.
- Realtor.com, 2026. Housing Inventory: Active Listing Count in Phoenix-Mesa-Scottsdale, AZ (CBSA). https://fred.stlouisfed.org/series/ACTLISCOU38060.
- Realtor.com, 2026. Housing Inventory: New Listing Count in Phoenix-Mesa-Scottsdale, AZ (CBSA). https://fred.stlouisfed.org/series/NEWLISCOU38060.
- Realtor.com, 2026. Housing Inventory: Price Reduced Count in Phoenix-Mesa-Scottsdale, AZ (CBSA). https://fred.stlouisfed.org/series/PRIREDCOU38060.
Related research

Seller Guide · October 6, 2026
How to Prepare Point Pleasant Beach Rental Records Before Selling
Separate rental approval, income history and booked stays before comparing sale terms.

Seller Guide · October 6, 2026
How to Prepare Rumson Flood and Waterfront Records Before Selling
Separate flood disclosure, elevation, repairs and waterfront rights before comparing sale terms.

Seller Guide · October 6, 2026
How to Prepare Sarasota Condo Inspection and Reserve Records Before Selling
Separate building condition, reserve funding and resale documents before comparing sale terms.