Market Brief · by Aidan Sowa · October 5, 2026
Which DC Ranch Price Is the Sale? Reading Different Sale Medians
Reading Different Sale Medians for DC Ranch, AZ, with each source dated and its limits noted, for owners weighing a listing against a direct sale.
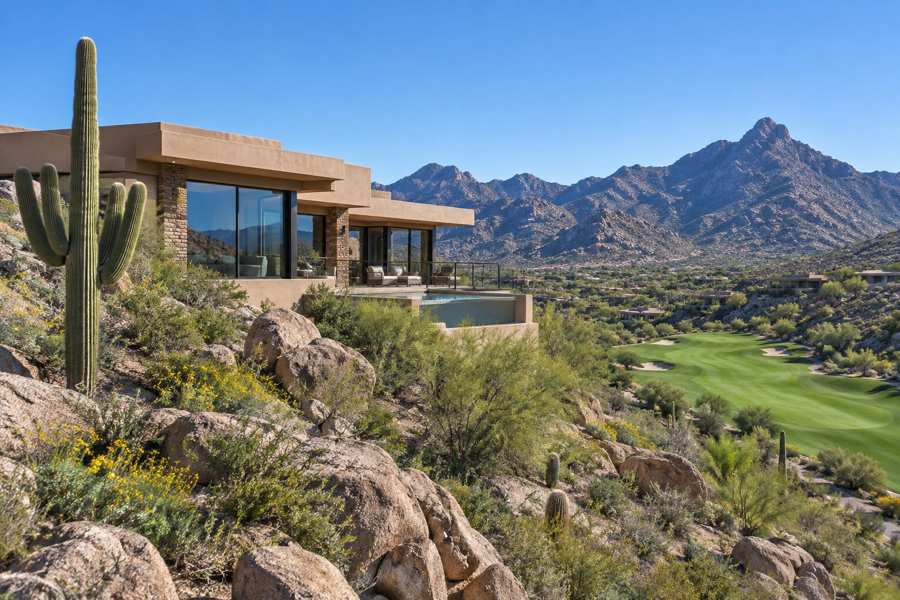
What does a home in DC Ranch sell for? In February 2026, Redfin said that the median sale price was $1.8 million, down 3.9% on the year. A month later, a brokerage report that quotes Redfin put the March median at $2.5 million, up 35.1%. The first figure is 28% below the second, and the two are a month apart. Neither page is wrong. A community with a small number of sales and very large houses can swing 39% in a month on the mix of homes that happened to close.
The listing side is higher again. Realtor.com's page for DC Ranch gives a median listing price of $3.5 million, up 15.32% on the year, with 140 homes for sale. Redfin's price per square foot is $649, up 24.0%. A buyer who reads the three figures sees a sale price of $1.8 million, an asking price of $3.5 million and a price per foot that has risen by a quarter. They describe different groups of homes.
This brief reads the Realtor.com page and the Redfin page side by side, adds a brokerage market report, the Census profile of the postal area and the Phoenix area series, and asks what the numbers mean for an owner who is choosing between a public listing and a private sale.
Key Findings
- Realtor.com reported, as of March 2026, a median listing price of $3,500,000 for DC Ranch (up 15.32% on the year and up 26.13% on three years), $809 per square foot (up 12.05% and up 24.85%), 140 homes for sale (flat on the year and up 14.78% on three years) and a median of 55 days on market (flat and down 33.73%).
- The same page gave a sale-to-list ratio of 97%, with homes selling 2.55% below the asking price in February, and called the market a seller's market. It gave a Hotness Index of 71, ranked DC Ranch 929th in the country and counted 40 rentals at a median rent of $6,000 a month (up 9.11% on the year).
- Redfin reported, for February 2026, a median sale price of $1.8 million (down 3.9% on the year), $649 per square foot (up 24.0%), 72 days on market against 69 a year earlier and 66 homes sold against 47. It called the market somewhat competitive and gave a sale-to-list ratio of 96.0%.
- In the Census postal area that includes DC Ranch, 19,829 of 23,364 housing units are occupied, 3,535 (15.1%) are vacant, owners hold 14,490 of the occupied homes (73.1%), the median household income is $140,616 and the owner-estimated median home value is $1,036,800 (Census Reporter, American Community Survey profile).
- In the Phoenix-Mesa-Scottsdale area the median days on market was 60 in May 2026, 64 in June, 67 in July and August and 62 in September (Realtor.com, days on market).
Why are there four prices for one community?
The brokerage report gives a fuller list. For March 2026 it quotes Redfin at a median sale price of $2.5 million, up 35.1%, and $687 per square foot, up 14.5%. It quotes Zillow at an average home value of $2,446,449, with 68 homes for sale. It quotes Realtor.com at 142 active listings and a median listing price of $3.75 million. The report says the platforms use different methods and timing windows.
Set the numbers side by side and the gap is wide. The Redfin sale median is $1.8 million in February and $2.5 million in March. The Zillow value is $2.45 million. The Realtor.com listing median is $3.5 million on the page and $3.75 million in the report. The lowest figure is under half the highest, which is $1.95 million, or 52%, less.
The Redfin swing from February to March is $700,000, or 38.9%, in a single month. A community of this kind does not change in value by that much in four weeks. What changed was the set of homes that sold. If a handful of sales in March were of estates at $4 million or more, and February's were mostly smaller homes, the median jumps. Redfin's own page says 66 homes sold in February, and a median of 66 sales is a modest base for a neighborhood of very large houses.
The right reading is a range. A typical sale in DC Ranch in early 2026 sits somewhere between $1.8 million and $2.5 million, a typical asking price is $3.5 million or more, and the gap between asking and selling says that sellers list high. A seller who anchors on the $3.5 million page figure may wait a long time for a buyer.
| Measure | Source and month | Figure | Change on the year |
|---|---|---|---|
| Median sale price | Redfin, February 2026 | $1.8 million | -3.9% |
| Median sale price | Brokerage report quoting Redfin, March 2026 | $2.5 million | +35.1% |
| Average home value | Brokerage report quoting Zillow, March 2026 | $2,446,449 | not stated |
| Median listing price | Realtor.com, March 2026 | $3,500,000 | +15.32% |
Source: Redfin and Realtor.com pages as cited, and a brokerage market report that quotes Redfin, Zillow and Realtor.com. The $1.95 million, 52%, $700,000 and 38.9% figures are this brief's arithmetic. The explanation based on the mix of sales is this brief's reasoning and not a statement of any source. Commercial content; not independently verified.
Is a price per foot up 24 percent a rise in value?
Redfin says that the median sale price per square foot is $649, up 24.0% on the year, while the median sale price itself is down 3.9%. Those two cannot both describe the same homes. If the price per foot rises by a quarter and the price falls by four percent, the typical house that sold was about 22% smaller than the typical house a year earlier. That is arithmetic, and it points to a change in the mix of sales and not a change in the value of any one house.
The Realtor.com figures show a milder version. The median listing price is up 15.32% and the price per foot is up 12.05%, close enough to suggest that the listed homes are of roughly similar size. The year-ago listing median works out near $3,035,000, and the year-ago price per foot near $722. On three years the listing median is up 26.13% to $3.5 million, which implies about $2,775,000 in early 2023.
The asking price per foot is $809 on Realtor.com and the sale price per foot is $649 on Redfin. The sale figure is 20% lower. A part of that gap is the usual distance between hope and result, which the page puts at 2.55% below asking on average, or about $89,250 on a $3.5 million home. The rest is the difference between the homes that are listed and the homes that sell.
What a seller can take from this is that a price per foot is a better guide than a median price, but only if the comparison homes are similar in size, age, view and lot. In a community with 26 neighborhoods, according to the brokerage report, a house on a golf fairway and a house on an interior street are close in distance and far apart in price.
Source: Redfin and Realtor.com pages as cited, and a brokerage market report. The 22%, $3,035,000, $722, $2,775,000, 20% and $89,250 figures are this brief's arithmetic from the stated changes. The explanation based on the mix of homes is this brief's reasoning. Commercial content; not independently verified.
Is the wait 55 days, 66 or 72?
Realtor.com says that homes in DC Ranch sell in a median of 55 days, flat on the year and down 33.73% on three years, which implies about 83 days in early 2023. Redfin says 72 days in February, against 69 a year earlier, and 59 days to go pending on its competitiveness page. The brokerage report quotes 66 days for March and Realtor.com at 67.
The range is 55 to 72 days, which is 17 days wide. As with the price, the measures differ. Realtor.com measures the time on the market of the homes that are listed now. Redfin measures the time that the homes which sold had been on the market. A home priced to sell is gone in a few weeks, and a home that is not stays in the Realtor.com figure and lifts it.
The Realtor.com Hotness Index puts DC Ranch at 71, ranked 929th nationally, and says homes sell 14.75 days faster than the national average, which implies a national median near 70 days. Listings get 1.14 times the views of the average listing. The page labels the score Hot, one step below Very hot.
The three-year comparison is also worth a look. A median of 83 days in early 2023 and 55 now says that the wait has shortened by about a third, which is a long way from a slow market. The year-on-year figure is flat, though, so the improvement happened earlier and has stopped. An owner who expects it to continue should note that the page shows no change over the last twelve months.
For a seller, a wait of eight to ten weeks should be the planning figure. The best-priced homes will beat it. The rest will not, and in a neighborhood where the typical home carries a seven figure price, ten weeks of taxes, insurance, a pool and a landscape are a real cost.
Source: Redfin and Realtor.com pages as cited, and a brokerage market report. The 83 day, 17 day and 70 day figures are this brief's arithmetic. The explanation of the measures is this brief's reasoning. Commercial content; not independently verified.
Where does DC Ranch end and Silverleaf begin?
The brokerage report describes DC Ranch as a 4,400 acre community with four residential villages, 26 neighborhoods, about 2,800 homes and about 7,000 residents. Silverleaf is one of the four villages. That is the community's own structure, and it creates a problem for any data page, because a count for DC Ranch may or may not include Silverleaf.
The Realtor.com table for DC Ranch lists Silverleaf with 73 homes for sale, up 16.67%, a median listing price of $6,895,000, $1,105 per square foot and a wait of 80 days. The page gives 140 homes for DC Ranch as a whole. If Silverleaf is inside the 140, it is 52.1% of the stock. The Silverleaf page, built from charts that end in April, lists DC Ranch with 131 homes and Silverleaf itself with 65. Each page treats the other as a neighbor.
The consequence is that the median for DC Ranch depends on whether the most expensive village is counted. The median listing price in the Silverleaf table, $6,895,000, is almost twice the DC Ranch median of $3.5 million. A community whose median listing is $3.5 million and whose richest village lists at $6.9 million is a community with a long upper tail, and the median tells an owner little about a house in the tail.
There is a practical point for a seller as well. A comparison sale from the golf villages may carry a club membership, a view over a fairway or a lot of a size that an interior street cannot match. Using it to price a house on a smaller lot will produce a number that is too high, and using an interior street sale to price a fairway home will produce one that is too low. Both errors cost the seller, one in time and the other in money.
This brief treats DC Ranch as its own market and does not combine it with Silverleaf. An owner should do the same. The question to ask any agent or any data page is which homes are in the figure, and a figure for DC Ranch that includes the golf villages is not the figure for a house on an interior street.
Source: Realtor.com pages as cited, and a brokerage market report for the description of the community. The 52.1% figure and the comparison of medians are this brief's arithmetic. The reading of the overlap is this brief's reasoning and not a statement of the pages. Commercial content; not independently verified.
What does the Census say about homes built mostly since 1990?
In the postal area that includes DC Ranch, the median household income is $140,616 and the owner-estimated median home value is $1,036,800, with a margin of error of $47,867. The Realtor.com listing median of $3.5 million is 3.4 times the Census value, and the Redfin sale median of $1.8 million is 1.7 times. DC Ranch sells at a large premium to the postal area as a whole.
The postal area has 23,364 homes and 45,346 people. Its housing stock is young: 9,254 homes from the 1990s (39.6%), 6,736 from the 2000s (28.8%), 3,861 from the 2010s (16.5%) and 972 from 2020 or later (4.2%). Homes built since 1990 are 89.1% of the total, and the median year built is 2000.
Owners hold 14,490 of the 19,829 occupied homes, 73.1%, and renters 5,339, 26.9%. The 3,535 vacant homes are 15.1% of the stock. The Census does not say why they are vacant. A high share of seasonal and second homes would be consistent with a desert area that is busiest in winter, but the table cannot show that.
The age of the stock cuts two ways for a seller. A home built in 1998 has mature landscaping and a settled street, and a buyer may value both. It is also 28 years old, so a public buyer's inspector will look hard at the roof, the cooling units, the pool equipment and the windows. A repair request after an inspection is one of the common ways that a public sale loses money between the contract and the closing, and the seller has little say in how it goes.
Because so much of the area was built in one burst between 1990 and 2009, those items tend to age together. That is a reason for an owner to ask what the home would need before a buyer sees it, and what a buyer who skips the inspection would pay.
The rent figures show the premium again. The Census median gross rent is $2,483 a month, which is 21.2% of the median income over a year. Realtor.com's median rent in DC Ranch is $6,000, up 9.11% on the year, which would take 51.2% of that same income. The $6,000 rent is 2.4 times the Census rent, and it is the rent of a different class of house.
Source: U.S. Census Bureau, American Community Survey 2020-2024, and Realtor.com and Redfin as cited. Ratios, shares and gaps are this brief's arithmetic. The explanation about seasonal homes is this brief's reasoning and not a statement of the Census.
What does the Phoenix area add, and what should an owner ask?
The community figures end in the winter. The Phoenix-Mesa-Scottsdale series run to the autumn. Active listings fell from 19,517 in May 2026 to 17,707 in August, then rose to 18,437 in September (Realtor.com, active listings). New listings fell from 8,670 in March to 5,854 in July (Realtor.com, new listings), a drop of 32.5%.
The median listing price for the region was $498,000 in May and $475,000 in August and September (Realtor.com, median listing price), a fall of 4.6%. Homes with a price cut were 9,904 in May and 8,348 in July (Realtor.com, price reduced listings), which is 50.7% and 47.3% of the active homes in those months. The DC Ranch listing median of $3.5 million is 7.4 times the regional $475,000.
Whether an offer is public or private, an owner can test it with plain questions. What is the price, and is any part of it conditional on an inspection, a loan or the sale of another home? What will I take home after every charge? When will the sale close, and can the date move? Who pays for repairs the buyer asks for?
In a gated golf community there are more. What are the homeowners association's transfer fees and rules on sales? Does a club membership pass to the buyer, and at what cost? Are there design covenants that limit a buyer's changes? What does a buyer's inspection say about roofs, cooling units and pool equipment in homes that are now mostly 15 to 35 years old? Readers comparing markets can also read the North Scottsdale brief and the Silverleaf brief.
Source: Realtor.com series published by the Federal Reserve Bank of St. Louis as cited. The 32.5%, 4.6%, 50.7%, 47.3% and 7.4 figures are this brief's arithmetic. The questions and the age range are this brief's general reasoning and not statements of any source.
What does a private sale change?
Maison Off-Market buys homes directly from their owners. It does not list a home, hold showings or put a home on a public listing. For a DC Ranch owner, the five benefits are plain. There are no showings and no neighbors talking about the sale. The closing date can be flexible, which gives time to find a new home. There are no commission costs and no closing costs for the seller, and there are no inspections and repairs.
A little arithmetic shows what that is worth. Each 1% of a $2,500,000 sale is $25,000. A seller who gives up 3% gives up $75,000, and one who gives up 5% gives up $125,000. This brief does not claim that those are the costs of any sale, since the real figures depend on the agreement the seller signs. It shows how quickly a percentage becomes a sum.
The trade is that a private buyer may offer a price that differs from what a public sale could bring. With a spread between $1.8 million and $3.5 million in the published figures, an owner needs a price for their own house, not the community's. The useful comparison is the price after every cost and every week of waiting, set against a closing date the seller picks.
Maison Off-Market speaks only to sellers. An owner who wants to know what a direct offer would look like can use the contact form below, or call 401-219-4207, and ask for a figure with no showings, no listing and no obligation.
Source: Maison Off-Market. The fee figures are this brief's arithmetic and not claims about any sale.
Methodology and limitations
Prices, price per square foot, days on market, listing and rental counts and the neighborhood tables for DC Ranch come from two commercial pages, a national listing site page with charts to February 2026 and a national brokerage page with figures to February 2026, and from one local brokerage report with figures for March 2026. They count different things and are not independently verified.
Age, tenure, vacancy, income, rent and owner-estimated value come from the American Community Survey 2020-2024 five-year estimates for the postal-code area that includes DC Ranch. Shares are calculated from published counts, and owner-estimated value carries a margin of error.
Days on market, active and new listings, median listing price and price reduced counts are Realtor.com series published by the Federal Reserve Bank of St. Louis for the Phoenix-Mesa-Scottsdale metropolitan area. They describe the region and not the community. The brief makes no forecast and values no home.
Conclusion
The DC Ranch record shows a sale median of $1.8 million in one month and $2.5 million in the next, a listing median of $3.5 million, a price per foot up 24% on a price that fell, a wait of 55 to 72 days depending on the page and a community that overlaps with its richest village in the data.
It does not fix a price for any one home. The choice between a public listing and a private sale comes down to whether an owner would rather compete in that market or take privacy, a flexible closing date, no commission, no closing costs and no inspections or repairs. To see what a direct offer would look like for your home, use the contact form below or call 401-219-4207.
Frequently Asked Questions
What is the median home price in DC Ranch?
Redfin reported a median sale price of $1.8 million for February 2026, down 3.9%. A brokerage report quoting Redfin gave $2.5 million for March. Realtor.com reports a median listing price of $3.5 million.
How long do DC Ranch homes take to sell?
Realtor.com reports a median of 55 days, and Redfin reports 72 days for February 2026.
Is DC Ranch a buyer's or a seller's market?
Realtor.com calls it a seller's market, with a sale-to-list ratio of 97%. Redfin calls it somewhat competitive.
Why do the price figures differ so much?
Each source counts a different group of homes and a different month, and a small number of very large sales can move a median by a third in one month.
Does a private sale always beat a public listing?
No. A public listing can attract competing bids. A private sale offers privacy, a flexible closing date, no commission, no closing costs and no inspections or repairs.
Compare your options before committing. Request a written private offer for your property, with no obligation, then weigh it against your listing plan.
Sources
- Realtor.com, 2026. DC Ranch Neighborhood of Scottsdale, AZ Housing Market. https://www.realtor.com/local/market/arizona/scottsdale/dc-ranch.
- Redfin, 2026. DC Ranch, Scottsdale Housing Market. https://www.redfin.com/neighborhood/92162/AZ/Scottsdale/DC-Ranch/housing-market.
- Neighbors Luxury Real Estate, 2026. DC Ranch and Silverleaf Real Estate Market Trends in 2026. https://neighborsluxury.com/blog/dc-ranch-and-silverleaf-luxury-market-trends-for-buyers-and-sellers.
- U.S. Census Bureau, 2026. American Community Survey 2020-2024 five-year estimates, the DC Ranch area (via Census Reporter). https://censusreporter.org/profiles/86000US85255-85255/.
- Realtor.com, 2026. Housing Inventory: Median Days on Market in Phoenix-Mesa-Scottsdale, AZ (CBSA). https://fred.stlouisfed.org/series/MEDDAYONMAR38060.
- Realtor.com, 2026. Housing Inventory: Active Listing Count in Phoenix-Mesa-Scottsdale, AZ (CBSA). https://fred.stlouisfed.org/series/ACTLISCOU38060.
- Realtor.com, 2026. Housing Inventory: New Listing Count in Phoenix-Mesa-Scottsdale, AZ (CBSA). https://fred.stlouisfed.org/series/NEWLISCOU38060.
- Realtor.com, 2026. Housing Inventory: Median Listing Price in Phoenix-Mesa-Scottsdale, AZ (CBSA). https://fred.stlouisfed.org/series/MEDLISPRI38060.
- Realtor.com, 2026. Housing Inventory: Price Reduced Count in Phoenix-Mesa-Scottsdale, AZ (CBSA). https://fred.stlouisfed.org/series/PRIREDCOU38060.
Related research

Seller Guide · October 6, 2026
How to Prepare Point Pleasant Beach Rental Records Before Selling
Separate rental approval, income history and booked stays before comparing sale terms.

Seller Guide · October 6, 2026
How to Prepare Rumson Flood and Waterfront Records Before Selling
Separate flood disclosure, elevation, repairs and waterfront rights before comparing sale terms.

Seller Guide · October 6, 2026
How to Prepare Sarasota Condo Inspection and Reserve Records Before Selling
Separate building condition, reserve funding and resale documents before comparing sale terms.