Market Brief · by Aidan Sowa · October 5, 2026
Which Pinecrest West Median Sale Price Should an Owner Trust? Reading Redfin, Realtor.com and the Census Housing Costs Nearby
Reading Redfin, Realtor.com and the Census Housing Costs Nearby for Pinecrest West, FL, with each source dated and its limits noted, for owners weighing a listing against a direct sale.
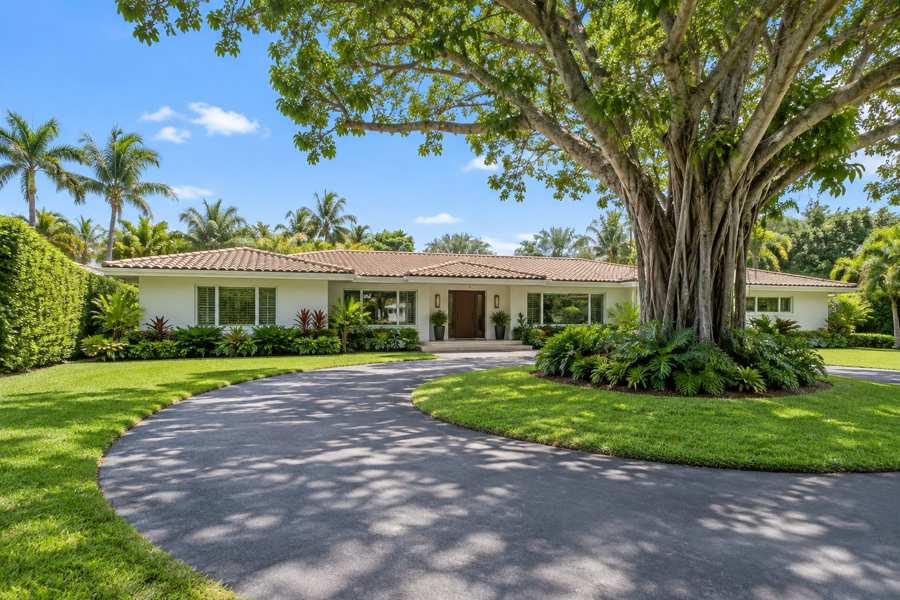
Is the Pinecrest West median $2,148,831 or $2,355,000? No market page for Pinecrest West itself was found, so this brief reads the pages for Pinecrest, the village the neighborhood is named for, and says so each time. Redfin's page for Pinecrest, for the three months ending June 2026, shows a median sale price of $2,148,831, down 0.054%. Realtor.com's page, with indicators as of August 2026, shows a median sold price of $2,355,000, down 24.64% in a year, beside a median listing price of $4,621,250, up 22.72%. The Realtor.com sold figure is 9.6% above the Redfin one, and its listing median is 96.2% above its own sold median, computed here.
The two drops show how a median can mislead. Redfin's fall of 0.054% is a rounding error, and Realtor.com's fall of 24.64% would imply a median of about $3,125,000 a year earlier, computed here. They cannot both describe the same sample. Realtor.com's page also calls the market cool, balanced and a buyer's market in different places. Redfin shows homes selling for 92.8% of list, and Realtor.com shows 95%. These are discounts of 5% to 7% on homes costing more than $2,000,000.
Maison Off-Market speaks only to sellers. The Census postal area that includes Pinecrest West, shared with a sibling post on Kendall, has 20,239 homes and 51,804 residents. This brief takes the bedroom, rent-burden and owner-cost cuts: 57.3% of homes have three or more bedrooms, 61.4% of renters whose burden is computed pay 30% or more of income in rent, and 35.5% of owners with a mortgage do the same. The last section sets out what a private sale changes for an owner.
Key Findings
- Redfin's page for Pinecrest, for the three months ending June 2026, showed a median sale price of $2,148,831, down 0.054%, $831 per square foot, up 9.9%, 60 homes sold, up 6.0%, 94 days on market against 115, a sale-to-list ratio of 92.8%, 1.7% of homes sold above list and 29.7% with price drops, down 15.1 points (Redfin, Pinecrest housing market).
- Realtor.com's page for Pinecrest, with indicators as of August 2026, showed a median listing price of $4,621,250, up 22.72%, a median sold price of $2,355,000, down 24.64%, $950 per square foot, 164 active listings, down 17.87%, a median of 95 days on market, 78 rental properties and a median rent of $3,900 a month, down 51.25% (Realtor.com, Pinecrest housing market).
- Zillow's page for Pinecrest, updated July 31, 2026, showed an average home value of $2,245,702, up 3.9% in a year, with homes going pending in around 52 days (Zillow, Pinecrest home values).
- Redfin's page for Miami-Dade County, for the three months ending May 2026, showed a median sale price of $568,000, up 0.05%, 86 days on market against 84, a sale-to-list ratio of 95.6%, 9.3% sold above list and 14.3% with price drops (Redfin, Miami-Dade County housing market).
- The Census postal area that includes Pinecrest West has 20,239 housing units, 57.3% with three or more bedrooms, 38.3% of occupied homes rented, a median household income of $86,354, a median rent of $1,774 and a median owner value of $638,900, plus or minus $37,164.
Why do the Pinecrest medians differ so much?
Start with what each figure measures. Redfin's $2,148,831 is a median sale price across all home types for three months, April to June 2026. Realtor.com's $2,355,000 is a sold median for August 2026, a later and shorter window. Zillow's $2,245,702 is an average of a model's values for all homes, whether or not they sold, updated at the end of July. The Realtor.com sold median is 4.9% above Zillow's value and 9.6% above Redfin's, and the Zillow value is 4.5% above Redfin's, computed here. Three pages for the same village give three prices within 10% of each other, which is a tight cluster for homes at this level.
The directions are the problem. Redfin shows a change of minus 0.054%, which implies about $2,150,000 a year earlier. Zillow shows plus 3.9%, which implies about $2,161,400 a year earlier. Realtor.com shows minus 24.64%, which implies about $3,125,000 a year earlier, and minus 6.73% over three years. If the Realtor.com figure were right, the other two pages would be seeing a different market. A median for a month with few sales jumps with the mix, and Redfin's count of 60 sales in three months, about 20 a month, is small. A drop of 24.64% in one month's median probably says that fewer of the largest homes closed that month, an inference.
The listing median is a different thing. Realtor.com's $4,621,250 is the asking price of homes now for sale, up 22.72% in a year, and it sits 96.2% above the sold median. At this price level the homes that list are often the largest and most expensive, and many do not sell at the first price. The page's table also shows a condominium row with a listing median of $349,000, so the village's inventory spans a range of more than 13 times, computed here. A single median cannot describe that range.
The page's table of postal areas adds a wider frame. It shows a median listing price of $564,750 for the postal area that includes Pinecrest West, against $2,998,500 for the highest area on the list, 5.3 times as much, and $1,093,750 for another. The Redfin county page shows $568,000 for Miami-Dade County, three months to May. So the Pinecrest West postal area sits near the county median, while the village that gives the neighborhood its name has a sold median about four times the county's. That is why a village figure cannot stand in for the neighborhood, and this brief treats it as context only.
Put together, the pages for Pinecrest show sold prices between $2,148,831 and $2,355,000, a Zillow value near $2,245,702 and asking prices near $4,621,250, none of which is a price for a home in Pinecrest West. The Census median owner value for the postal area that includes it is $638,900, plus or minus $37,164. A seller in the neighborhood should use the village pages for direction and a closed sale nearby for price.
| Source | Figure | What it measures |
|---|---|---|
| Redfin | $568,000, up 0.05% | Median sale price, Miami-Dade County, three months to May 2026 |
| Census Reporter | $638,900 | Median owner value, postal area including Pinecrest West |
| Redfin | $2,148,831, down 0.054% | Median sale price, Pinecrest, three months to June 2026 |
| Zillow | $2,245,702, up 3.9% | Average home value, Pinecrest, July 2026 |
| Realtor.com | $2,355,000, down 24.64% | Median sold price, Pinecrest, August 2026 |
| Realtor.com | $4,621,250, up 22.72% | Median listing price, Pinecrest, August 2026 |
Sources as cited. The dates, measures and areas differ and the figures are not directly comparable. Commercial content; not independently verified.
How long do Pinecrest homes take to sell, and how big are the discounts?
The clock is about three months. Redfin shows a median of 94 days on market, 21 days faster than the 115 a year earlier, and says the average Pinecrest home sells for about 6% below list and goes pending in around 84 days. Realtor.com shows 95 days, down 12.17% in a year but up 42.25% in three years. Zillow says homes go pending in around 52 days, and the county page shows 86 days against 84. Four pages give 52, 84, 94 and 95 days, and the definitions differ, so the safest summary is that a sold home took about three months.
The discounts are large. Redfin shows a sale-to-list ratio of 92.8%, down 0.3 points from about 93.1%, computed here, and Realtor.com says homes sold for 4.97% below the asking price in August 2026, a ratio of 95%. The county shows 95.6%. On a $2,148,831 sale, 92.8% of list implies an asking price near $2,315,600, computed here, a gap of about $166,700. That figure comes from a median ratio and does not describe any one sale, but it shows the scale of a 7% discount at this price.
Almost no homes sell above the ask. Redfin shows 1.7% of Pinecrest homes sold above list, down 5.3 points from about 7.0% a year earlier, computed here. The county shows 9.3%. So the village has fewer above-list sales than the county, which is consistent with prices that are high relative to what buyers will pay, though that is an inference. Price drops show the same thing: 29.7% of homes had price drops, down 15.1 points from about 44.8%, against 14.3% for the county.
The Realtor.com page contradicts itself on the market type. It calls the market cool in one place, balanced in another and a buyer's market in a third. Its own data are a median of 95 days, a ratio of 95% and active listings down 17.87% in a year but up 31.78% in three years. The labels come from different templates and a seller should ignore them and use the figures. The page also shows a median rent of $3,900, down 51.25% in a year, which implies about $8,000 a year earlier, a swing that suggests a handful of rentals, which is an inference.
What does a seller learn? A home that sold in Pinecrest in the period took about three months and went for 5% to 7% below its list price, and almost three in ten homes had cut the price. The cuts were less common than a year earlier, and sales rose slightly. Those are signs of a market where sellers and buyers are closer on price than they were. But a 5% to 7% discount on $2,000,000 is $100,000 to $140,000, and the pages say nothing about homes that did not sell.
What do per-foot prices and counts say about Pinecrest?
Prices per square foot rose. Redfin shows $831, up 9.9%, and Realtor.com shows $950, up 16.50%, 14.3% above the Redfin figure, computed here, though one is a sold measure and the other a listing measure. Prices per foot that rise while the median sale price is flat suggest that the homes that sold were smaller. That is an inference. The pages do not report sizes of the homes that sold.
Sales are few. Redfin counts 60 homes sold in the three months, up 6.0% from 57 a year earlier. A median of 60 sales is large enough to be useful but small enough that three or four very large sales can move it by a few percent. Realtor.com reports no count of sales. At 20 sales a month and 164 active listings, the village has about 8 months of listings at the sales pace, computed here, though the sale count is Redfin's and the listing count is Realtor.com's.
Inventory fell but is still high. Realtor.com shows 164 active listings, down 17.87% in a year and down 8.60% in a month, and 31.78% above three years ago. There are 78 rental listings, down 14.04%. Rents are $3,900 a month, which is 2.2 times the Census median rent of $1,774 for the postal area that includes Pinecrest West, computed here. The gap is large, and it reflects that the village is a higher-priced market than the postal area, which is an inference.
Zillow's average value of $2,245,702 is not a median and not a price. It is the average of a model's estimates and it includes homes that did not sell. A seller should know that an average is pulled up by the most expensive homes, so it is likely to sit above the median, though here it sits between the two sold medians. The Zillow page does not give a count of homes behind it.
What follows is that no one number describes a sale. A $2,148,831 median, a $2,355,000 median and a $4,621,250 listing median are all correct descriptions of different samples. A seller in Pinecrest West should treat them as bounds on the village and not as an estimate for the neighborhood.
What do bedrooms, rent burdens and owner costs say about the postal area?
The Census postal area that includes Pinecrest West has 20,239 housing units. Of them, 579 have no separate bedroom, 2.9%, 3,140 have one, 15.5%, 4,915 have two, 24.3%, 6,145 have three, 30.4%, 4,427 have four, 21.9%, and 1,033 have five or more, 5.1%. Homes with three or more bedrooms number 11,605, 57.3%, and homes with four or more 5,460, 27.0%, computed here. This is a family-sized stock, and the bedroom chart is its profile. The sibling post on Kendall takes the age, type and move-in cuts of the same area.
Owners and renters live in different homes. Of 11,727 owner-occupied homes, 9,404, 80.2%, have three or more bedrooms. Of 7,281 rented homes, 2,917 have one bedroom or none, 40.1%, and 1,423 have three or more, 19.5%. Renters rent smaller homes, and a third of the postal area's homes are in buildings of five or more units, a figure from the Kendall post. A seller of a house with four bedrooms is selling into the owner side of this market.
Renters carry heavy burdens. Of 7,281 renter households, the Census computes the share of income paid in rent for 6,880. Of those, 2,220 pay 50% or more, 32.3%, and 712 pay 40% to 49.9%, 10.3%, so 2,932, 42.6%, pay 40% or more, computed here. Those who pay 30% or more total 4,224, 61.4%. At the median rent of $1,774, or $21,288 a year, the median household income of $86,354 gives a rent share of 24.7%, so the burden is concentrated in lower-income renters, which is an inference.
Owners carry burdens too. Of 6,810 owners with a mortgage, the Census computes the share of income spent on owner costs for 6,780. Of those, 2,405 spend 30% or more, 35.5%, and 1,093 spend 50% or more, 16.1%. Of 4,917 owners without a mortgage, 895 of 4,889 spend 30% or more, 18.3%. Across all 11,669 owners with a computed share, 3,300 spend 30% or more, 28.3%, computed here. A little more than half of owners, 58.1%, have a mortgage.
These cuts matter for a seller because a heavy housing cost may be a reason to sell, though the Census cannot say who is selling or why. Owners without a mortgage, 41.9% of owners, hold their homes outright, and 43.3% of those spend less than 10% of income on owner costs. For those owners the question is not the mortgage but the tax, insurance and upkeep. The median owner value of $638,900 is 7.4 times the median income of $86,354, computed here. These figures describe a postal area, not the village, and not one street. Readers comparing markets can also read the Kendall brief and the Beach Park brief.
Source: Census Reporter, American Community Survey 2020-2024 five-year estimates, tables B25041, B25042, B25070, B25091, B25077, B25064 and B19013. Percentages and ratios are this brief's arithmetic.
What should an owner ask, and what does a private sale change?
The first question is which Pinecrest West. A four-bedroom house on a large lot, a townhouse and a condominium do not share a median, a buyer or a clock, and the village pages above are not pages for the neighborhood. A seller should ask for closed sales within a mile of the same size and type in the past twelve months, with the days to contract, the first ask and the final price, and for the number of listings that ended without a sale.
The second question is what a figure measures and when. Ask whether it is a sold median, a listing median or a model value, which months it covers and how many sales sit behind it. A seller who reads $4,621,250 as the price will aim at about twice the sold medians, and a seller who reads a one-month drop of 24.64% as the market may sell too soon. Redfin's three-month figures are steadier, and they show a flat market.
The third question is the cost of selling, and the arithmetic is simple. Each 1% of $2,148,831 is $21,488. At 3% the figure is $64,465 and at 5% it is $107,442. At $2,245,702, each 1% is $22,457, 3% is $67,371 and 5% is $112,285. At $2,355,000, each 1% is $23,550, 3% is $70,650 and 5% is $117,750. These illustrate the size of each percentage point and are not quotes of any rate a seller would be charged. No page in this brief names a Pinecrest commission rate, and the medians are not the price of any one home.
The fourth question is what a listing exposes. With a clock of about three months, a discount of 5% to 7% and nearly three in ten homes cutting the price, a public listing means a season of showings and a visible price history at a high price point. A private sale has no showings and no neighbors talking about a sale, which matters to an owner who values privacy in a village of large lots.
The benefits are plain. Maison Off-Market buys luxury homes and estates directly from their owners and speaks only to sellers. A private sale has no showings. It allows closing dates that give a seller time to find a new home. It has no commission costs and no closing costs, and it avoids inspection repairs. The company does not say that a private sale always beats a public listing, and in a market where one page shows $2,148,831 and another $2,355,000, an owner is right to ask what each route yields. If you would like a private, no-obligation offer for a Pinecrest West home, call 401-219-4207 or use the contact form on this site.
Methodology and limitations
Each page's date, title and place were read before use. No market page for Pinecrest West itself was found, so the pages cited are for the village of Pinecrest and for Miami-Dade County and are used as context only. Only established data publishers and the Census are cited. Realtor.com's page labels the market three different ways and its sold and listing medians move in opposite directions. The Census figures are five-year estimates for the postal area that includes Pinecrest West. Percent changes were taken as printed, and ratios, sums and year-earlier values are this brief's arithmetic.
Conclusion
The Pinecrest record shows sold medians of $2,148,831 and $2,355,000, a listing median of $4,621,250, homes selling 5% to 7% below list after about three months, and a nearby postal area where 61.4% of renters and 28.3% of owners spend 30% or more of income on housing. The useful number for an owner is a closed sale of a similar home nearby, not a village median.
Frequently Asked Questions
What is the median home price in Pinecrest West?
No page was found for the neighborhood itself. For the village of Pinecrest, Redfin shows a median sale price of $2,148,831 for the three months to June 2026, and Realtor.com shows a sold median of $2,355,000 and a listing median of $4,621,250 for August 2026.
How long do homes take to sell in Pinecrest?
Redfin shows 94 days on market and Realtor.com shows 95 days. Zillow says homes go pending in about 52 days.
Do sellers in Pinecrest negotiate?
Yes. Redfin shows homes selling for 92.8% of list and Realtor.com shows 95%, with 29.7% of homes having price drops.
What does the Census say about homes near Pinecrest West?
The postal area has 20,239 homes, 57.3% with three or more bedrooms, and 61.4% of renters with computed ratios pay 30% or more of income in rent.
Can I sell my Pinecrest West home privately?
Yes. Maison Off-Market buys luxury homes and estates directly from their owners with no showings, flexible closing dates, no commission costs, no closing costs and no inspections or repairs. Call 401-219-4207 or use the contact form.
Compare your options before committing. Request a written private offer for your property, with no obligation, then weigh it against your listing plan.
Sources
- Redfin, Pinecrest housing market, 2026. Pinecrest, FL Housing Market. https://www.redfin.com/city/14661/FL/Pinecrest/housing-market.
- Realtor.com, Pinecrest housing market, 2026. Pinecrest, FL Housing Market and Rental Trends. https://www.realtor.com/local/market/florida/miami-dade-county/pinecrest.
- Zillow, Pinecrest home values, 2026. Pinecrest, FL Housing Market: Home Prices and Trends. https://www.zillow.com/home-values/33429/pinecrest-fl/.
- Redfin, Miami-Dade County housing market, 2026. Miami-Dade County, FL Housing Market. https://www.redfin.com/county/479/FL/Miami-Dade-County/housing-market.
Related research

Seller Guide · October 6, 2026
How to Prepare Point Pleasant Beach Rental Records Before Selling
Separate rental approval, income history and booked stays before comparing sale terms.

Seller Guide · October 6, 2026
How to Prepare Rumson Flood and Waterfront Records Before Selling
Separate flood disclosure, elevation, repairs and waterfront rights before comparing sale terms.

Seller Guide · October 6, 2026
How to Prepare Sarasota Condo Inspection and Reserve Records Before Selling
Separate building condition, reserve funding and resale documents before comparing sale terms.