Market Brief · by Aidan Sowa · October 5, 2026
Which Kendall Median Is the Real One? Reading Sold Prices, Listing Prices and the Share of Older Homes
Reading Sold Prices, Listing Prices and the Share of Older Homes for Kendall, FL, with each source dated and its limits noted, for owners weighing a listing against a direct sale.
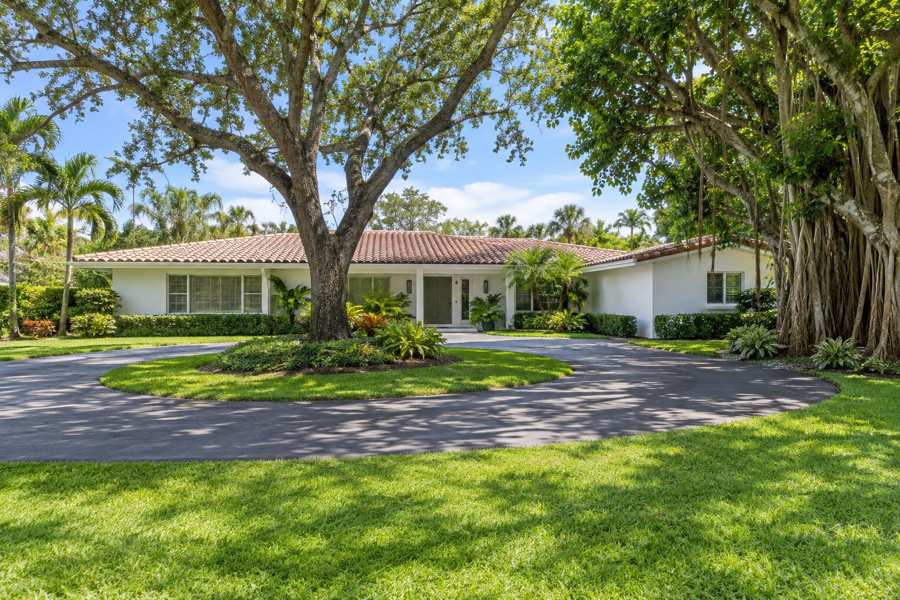
Is the Kendall median $584,868 or $415,000? It depends on whether a page counts homes that sold or homes that are listed. Redfin's page for the postal area, for the three months ending June 2026, shows a median sale price of $584,868, up 5.4%. Realtor.com's page for Kendall, with indicators as of September 2026, shows a median sold price of $585,000, up 25.81% in a year, beside a median listing price of $415,000, down 8.79%. The sold median is 41.0% above the listing median, computed here. A sold median can rise 25.81% while the listing median falls only if different homes sold and different homes were listed.
The pace and the discount are easier to read. Redfin shows 65 to 70 days on market, homes selling for 95.3% of list and 27.2% to 32.5% of homes with price drops. Realtor.com shows 86 days and homes selling 3.64% below the asking price. Kendall sellers negotiate, and the pages say so in different words. Sale counts are falling: 117 homes sold in June in the postal area, against 133 a year earlier.
Maison Off-Market speaks only to sellers. The Census postal area that includes Kendall has 20,239 homes, 60.2% built before 1980, 52.4% detached and 38.3% of occupied homes rented. This brief takes the year-built, housing-type and move-in cuts. A sibling post on Pinecrest West takes the bedroom and rent cuts of the same postal area. The last section sets out what a private sale changes for an owner.
Key Findings
- Redfin's page for the postal area that includes Kendall, for the three months ending June 2026, showed a median sale price of $584,868, up 5.4%, $465 per square foot, up 19.4%, 117 homes sold in June, down 11.9%, 65 days on market against 70, a sale-to-list ratio of 95.3%, 6.1% of homes sold above list and 27.2% with price drops, down 10.2 points (Redfin, Kendall postal area housing market).
- Redfin's page for Kendall as a city, for the same three months, showed a median sale price of $577,311, up 14.9%, $399 per square foot, up 11.8%, 181 homes sold, down 13.7%, 70 days on market against 72, a sale-to-list ratio of 95.3%, 3.4% sold above list and 32.5% with price drops, down 3.2 points (Redfin, Kendall housing market).
- Realtor.com's page for Kendall, with indicators as of September 2026, showed a median listing price of $415,000, down 8.79%, a median sold price of $585,000, up 25.81%, $364 per square foot, 383 active listings, down 10.57%, a median of 86 days on market, 440 rental properties and a median rent of $2,400 a month (Realtor.com, Kendall housing market).
- Redfin's page for Miami-Dade County, for the three months ending May 2026, showed a median sale price of $568,000, up 0.05%, $389 per square foot, 2,143 homes sold in May, 86 days on market against 84, a sale-to-list ratio of 95.6%, 9.3% sold above list and 14.3% with price drops (Redfin, Miami-Dade County housing market).
- The Census postal area that includes Kendall has 20,239 housing units, 60.2% built before 1980, a median year built of 1977, 52.4% detached, 38.3% of occupied homes rented, a median household income of $86,354, a median rent of $1,774 and a median owner value of $638,900, plus or minus $37,164.
Why do the Kendall medians differ so much?
Start with what each figure measures. Redfin's $584,868 is a median sale price across all home types in the postal area for three months, and its $577,311 is the same measure for the city. The two are 1.3% apart, computed here, which is close. Realtor.com's $585,000 is a sold median for the city as of September 2026, a later month. All three agree within 1.4%, and all three describe homes that closed. The odd one out is the listing median of $415,000, which describes asking prices today and is 28.1% below the Redfin city sold median, computed here.
A listing median can sit below a sold median when the homes for sale are smaller or cheaper than the homes that sold. That is an inference, and the page does not break out sizes. Realtor.com's own table of neighborhoods and complexes shows listing medians from $254,450 to $439,000, a spread of 1.7 times, across six rows of neighborhoods and complexes. A market with many small, older units listed and a few large homes sold produces exactly this gap. It also means that a seller of a detached home should not read $415,000 as a guide.
Realtor.com's month-to-month figure shows how thin a monthly median is. Its sold median of $585,000 is 25.14% lower than the month before, which implies about $781,500 in the prior month, computed here, and 25.81% higher than a year earlier, which implies about $465,000. A price that swings by a quarter in a month while the quarterly Redfin figure moves 5.4% to 14.9% in a year reflects the mix of sales, not a change in what homes are worth.
The geography widens the picture. Realtor.com's table of postal areas on the same page shows a median listing price of $550,000 for the postal area that includes Kendall, 32.5% above the city's $415,000, against $2,550,000 for the highest area on the list, 4.6 times as much. Redfin's county page shows $568,000 for Miami-Dade County, three months to May, so the Kendall postal area's median is 3.0% above the county's, though the months differ. Kendall sits near the county middle, and the neighborhoods around it do not.
The Census median owner value of $638,900, plus or minus $37,164, is 9.2% above the Redfin postal area figure, computed here. It is owners' own estimates averaged over 2020 to 2024, and it sits above a sold median, which suggests that owners value their homes more than buyers have paid, an inference. The practical reading is that sold medians of $577,311 to $585,000 are the better guide, that $415,000 is a different population and that no median is the price of any one home.
| Source | Figure | What it measures |
|---|---|---|
| Realtor.com | $415,000, down 8.79% | Median listing price, city, September 2026 |
| Redfin | $568,000, up 0.05% | Median sale price, Miami-Dade County, three months to May 2026 |
| Redfin | $577,311, up 14.9% | Median sale price, city, three months to June 2026 |
| Redfin | $584,868, up 5.4% | Median sale price, postal area, three months to June 2026 |
| Realtor.com | $585,000, up 25.81% | Median sold price, city, September 2026 |
| Census Reporter | $638,900 | Median owner value, postal area, five-year estimate |
Sources as cited. The dates, measures and areas differ and the figures are not directly comparable. Commercial content; not independently verified.
How long do Kendall homes take to sell, and do sellers negotiate?
The clock is two to three months. Redfin shows a median of 65 days for the postal area, 5 days faster than a year earlier, and 70 days for the city, 2 days faster. Realtor.com shows 86 days, up 7.50% in a year and up 11.69% in a month, and Redfin's county page shows 86 days against 84. The two Redfin pages and Realtor.com measure different areas and months, and Realtor.com's figure is a median of listings, which may be why it is longer. Together they say that a Kendall home that sold took 65 to 86 days.
Sellers gave ground. Redfin shows a sale-to-list ratio of 95.3% for both the postal area and the city, down 0.31 and 0.017 points, so about 95.6% for the postal area a year earlier, computed here. Realtor.com says homes sold for 3.64% below the asking price in September, a ratio of 96%, and the county page shows 95.6%. Redfin says the average Kendall home sells for about 4% below list and goes pending in around 67 days, and that some homes get multiple offers. At 95.3% of list, a home that sold for $584,868 would have listed near $613,700, computed here, though the ratio is a median of ratios and not the gap on any one sale.
Few homes sell above the ask. Redfin shows 6.1% of postal area homes sold above list, down 1.4 points from about 7.5%, and 3.4% of city homes, down 1.8 points from about 5.2%, computed here. The county page shows 9.3%. Kendall is below the county on that measure, which is consistent with a market of older homes where buyers expect a discount, though that is an inference.
Price drops moved the other way for the postal area. Redfin shows 27.2% of homes with price drops, down 10.2 points from about 37.4% a year earlier, and 32.5% for the city, down 3.2 points from about 35.7%. The county page shows 14.3%, down 3.2 points. Kendall's rate is roughly double the county's. So a majority of homes do not cut, but roughly three in ten do, and the share is falling. A seller reading these figures sees a market that is slowly improving, though it is still slower than the county's.
What does a seller learn? A typical home that sold took two to three months and closed about 4% below the ask, and nearly a third cut the price first. The pages do not show how many listings never sold, and the figures describe the homes that did. A seller who needs a date should plan for the long end of 65 to 86 days and for a discount, and ask how a private route compares.
What do per-foot prices, counts and listings say about Kendall?
Prices per square foot disagree in direction. Redfin shows $465 for the postal area, up 19.4%, and $399 for the city, up 11.8%. Realtor.com shows $364, down 3.20%, and the county page shows $389, down 1.3%. The Redfin postal area figure is 16.5% above its city figure, computed here, and 27.7% above Realtor.com's, though one is sold prices and the other is a listing measure. A median price that rises 5.4% while the price per foot rises 19.4% suggests that the homes that sold were smaller, which is an inference.
Sales counts are falling. Redfin shows 117 homes sold in June in the postal area, down 11.9% from 133, and 181 in the city, down 13.7% from 210. The county page shows 2,143 homes sold in May, down 2.0% from 2,186, so Kendall's decline is steeper than the county's. Fewer sales mean that each median rests on a smaller sample. A month of 117 sales is large enough to be useful, but a median built on a handful of sales for a street or a complex is not.
Supply is falling too. Realtor.com shows 383 active listings, down 10.57% in a year and down 6.94% in a month, and 440 rental properties, up 6.14%. There are more rentals listed than homes for sale, a ratio of 1.15 rentals to each home for sale, computed here. The median rent is $2,400 a month, down 4% in a month and in a year, against a Census median rent of $1,774 for tenants in place. The difference suggests that asking rents exceed what current tenants pay, though listed rentals may differ in size.
The pages give a sense of the range inside Kendall. Twelve neighborhood and complex rows on the Realtor.com page show rents from $1,950 to $3,500 a month, and six of them show listing medians from $254,450 to $439,000. One row shows 26 homes for sale, up 177.78% in a year, and another shows 17, down 38.89%. Those are small counts that swing by large percentages, and they show that the city's median hides a market of many small segments. The pages do not give sold prices by segment.
Put together, the picture is a market where prices rose, sales fell, listings fell and sellers still gave about 4% off. That is not a simple seller's market or buyer's market. It is a market where the home's type and condition decide the outcome, which is why the age figures in the next section matter. A seller of a 1970s home and a seller of a 2010s home are not in the same market, and the medians above do not separate them.
What does the Census say about age, housing types and owners?
The Census postal area that includes Kendall has 20,239 housing units and 51,804 residents. The median year built is 1977, and 12,187 homes, 60.2%, were built before 1980. The year-built chart shows the peak: 7,413 homes, 36.6%, date from the 1970s and 4,521, 22.3%, from the 1980s, so 11,934 homes, 59.0% of the total, date from 1970 to 1989, computed here. Only 1,429 homes, 7.1%, were built since 2000. This is an older suburb, and many of its homes are now 35 to 55 years old.
Housing types are mixed. Detached homes number 10,604, 52.4%, and attached homes 1,785, 8.8%. Buildings of two to four units hold 673 homes, 3.3%, and buildings of five or more hold 7,061, 34.9%, of which 2,446, 12.1% of all homes, are in buildings of 50 or more units. Mobile homes number 116. Those add to 20,239. Roughly half of the homes are houses and a third are in apartment buildings or condominiums, which is why one median covers homes of very different values.
Renters are a large group. Owners are 11,727 of 19,008 occupied homes, 61.7%, and renters 7,281, 38.3%. Of the owner households, 5,080 moved in during 2010 or later, 43.3%, and 4,043 moved in before 2000, 34.5%. Among renters, 2,516 moved in during 2020 or later, 34.6%, and 6,659, 91.5%, in 2010 or later. Owners are settled, and a third of them have been in place for more than a quarter century. The pages do not say how many of the owners rent their homes out.
Incomes and values are middle. The median household income is $86,354, and the median owner value is $638,900, plus or minus $37,164, which is 7.40 times the median income, computed here. The Redfin postal area median is 6.8 times that income. The median rent is $1,774 a month, $21,288 a year, 24.7% of the median income, computed here, though renters' incomes differ from all households' incomes. These ratios show how far prices sit above local incomes.
Vacancy is low, 1,231 homes, 6.1%. Of them, 249 are for rent, 151 for sale, 189 are sold but not yet occupied, 224 are seasonal or occasional and 418 are vacant for other reasons. Residents average 2.73 per occupied home. These cuts describe a postal area and not one street, and the Census cannot say how many older homes have been updated. A sibling post on Pinecrest West takes the bedroom and rent cuts of the same area. Readers comparing markets can also read the Miramar Beach brief and the Pinecrest West brief.
Source: Census Reporter, American Community Survey 2020-2024 five-year estimates, tables B25024, B25034, B25038, B25004, B25077, B25064 and B19013. Percentages and ratios are this brief's arithmetic.
What should an owner ask, and what does a private sale change?
The first question is which Kendall. A 1970s ranch house, a townhouse and a condominium in a larger building do not share a median, a buyer or a clock. A seller should ask for closed sales of homes of the same type, age and size within a mile in the past twelve months, with the days to contract, the first ask and the final price, and for the number of listings that ended without a sale.
The second question is what a figure measures and when. Ask whether it is a sold median, a listing median or a model value, which months it covers and how many sales sit behind it. A seller who reads $415,000 as the price will undersell by about 28% against Redfin's city sold median, and a seller who reads a one-month Realtor.com median of $585,000 as a trend may overshoot. The Redfin pages, which cover three months, are steadier.
The third question is the cost of selling, and the arithmetic is simple. Each 1% of $577,311 is $5,773. At 3% the figure is $17,319 and at 5% it is $28,866. At $584,868, each 1% is $5,849, 3% is $17,546 and 5% is $29,243. At $638,900, each 1% is $6,389, 3% is $19,167 and 5% is $31,945. These illustrate the size of each percentage point and are not quotes of any rate a seller would be charged. No page in this brief names a Kendall commission rate, and the medians are not the price of any one home.
The fourth question is what a listing exposes. With a clock of 65 to 86 days and about three in ten homes cutting the price, a public listing means weeks of showings and a visible price history, and a buyer's side will ask for inspections and repairs. In a postal area where 60.2% of homes were built before 1980 and the median year built is 1977, that request is reasonable. A private sale has no showings and no neighbors talking about a sale, and it avoids inspection repairs.
The benefits are plain. Maison Off-Market buys luxury homes and estates directly from their owners and speaks only to sellers. A private sale has no showings. It allows closing dates that give a seller time to find a new home. It has no commission costs and no closing costs, and it avoids inspection repairs. The company does not say that a private sale always beats a public listing, and in a market where one page shows $415,000 and another $585,000, an owner is right to ask what each route yields. If you would like a private, no-obligation offer for a Kendall home, call 401-219-4207 or use the contact form on this site.
Methodology and limitations
Each page's date, title and place were read before use. Only established data publishers and the Census are cited. The Redfin pages cover three months and different areas, the county page ends in May, and the Realtor.com figures are for September 2026 and for the city. A Zillow page for Kendall returned a different place and was discarded. The Census figures are five-year estimates for a postal area. Percent changes were taken as printed, and ratios, sums and year-earlier values are this brief's arithmetic.
Conclusion
The Kendall record shows sold medians of $577,311 to $585,000, a listing median of $415,000, homes selling about 4% below list after 65 to 86 days, and a postal area where 60.2% of homes were built before 1980. The useful number for an owner is a closed sale of a similar home nearby, not a city median.
Frequently Asked Questions
What is the median home price in Kendall?
Redfin shows a median sale price of $584,868 for the postal area and $577,311 for the city, for the three months to June 2026. Realtor.com shows a sold median of $585,000 and a listing median of $415,000 for September 2026.
How long do homes take to sell in Kendall?
Redfin shows 65 days for the postal area and 70 days for the city, and Realtor.com shows 86 days for listings.
Do sellers in Kendall negotiate?
Yes. Redfin shows homes selling for 95.3% of list, and Realtor.com shows 3.64% below the asking price. Between 27.2% and 32.5% of homes had price drops.
What does the Census say about homes in Kendall?
The postal area has 20,239 homes, 60.2% built before 1980, 52.4% detached, 38.3% of occupied homes rented and a median owner value of $638,900.
Can I sell my Kendall home privately?
Yes. Maison Off-Market buys luxury homes and estates directly from their owners with no showings, flexible closing dates, no commission costs, no closing costs and no inspections or repairs. Call 401-219-4207 or use the contact form.
Compare your options before committing. Request a written private offer for your property, with no obligation, then weigh it against your listing plan.
Sources
- Redfin, Kendall postal area housing market, 2026. Housing Market: House Prices and Trends. https://www.redfin.com/zipcode/33176/housing-market.
- Redfin, Kendall housing market, 2026. Kendall, FL Housing Market. https://www.redfin.com/city/23443/FL/Kendall/housing-market.
- Realtor.com, Kendall housing market, 2026. Kendall, FL Housing Market and Rental Trends. https://www.realtor.com/local/market/florida/miami-dade-county/kendall.
- Redfin, Miami-Dade County housing market, 2026. Miami-Dade County, FL Housing Market. https://www.redfin.com/county/479/FL/Miami-Dade-County/housing-market.
Related research

Seller Guide · October 6, 2026
How to Prepare Point Pleasant Beach Rental Records Before Selling
Separate rental approval, income history and booked stays before comparing sale terms.

Seller Guide · October 6, 2026
How to Prepare Rumson Flood and Waterfront Records Before Selling
Separate flood disclosure, elevation, repairs and waterfront rights before comparing sale terms.

Seller Guide · October 6, 2026
How to Prepare Sarasota Condo Inspection and Reserve Records Before Selling
Separate building condition, reserve funding and resale documents before comparing sale terms.