Market Brief · by Aidan Sowa · October 5, 2026
Which Pelican Bay Is Yours, the Villa That Rose or the Condo That Fell? Reading Home Types and Days on Market
Reading Home Types and Days on Market for Pelican Bay, FL, with each source dated and its limits noted, for owners weighing a listing against a direct sale.
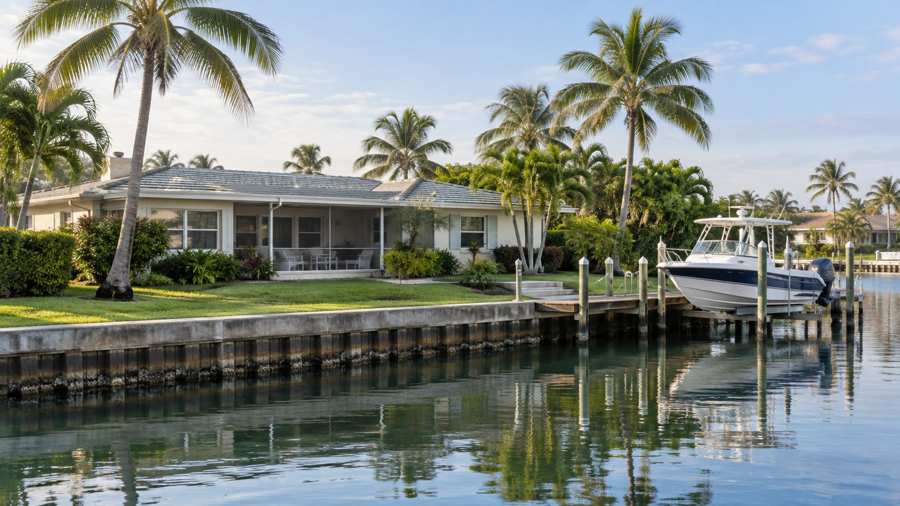
Which Pelican Bay is yours, the villa that rose 29.9 percent or the condo that fell 12.4? Both are true in the same community, in the same five months. A Naples brokerage that analyzed January to May 2026 reports that the median price of a villa sale rose from $1,712,500 to $2,225,000, while the median for low and mid-rise condos fell from $1,012,500 to $886,829. Single-family homes were nearly flat at $3,400,000, and high-rise condos rose 2.2% to $2,350,000. Total sales were 174 in both years.
The community-wide numbers hide this. Redfin shows a median sale price of $1,141,744 for the three months to August, down 20.7%, and a sale-to-list ratio of 93.6%. Realtor.com shows a median sold price of $903,750 for the postal area, down 25%, and a median of 129 days on market. A Naples brokerage's July report counted 28 closings with a median near $1,144,000. A seller who asks how Pelican Bay is doing gets a different answer for each home type.
The Census adds a fact that few market pages mention: 45% of the homes in the postal area are vacant at the survey date. This brief sets the sources side by side, shows where they conflict, adds the Census and a Naples area series, and explains plainly what a private sale changes and what it does not. It does not estimate what any particular home is worth.
Key Findings
- A Naples brokerage report on January to May 2026 gave median sold prices for 2026 against 2025 of $2,350,000 against $2,300,000 for high-rise condos, $886,829 against $1,012,500 for low and mid-rise condos, $2,225,000 against $1,712,500 for villas and $3,400,000 against $3,362,500 for single-family homes. It says its data include off-market sales that were later added to the MLS (Lorch, Pelican Bay peak season analysis).
- Its average days on market rose from 96 to 137 for high-rise condos, from 69 to 160 for low and mid-rise condos and from 85 to 230 for single-family homes, and fell from 83 to 69 for villas.
- Redfin reported a median sale price of $1,141,744 for the three months to August 2026 (down 20.7%), $578 per square foot (down 27.1%), 76 homes sold in August (up 28.6% from 59), a median of 101 days on market against 120, a sale-to-list ratio of 93.6% and 1.4% of homes sold above list (Redfin, Pelican Bay housing market).
- Realtor.com's page for the postal area, with indicators as of September 2026, showed a median listing price of $1,286,250 (down 2.30%), a median sold price of $903,750 (down 25%), 382 homes for sale (down 25.75%), a median of 129 days on market and a sale-to-list ratio of 94%, and called it a buyer's market (Realtor.com, postal area market data).
- A July 2026 report counted 28 closed sales with about $57.7 million in volume and a median near $1,144,000, and 116 active listings in late July (Kinkead, Pelican Bay market report for July 2026).
- A mid-year 2026 report said that the community's single-family sales in the first half ranged from $1.4 million to more than $12 million, that its villa sales ranged from $1.2 million to $5.5 million, and that its sale-to-original-list ratio fell back under 90% in the second quarter (Oliver, Pelican Bay mid-year 2026 report).
Why do villas rise while low and mid-rise condos fall?
The brokerage's peak season analysis is the clearest split. Between the first five months of 2025 and 2026, villas sold 24 times against 21, and their median price rose 29.9% while average days on market fell from 83 to 69. Low and mid-rise condos sold 58 times against 56, with the median down 12.4% and average days up from 69 to 160. High-rise condos sold 73 times in both years, with the median up 2.2% and the average down 15.8%. Single-family homes sold 19 times against 24, with the median up 1.1% and the average down 14.3%.
The brokerage's explanation is that buyers consider condos first and switch to villas when they want ground-floor outdoor space, a private garage entrance and more flexible pet rules, and that villa inventory is small. That is the author's commentary and is not tested here. The totals add to 174 sales in each year, so the market did not slow in volume. It changed in mix. Condos made up 131 of the 174 sales in 2026, which is 75.3%, and villas and single-family homes made up 43, or 24.7%.
The averages explain why medians and averages disagree. The high-rise average fell 15.8% while its median rose 2.2%, and the single-family average fell 14.3% while its median rose 1.1%. The brokerage says there were fewer ultra-luxury sales at the top in 2026, which pulls an average down without changing the typical price. The highest single-family sale fell from $15,000,000 to $12,125,000. The median is the figure to watch, and for a seller the best guide is the median of one's own type.
The same page names where the activity sat. In low and mid-rise condos, one building led the count with an even dozen sales, and the highest sale in that group was $1,900,000. In single-family homes, the four highest sales were all in one neighborhood and ranged from $6,200,000 to $12,125,000. A community report that blends these groups says little about a particular building or street, and an owner's best comparison is the recent sales in the same building or neighborhood and of the same type. A year of data is not a trend. Villas are a small group of 21 and 24 sales, and a few large sales can move the median by hundreds of thousands of dollars. The page says so itself in a question: it asks whether the villa trend will continue. This brief treats that as an open question.
| Home type | 2025 median | 2026 median | Sales, 2025 and 2026 |
|---|---|---|---|
| High-rise condos | $2,300,000 | $2,350,000 (up 2.2%) | 73 and 73 |
| Low and mid-rise condos | $1,012,500 | $886,829 (down 12.4%) | 56 and 58 |
| Villas | $1,712,500 | $2,225,000 (up 29.9%) | 21 and 24 |
| Single-family homes | $3,362,500 | $3,400,000 (up 1.1%) | 24 and 19 |
Source: a Naples brokerage report as cited. The totals of 174, the 131, the 75.3%, the 43 and the 24.7% are this brief's arithmetic from stated figures. The explanation of buyer behavior is the brokerage's commentary and has not been checked. Commercial content; not independently verified.
Why does the community-wide median sale fall between $903,750 and $1,141,744?
Redfin's median of $1,141,744 for the three months to August is down 20.7% from a year earlier, which puts last year's figure at about $1.44 million. Its price per square foot of $578 is down 27.1%. The July report's median of about $1,144,000 on 28 closings is within 0.2% of Redfin's, an agreement between two sources that count differently. Realtor.com's $903,750 is 20.8% below Redfin's, and its year-on-year fall of 25% is larger.
The likeliest cause is geography. The Realtor.com page is for a postal area that includes Pelican Bay and also its neighbors, with more modest homes, and its table lists named subdivisions such as Pebble Creek and Avalon that are condominium communities. The July report counted 116 active listings for Pelican Bay itself, which is 30% of the 382 that Realtor.com shows for the postal area. That reading is this brief's inference. The pages do not state their boundaries.
The fall in the median is also a fall in mix. The July report says Pelican Bay has about 5,550 condos and about 717 single-family homes, a ratio of 7.7 to 1, and that July's closings split three to one between condos and single-family homes and villas. If a month has a few more condo closings, the median falls without any house losing value. A drop of 20% in a median does not mean a typical owner lost 20%.
Redfin's sale-to-list ratio of 93.6% is up 1.8 points on the year, so a year ago it was about 91.8%. Only 1.4% of homes sold above list, and 16.4% had price drops, down 2.1 points. Prices are lower than a year ago, but the discount to list has narrowed. That fits the idea that sellers have become more realistic. The mid-year report agrees in part. It says the ratio to the original list price recovered from 2025 lows and then dropped back under 90% in the second quarter. The measures differ, and the latest data are mixed.
Source: Redfin, Realtor.com, a Naples brokerage and a mid-year report as cited. The implied last-year median of about $1.44 million, the 20.8%, the 0.2%, the 30%, the ratio of 7.7 to 1 and the implied last-year ratio of about 91.8% are this brief's arithmetic. The explanations are this brief's inferences. Commercial content; not independently verified.
Do the days on market agree, from 69 to 230?
They do not, and the spread says more than any one figure. The brokerage's averages for January to May were 137 days for high-rise condos, 160 for low and mid-rise condos, 69 for villas and 230 for single-family homes. Last year the single-family average was 85, so it rose by 170.6%, and low and mid-rise condos rose by 131.9%. The July report puts the community-wide average between 130 and 151 days. Realtor.com's postal-area median is 129 days, down 8.90% on the year. Redfin's median is 101 days, against 120.
Those are averages and medians, and an average of a few very slow sales runs well above a median. The brokerage's 230 days for single-family homes is an average of 19 sales, and a handful of homes that sat for a year would produce it. Redfin's own page says that the average home sells for about 7% below list and goes pending in around 104 days, while the hottest homes sell for about 2% below list and go pending in about 27 days.
So a house priced to the market in Pelican Bay can sell in under a month, and one that is not can sit for most of a year. The sources agree that homes are slower than a year ago, with the exception of villas. The Naples area series shows the same direction: the regional median days on market was 87 in April and 106 in August, up 21.8%.
The season matters here. The brokerage notes that many winter contracts do not close until April or May, which can make a report for January to May look different from one for a single month. It also says that snowbirds browse in January and February and buy near the end of the season, in March. A seller who lists in summer meets few of them. That advice is the brokerage's and is commentary.
Source: a Naples brokerage, Realtor.com, Redfin and the Federal Reserve Bank of St. Louis as cited. The 170.6%, the 131.9% and the 21.8% are quoted from the brokerage's table or are this brief's arithmetic. The remarks on averages are this brief's inference. Commercial content; not independently verified.
What does the Census say, and why are 45 percent of the homes vacant?
The American Community Survey profile for the postal area counts 16,237 people and 15,215 housing units (Census Reporter, Pelican Bay area profile). Only 8,365 homes are occupied, and 6,850 are vacant, which is 45.0%. Of the occupied homes, 7,197 are owner-occupied, which is 86.0%, and 1,168 are rented. The median age is 67.7. Households average 1.9 people. The median household income is $119,212, with a margin of error of $17,738, and per capita income is $113,220. Of adults, 60.4% have a bachelor's degree or higher.
The survey does not say why homes are vacant, and the profile does not break it down. In a winter-resident community, the usual reason is that owners live elsewhere for part of the year and the home counts as vacant on the date of the survey. This brief infers that this is the case here, and it fits the median age and the Realtor.com rental median of $10,000 a month, which is a seasonal price. It is an inference, not a finding.
The housing is from the 1980s and 1990s. The median year built is 1990, and 5,447 units were built in the 1980s, which is 35.8%, and 5,319 in the 1990s, which is 35.0%. Together that is 70.8%. Only 2,376 units, or 15.6%, were built before 1980. Since 2010, 756 have been built, or 5.0%. A community built mostly in two decades has buildings of the same age that face the same repairs together, and that shows up in sales of condos in buildings that have been renovated against those that have not. The July report says that renovated units are expected to command a premium, which is the author's commentary.
The Census median value is $1,022,000, with a margin of error of $79,470, or 7.8%. Redfin's $1,141,744 is 11.7% above it, and Realtor.com's $903,750 is 11.6% below it. The survey covers owner-estimated values of every owner-occupied home in the postal area, over five years, so it falls between the two. It is a useful reminder that what owners think their homes are worth, what the survey recorded and what buyers paid are different numbers.
Source: U.S. Census Bureau, American Community Survey 2020-2024, Redfin, Realtor.com and a Naples brokerage as cited. Shares, sums and gaps are this brief's arithmetic. The explanation of vacancy is this brief's inference. The postal area is larger than Pelican Bay.
What do the Naples area series add?
The Naples area series is produced by one source. Active listings fell from 6,869 in April to 4,676 in August, a drop of 31.9% (Realtor.com, active listings). The median days on market rose from 87 to 106 over the same months (Realtor.com, days on market). Price reductions fell from 1,388 in May to 810 in September, a drop of 41.6% (Realtor.com, price reductions).
The regional median listing price eased from $699,999 in April to $685,000 in August, a fall of 2.1%. The postal area's median listing price of $1,286,250 is 1.9 times the regional August figure. The part of Naples that the series covers includes less expensive inland neighborhoods and condos, which is why the figure is far lower.
A region with fewer listings, longer waits and fewer price cuts is one where owners have stopped listing as many homes and the ones that remain sit. That is consistent with Realtor.com's 25.75% fall in homes for sale in the postal area, and with buyers who wait. The series do not give Pelican Bay figures, and the comparison is this brief's reasoning. Readers comparing markets can also read the Bird Key brief and the Vanderbilt Beach brief.
Source: Realtor.com series published by the Federal Reserve Bank of St. Louis as cited. The 31.9%, 41.6%, 2.1% and 1.9 times are this brief's arithmetic. The series name was checked against the series page. The comparison is this brief's reasoning.
What should an owner ask, and what does a private sale change?
Start with the type of home, because the type decides the market. A villa owner and a low-rise condo owner are in markets that moved in opposite directions this year. Then ask the source how many sales sit behind its median, which months it covers and whether it includes off-market sales. The brokerage's peak season analysis says it includes sold entries that were off-market sales later added to the MLS, which is a reminder that some sales never appear in a listing count.
Before any sale, an owner should also learn what the building or association requires. Condo and villa sales in a community like this one usually involve an association, and its rules, fees and approval steps can affect timing and a buyer's decision. This brief has not reviewed any association's documents, and none of the sources above describe them, so treat this as a question to ask, not a finding. A private buyer still has to satisfy the same association rules, but there is no public marketing period, no open house traffic and no buyer's inspection demand to schedule around.
The fee arithmetic is simple. At the Redfin median of $1,141,744, each 1% is about $11,417, so 3% is about $34,252 and 5% is about $57,087. At the high-rise median of $2,350,000, 1% is $23,500, 3% is $70,500 and 5% is $117,500. These show what each percentage point is worth. They are not a prediction of what any seller would pay.
A public sale with an average of 100 or more days on market means a long period of showings, a house that must stay ready for visitors, and a buyer's inspection at the end. A private sale with Maison Off-Market changes that. There are no showings and no neighbors talking about you selling. The closing date can be flexible, so there is time to find a new home. There are no commission costs, no closing costs, and no inspections or repairs. This brief does not claim that a private sale always yields more than a public one.
If you would like a private, no-obligation offer for a Pelican Bay home, call 401-219-4207 or use the contact form on this site.
Source: a Naples brokerage, Maison Off-Market and the sources above as cited. The fee figures are this brief's arithmetic and not claims about any sale.
Methodology and limitations
Medians and averages by home type, days on market and sale counts come from a Naples brokerage's analysis of January to May 2026. Sale prices, homes sold, days on market and the sale-to-list ratio come from Redfin's page for the three months to August 2026. Postal-area prices, counts and neighborhood rows come from Realtor.com with indicators as of September 2026. Monthly closings and active listings come from a July 2026 report, and the mid-year remarks come from a report dated July 25, 2026. The sources cover different periods and areas and are not independent.
Census figures come from the American Community Survey 2020-2024 five-year estimates for the postal area, through Census Reporter. Regional series are Realtor.com data published by the Federal Reserve Bank of St. Louis for the Naples area, and the series name was checked on the series page. Percentages, gaps, ratios and fee amounts are this brief's own arithmetic and are labeled as such. Where a reading goes beyond what a page says, it is called an inference. Commercial pages are not independently verified.
Conclusion
The Pelican Bay record shows villas up 29.9% and low and mid-rise condos down 12.4% in the same five months, a community median sale between $903,750 and $1,141,744 depending on the source, days on market from 69 to 230 by home type, and a postal area in which 45% of homes are vacant. It describes several markets under one name.
It does not fix a price for any one home. The choice between a public listing and a private sale comes down to whether an owner would rather meet showings, inspections and a long public clock, or sell quietly on a date that suits them. Maison Off-Market speaks only to sellers, and a conversation costs nothing.
Frequently Asked Questions
What is the median home price in Pelican Bay?
It depends on the source and the home type. Redfin reports $1,141,744 for the three months to August 2026. Realtor.com reports a median sold price of $903,750 for the postal area. A Naples brokerage reports medians from $886,829 for low and mid-rise condos to $3,400,000 for single-family homes.
How long do Pelican Bay homes take to sell?
Redfin reports a median of 101 days and Realtor.com reports 129 days. A Naples brokerage reports averages from 69 days for villas to 230 for single-family homes for January to May 2026.
Are Pelican Bay prices falling?
It depends on the home type. A brokerage reports villa medians up 29.9% and low and mid-rise condo medians down 12.4%. Redfin reports a median sale price down 20.7% on the year.
Why are so many homes vacant?
The Census reports that 45.0% of homes in the postal area that includes Pelican Bay are vacant. The survey does not explain why. This brief infers that many are winter homes, but that is not a finding.
What is the difference between a private sale and a public listing?
A private sale with Maison Off-Market has no showings, a flexible closing date, no commission costs, no closing costs and no inspections or repairs. A public listing exposes the home to a wider group of buyers. This brief does not claim either always gets a higher price.
Compare your options before committing. Request a written private offer for your property, with no obligation, then weigh it against your listing plan.
Sources
- Lorch, S., 2026. Pelican Bay 2026 Peak Season Analysis. https://www.naplesarearealestate.com/blog/pelican-bay-2026-peak-season-analysis/.
- Redfin, 2026. Pelican Bay Housing Market Trends. https://www.redfin.com/city/24885/FL/Pelican-Bay/housing-market.
- Realtor.com, 2026. Postal Area Housing Market Data, Naples, FL. https://www.realtor.com/local/market/florida/zipcode-34108.
- Kinkead, T., 2026. Pelican Bay Market Report, July 2026. https://www.naplescoastalconnection.com/blog/pelican-bay-market-report-july-2026/.
- Oliver Reports Florida, 2026. Pelican Bay Mid-Year 2026 Market Report. https://oliverreportsfl.com/pelican-bay-mid-year-2026-market-report/.
- U.S. Census Bureau, 2026. American Community Survey 2020-2024 five-year estimates, the Pelican Bay area (via Census Reporter). https://censusreporter.org/profiles/86000US34108-34108/.
- Realtor.com, 2026. Housing Inventory: Active Listing Count in Naples-Immokalee-Marco Island, FL (CBSA). https://fred.stlouisfed.org/series/ACTLISCOU34940.
- Realtor.com, 2026. Housing Inventory: Median Days on Market in Naples-Immokalee-Marco Island, FL (CBSA). https://fred.stlouisfed.org/series/MEDDAYONMAR34940.
- Realtor.com, 2026. Housing Inventory: Price Reduced Count in Naples-Immokalee-Marco Island, FL (CBSA). https://fred.stlouisfed.org/series/PRIREDCOU34940.
Related research

Seller Guide · October 6, 2026
How to Prepare Point Pleasant Beach Rental Records Before Selling
Separate rental approval, income history and booked stays before comparing sale terms.

Seller Guide · October 6, 2026
How to Prepare Rumson Flood and Waterfront Records Before Selling
Separate flood disclosure, elevation, repairs and waterfront rights before comparing sale terms.

Seller Guide · October 6, 2026
How to Prepare Sarasota Condo Inspection and Reserve Records Before Selling
Separate building condition, reserve funding and resale documents before comparing sale terms.