Market Brief · by Aidan Sowa · October 5, 2026
Which Bird Key Price Is the Real One? Reading Several Medians and an Average Listing
Reading Several Medians and an Average Listing for Bird Key, FL, with each source dated and its limits noted, for owners weighing a listing against a direct sale.
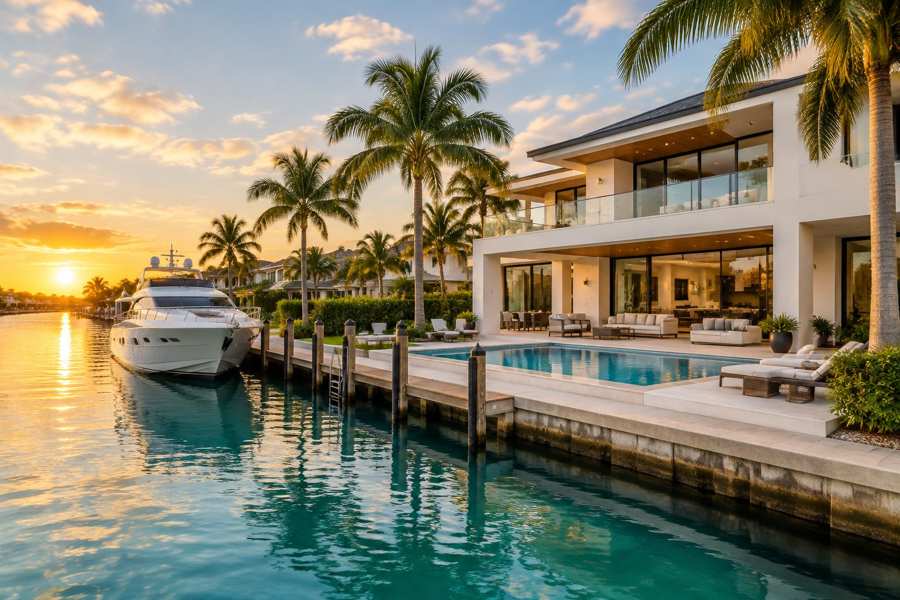
Which Bird Key price is the real one? A brokerage page on the island gives a median price of $2,850,000, with 58 days on market. A second brokerage page lists thirty recent sales whose median sold price, worked out for this brief, is $3,972,500. Realtor.com's neighborhood page, with key indicators as of April 2026, gives a median listing price of $5,062,500, and the twelve single-family listings on the second brokerage page average $6,786,250.
The waits differ as widely as the prices. Realtor.com shows a median of 74 days on market, up 111.43% on the year. The brokerage's active listings have been on the market for an average of 219 days, and the longest for 625. The thirty sales show a median of 70.5 days and an average of 120. Bird Key has about 511 residential lots on 265 acres, so a handful of homes sets every one of these figures.
This brief reads the Realtor.com page for Bird Key, a brokerage's real estate report for Bird Key, a second brokerage's area page and the Census profile side by side, tests the figures against one another, adds the Sarasota area series and asks what they mean for an owner choosing between a public listing and a private sale.
Key Findings
- Realtor.com reported, with key indicators as of April 2026, a median listing price of $5,062,500 for Bird Key (up 19.82% on the year and up 58.45% on three years), $1,181 per square foot (up 1.72% and up 14.66%), 30 active listings (up 40.91% and up 158.33%), a median of 74 days on market (up 111.43% and up 57.45%) and 3 rental properties.
- The same page gave a sale-to-list ratio of 92%, with homes selling 7.59% below the asking price on average in March 2026.
- A second brokerage's page, with data as of September 8, 2026, gave a median price of $2,850,000, 58 days on market and growth of 5.2%, and described about 511 residential lots on 265 acres with a single guarded entrance.
- A brokerage's real estate report listed twelve active single-family homes with an average list price of $6,786,250, $1,502 per square foot and 219 days on the market, from $1,325,000 to $11,900,000 and from 17 to 625 days.
- The same report listed thirty sold homes, dated from November 2025 to September 2026, with a median sold price, worked out for this brief, of $3,972,500, from $1,150,000 to $10,600,000, all below their list prices, at a median of 95.1% of list and a median of 70.5 days.
- In the Sarasota area the median days on market was 73 in March 2026 and 89 in July (Realtor.com, days on market).
Why do three medians for one island disagree by a factor of nearly two?
The three medians are $2,850,000, $3,972,500 and $5,062,500, and the highest is 1.8 times the lowest. They measure different things. The first is the brokerage's median price on its area page, as of September 2026, and the page does not say whether it counts all home types, a year of sales or a shorter period. The second is this brief's median of thirty recorded sales over about ten months. The third is a median of asking prices in April.
A median asking price sits above a median sold price for two reasons. Sellers ask for more than they get, and the homes that stay for sale are often the more expensive ones. Here the gap between the median list price of the thirty sold homes, $4,145,000, and their median sold price, $3,972,500, is $172,500, or 4.2%. Realtor.com's median listing price of $5,062,500 is 27% higher than the median sold price of the thirty sales, which is a larger gap than asking alone explains, and so the unsold stock was priced higher than the homes that sold.
The composition of the sample matters on an island of 511 lots. The brokerage's description says interior lots without direct waterfront start near $1 million, canal-front homes with private docks run from $2 million to $6 million and waterfront estates on the bay typically sell for $5 million to $15 million or more. Of the thirty sales, 6 were under $2 million, 13 were between $2 million and $5 million and 11 were $5 million or more. A different mix would put the median anywhere from $2.5 million to $5 million.
A reader should also notice the scale of the sample. Thirty sales in ten months is about three a month on an island of roughly 511 lots, so an owner who sells is selling into a market where, in a typical month, only a few homes close. One sale at $10.6 million raises the average of the thirty by about $200,000 and leaves the median almost unchanged, which is why the median is the better figure here, and why a seller should ask for medians and for the individual sales behind them.
For an owner, the useful reading is that no single median is the price of any one house. The price depends on whether the lot is on the bay, on a canal or inland, on the dock, the lot size and the build. A bay estate and an interior-lot home are both on Bird Key, and they share a median only on paper.
| Source and period | Measure | Value |
|---|---|---|
| Brokerage area page, September | Median price | $2,850,000 |
| Thirty recent sales, November 2025 to September 2026 | Median sold price | $3,972,500 |
| Realtor.com, April | Median listing price | $5,062,500 |
| Twelve active listings | Average list price | $6,786,250 |
Source: Realtor.com and two brokerage pages as cited. The median of thirty sales, the median list price of those sales, the $172,500 and 4.2% gaps, the 27% gap and the counts by price band are this brief's arithmetic from the rows of the brokerage's sold table. The range of $2.5 million to $5 million is this brief's illustration. Commercial content; not independently verified.
What do thirty recent sales show about discounts and speed?
The brokerage's sold table gives each home's list price, sold price, days on the market and sale date. All thirty homes sold below their list prices. The median sold price was 95.1% of the list price, and the average was 93.0%. On the median list price of $4,145,000, a ratio of 95.1% means about $203,000 below asking. Realtor.com's own figure for March is 92%, with homes selling 7.59% below the asking price, and it fits the same pattern.
The waits are very wide. The median was 70.5 days and the average 120 days, and the gap shows a long tail: 10 of the thirty homes took more than 100 days, one took 399, another 281 and one 1,021, while 7 sold within 30 days and one sold in a single day. The average of 117 days on the page for its full table of 32 rows is close to this brief's 120 days for 30.
A quick sale and a slow sale were often at the same price. Homes that sold for about $10.5 million and $10.6 million took 72 and 202 days. Two sales at $6,550,000 took 1 day and 82 days. A home that sold for $4,512,500 took 51 days and one at $3,795,000 took 399. The list price and the condition of the property explain most of the difference, and the table does not say which.
The discount also grows with the price. Looking at the sales above $5 million, the sale prices of $10.5 million and $10.6 million came after waits of 72 and 202 days, and the lowest-priced sales, near $1.2 million, took 23 and 43 days. This is a small sample, and it suggests that the top of the island moves slowly and at a discount while the lower end sells quickly. Sellers of larger estates should plan for the longer wait and should keep carrying costs, such as insurance, taxes and upkeep of the dock and grounds, in view for the whole of it.
The year-on-year figure on Realtor.com shows the pace slowing: the median of 74 days on market is up 111.43% on the year, which implies about 35 days a year earlier. Listings, at 30, are up 40.91% on the year, about 21 a year earlier, and up 158.33% on three years, about 12. More stock and more waiting is the pattern, and it matches what the brokerage's active list shows.
| Measure | Value |
|---|---|
| Median sold price | $3,972,500 |
| Range of sold prices | $1,150,000 to $10,600,000 |
| Sales under $2 million, $2 to $5 million, $5 million or more | 6, 13, 11 |
| Median share of list price received | 95.1% |
| Median and average days on market | 70.5 and 120 |
| Sales over 100 days, and within 30 days | 10 and 7 |
Source: a brokerage's sold table as cited, using the thirty rows it displayed of 32. All figures in the table, the $203,000, the average of 93.0% and the implied earlier counts are this brief's arithmetic. The table's own average for its full 32 rows is 117 days. Commercial content; not independently verified.
What do twelve active listings say about the next sale?
The brokerage's active list has twelve single-family homes. Their average list price is $6,786,250, their median list price is $7,395,000 and they run from $1,325,000 to $11,900,000. The average price per square foot is $1,502, and the average time on the market is 219 days. Two homes have been listed for 17 days, and the rest for between 119 and 625 days.
The comparison with the sales is hard on the sellers. The sold homes had a median list price of $4,145,000, and the active listings have a median of $7,395,000, which is 78% higher. The sold homes were sold at $1,095 per square foot at the median, and the active homes ask $1,502 on average, 37% more. A buyer who has seen the sales sees an asking price well above them. This is a comparison of two different groups of homes, and it is not a forecast.
Ten of the twelve have been listed for more than 100 days and five for more than 240. A home that is listed for most of a year has been seen and passed over by many buyers, and the price is often the reason. Realtor.com counts 30 listings in April, and the brokerage lists twelve of one type in the autumn, so the two counts cannot be compared directly.
One feature of the list deserves a note. Two homes have been listed for only 17 days, at $6,990,000 and $7,995,000, and they are priced near the middle of the active group. They show that fresh listings still appear at prices far above the sold median. Whether they sell near those asking prices will not be known until the sales are recorded, and the history of the island, with every one of the thirty recent sales below its list price, suggests a buyer expects a discount.
For an owner, the active list is the competition. A seller who lists at $7 million joins a group that has not been selling at those prices. A seller who accepts that the sales show a median near $4 million for the whole island, and prices a particular house against its nearest sold comparables, is in the group of homes that sold in 70 days.
Source: a brokerage's active listing table as cited. The median list price of $7,395,000, the 78% and 37% gaps, the counts of listings above 100 and 240 days and the median price per square foot of the sold homes are this brief's arithmetic from the table's rows. Commercial content; not independently verified.
What does the Census say about who lives around the island?
The Census data is for the postal area that includes Bird Key, which is far larger than the island and is also the area used for the Downtown Sarasota post on this site. It has 14,446 residents. The median age is 66.6 years. Households have 1.7 people on average. Per capita income is $111,653, 9.7% of people are below the poverty line, and 62.8% of adults have a bachelor's degree or higher. The mean travel time to work is 19.7 minutes, and 16.6% of people moved in the previous year.
The age figure is the one to note. A median age of 66.6 means that half of the residents are older than that, and a household of 1.7 people usually means one or two adults. A home of 4,300 square feet, which is the average of the active listings, can be much more house than a household of that size needs, and owners in that position are the natural sellers of the island. The Census does not say how many of them plan to sell.
The owner-estimated median home value of the postal area is $1,018,100, with a margin of error of $70,885, or 7.0%. That is a fifth of the Realtor.com median listing price of $5,062,500 and a quarter of this brief's sold median, so the postal area is mostly made up of homes and condominiums that are far cheaper than the island's. The Census cannot describe Bird Key on its own, and the owners who live there are a small part of the area's population.
The area's stock is 44.4% older than 1980 and 41.9% built since 2000, and the island's own stock is not reported separately. A seller of a home from the 1970s or 1980s on the island faces buyers who often plan to rebuild, and for them the lot matters more than the building. A private buyer who wants the lot does not need to commission an inspection to learn what the house needs.
Source: U.S. Census Bureau, American Community Survey 2020-2024 and the brokerage and Realtor.com pages as cited. The ratios and shares are this brief's arithmetic. The remarks on household size, natural sellers and rebuilding are this brief's reasoning and not statements of the Census.
What does the Sarasota area series add?
In the Sarasota area, active listings fell from 9,135 in April 2026 to 7,136 in August (Realtor.com, active listings), a drop of 21.9%. Price-reduced listings fell from 3,450 in April to 2,204 in August (Realtor.com, price reduced listings), a drop of 36.1%. The median wait rose from 73 days in March to 89 in July, an increase of 16 days.
The regional median listing price was $493,475 in February and $485,000 in June (Realtor.com, median listing price), a drop of 1.7%. The region is a market of homes near $500,000, and Bird Key is a market at ten times that. The regional series is useful for the direction of waits, which are rising, and not for the level of any island price.
An owner can test any offer, public or private, with plain questions. What is the price, and is any part of it conditional on an inspection, a loan or the sale of another home? What will I take home after every charge? When will the sale close, and can the date move? Who pays for the repairs a buyer asks for?
A waterfront island has more. Is the seawall in good order, and what will a buyer's engineer say about the dock and the lift? What does the insurer charge for wind and flood, and has the policy been renewed? Which sales in the last year are true comparables for my lot and my frontage, and how many days did they take? Is my price set for the 70 days of the median sale or the 219 days of the active listings? Readers comparing markets can also read the Downtown Sarasota brief and the Pelican Bay brief.
Source: Realtor.com series published by the Federal Reserve Bank of St. Louis as cited. The 21.9%, 36.1%, 16 day and 1.7% figures are this brief's arithmetic. The comparison of the region and the island and the questions are this brief's reasoning and not statements of any source.
What does a private sale change?
Maison Off-Market buys homes directly from their owners. It does not list a home, hold showings or put a home on a public listing. For a Bird Key owner, the five benefits are plain. There are no showings and no neighbors talking about the sale. The closing date can be flexible, which gives time to find a new home. There are no commission costs and no closing costs for the seller, and there are no inspections and repairs.
A little arithmetic shows what that is worth. Each 1% of a $3,972,500 sale is $39,725. A seller who gives up 3% gives up $119,175, and one who gives up 5% gives up $198,625. This brief does not claim that those are the costs of any sale, since the real figures depend on the agreement the seller signs. It shows how quickly a percentage becomes a sum, and the gap between listing and sale in the thirty sales, a median of 4.9%, is a cost of its own.
Privacy matters on a gated island where a listing, a showing and a sale price are all noticed. The flexible date matters where 10 of 30 sales took over 100 days and the active listings have waited for 219 days. The absence of inspections and repairs matters where a buyer's inspector reviews a seawall, a dock, a roof and a pool on a house exposed to salt air and storms.
Maison Off-Market speaks only to sellers. An owner who wants to see what a direct offer would look like can use the contact form below, or call 401-219-4207, and ask for a figure with no showings, no listing and no obligation.
Source: Maison Off-Market and the sources above as cited. The fee figures are this brief's arithmetic and not claims about any sale. The median gap of 4.9% is 100% minus the median ratio of 95.1%.
Methodology and limitations
Listing prices, price per square foot, listing counts, days on market and the sale-to-list ratio come from a national listing site page with key indicators as of April 2026, which is older than the other sources. Active listings and thirty sales come from a brokerage's real estate report, whose sold table showed thirty of 32 rows; medians, ranges, ratios and counts from those rows are this brief's arithmetic. The median price and lot counts come from a second brokerage's area page with data as of September 2026. The sources cover different periods and home sets and are not independently verified.
Age, income, education, commuting, household size and owner-estimated value come from the American Community Survey five-year estimates for the postal-code area that includes Bird Key, and the age of the stock from the 2020-2024 estimates. The area is far larger than the island. Shares are calculated from published counts, and owner-estimated value carries a margin of error.
Days on market, active listings, median listing price and price reduced counts are Realtor.com series published by the Federal Reserve Bank of St. Louis for the North Port-Sarasota-Bradenton area. They describe the region and not the island. Implied earlier values are this brief's arithmetic. The brief makes no forecast and values no home.
Conclusion
The Bird Key record shows three medians of $2,850,000, $3,972,500 and $5,062,500, twelve listings averaging $6,786,250 after 219 days, thirty sales at a median of 95.1% of list in 70.5 days, and about 511 lots on one island. It describes a very small market in which a handful of homes decides every figure, and in which the lot, the frontage and the price decide how long a house waits.
It does not fix a price for any one home. The choice between a public listing and a private sale comes down to whether an owner would rather meet showings, inspections and a repair list or take privacy, a flexible closing date, no commission, no closing costs and no inspections or repairs. To see what a direct offer would look like for your home, use the contact form below or call 401-219-4207.
Frequently Asked Questions
What is the median home price on Bird Key?
It depends on the source. A brokerage page gives $2,850,000, thirty recent sales give a median of $3,972,500, and Realtor.com gives a median listing price of $5,062,500 for April 2026.
How long do Bird Key homes take to sell?
Realtor.com reports a median of 74 days on market. Thirty recent sales show a median of 70.5 days, and twelve active listings average 219 days.
Do homes sell below asking?
In the thirty recent sales, every home sold below its list price, at a median of 95.1%. Realtor.com reports a sale-to-list ratio of 92%.
How many homes are for sale?
Realtor.com counts 30 for April 2026, and a brokerage lists twelve single-family homes in autumn.
Does a private sale always beat a public listing?
No. A public listing can attract competing bids. A private sale offers privacy, a flexible closing date, no commission, no closing costs and no inspections or repairs.
Compare your options before committing. Request a written private offer for your property, with no obligation, then weigh it against your listing plan.
Sources
- Realtor.com, 2026. Bird Key Neighborhood of Sarasota, FL Housing Market. https://www.realtor.com/local/market/florida/sarasota/bird-key.
- Sarasota One, 2026. Real Estate Report for Bird Key. https://www.sarasotaone.com/sarasota-county-homes/bird-key-homes/real-estate-report/.
- Keys of Sarasota, 2026. Bird Key Real Estate 2026. https://www.keysofsarasota.com/areas/bird-key.
- U.S. Census Bureau, 2026. American Community Survey 2020-2024 five-year estimates, the Bird Key area (via Census Reporter). https://censusreporter.org/profiles/86000US34236-34236/.
- Realtor.com, 2026. Housing Inventory: Median Days on Market in North Port-Sarasota-Bradenton, FL (CBSA). https://fred.stlouisfed.org/series/MEDDAYONMAR35840.
- Realtor.com, 2026. Housing Inventory: Active Listing Count in North Port-Sarasota-Bradenton, FL (CBSA). https://fred.stlouisfed.org/series/ACTLISCOU35840.
- Realtor.com, 2026. Housing Inventory: Price Reduced Count in North Port-Sarasota-Bradenton, FL (CBSA). https://fred.stlouisfed.org/series/PRIREDCOU35840.
- Realtor.com, 2026. Housing Inventory: Median Listing Price in North Port-Sarasota-Bradenton, FL (CBSA). https://fred.stlouisfed.org/series/MEDLISPRI35840.
Related research

Seller Guide · October 6, 2026
How to Prepare Point Pleasant Beach Rental Records Before Selling
Separate rental approval, income history and booked stays before comparing sale terms.

Seller Guide · October 6, 2026
How to Prepare Rumson Flood and Waterfront Records Before Selling
Separate flood disclosure, elevation, repairs and waterfront rights before comparing sale terms.

Seller Guide · October 6, 2026
How to Prepare Sarasota Condo Inspection and Reserve Records Before Selling
Separate building condition, reserve funding and resale documents before comparing sale terms.