Market Brief · by Aidan Sowa · October 5, 2026
Which Hyde Park Clock Is Right? Reading Several Pages and Their Medians
Reading Several Pages and Their Medians for Hyde Park, FL, with each source dated and its limits noted, for owners weighing a listing against a direct sale.
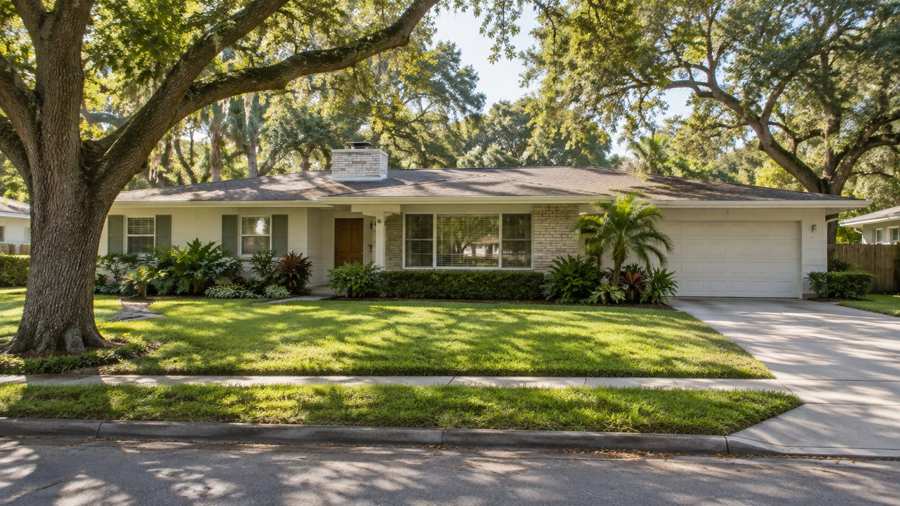
How long does a Hyde Park house take to sell? Four pages give four answers. Realtor.com's September 2026 page says the median home waits 95 days. A Tampa brokerage blog, quoting Realtor.com in June, says 74, and quoting Redfin for the three months to May, says 41. Houzeo's page says 18. The pages also disagree about price. Realtor.com's median listing price is $792,450 and its median sold price is $1,005,000. The blog quotes $909,000 for the listing median in June. Houzeo's median sale price is $1,078,000.
The spread is wide enough to change what an owner does. A wait of 18 days is a seller's market in which a sign in the yard is enough. A wait of 95 days is a market in which a seller should plan for a quarter of a year of carrying costs and negotiation. Both claims are in print about the same neighborhood in the same year, and a seller who reads one of them will plan for the wrong market.
This brief reads the Realtor.com page for Hyde Park, the Houzeo page and a Tampa brokerage blog on selling in Hyde Park side by side, tests the neighborhood table against the headline count, reads the City of Tampa's rules for the historic district, adds the Census profile and the Tampa series, and asks what the numbers mean for an owner who is choosing between a public listing and a private sale.
Key Findings
- Realtor.com reported, as of September 2026, a median listing price of $792,450 for Hyde Park (down 5.74% on the month and up 26.15% on the year), a median sold price of $1,005,000 (down 8.84% and up 10.74%), $554 per square foot (up 4.95% on the year), 50 homes for sale (down 3.85%) and a median of 95 days on market (up 2.13%).
- The same page counted 59 rentals (up 16.67%) at a median rent of $2,500 a month (down 19.02%), gave a sale-to-list ratio of 96%, with homes selling 3.51% below the asking price in September, and called the market warm.
- A Tampa brokerage blog dated June 18, 2026 reported a Realtor.com median listing price of $909,000 with 59 active listings and a median of 74 days, and a Redfin median sale price of $505,830 for the three months to May with 34 homes sold in May and an average of 41 days. These figures are the blog's report and were not checked against the Redfin page.
- Houzeo's page reported a median sale price of $1,078,000, a median of 18 days on market, 1.33 months of supply, a sale-to-list ratio of 96.64% and 12 homes listed, and described a strong seller advantage. Its charts showed no data when the page was read.
- In the Census postal area that includes Hyde Park, the median household income is $120,729, the median gross rent is $2,100 and the owner-estimated median home value is $845,600, with a margin of error of $73,045 (Census Reporter, American Community Survey profile).
- In the Tampa-St. Petersburg-Clearwater area the median days on market was 67 in May 2026 and 76 in September (Realtor.com, days on market).
Why do four pages give four medians?
Start with the Realtor.com page alone. The listing median of $792,450 is up 26.15% on the year, which implies about $628,000 a year earlier. The sold median of $1,005,000 is up 10.74%, which implies about $907,000. The sold median is $212,550, or 26.8%, above the listing median. In most markets homes sell below their asking price, and this page says so: homes sold 3.51% below the asking price. A sold median above the listing median therefore means that the homes that sold were not the homes that were listed.
The explanation is mix. The listing median covers the 50 homes on the market in September. The sold median covers the few homes that closed in the period, probably a small number given a 95 day wait. If the sold homes were larger, older houses on the best streets and the listed homes included many condominiums, the sold median would be higher. The month-on-month moves, down 5.74% for listings and down 8.84% for sales, show how much a few homes shift both numbers.
The blog's June figure of $909,000 for the Realtor.com listing median is 14.7% above September's $792,450. Listings fell by 9 homes over the same time, from 59 to 50, and the wait rose from 74 days to 95. That is a market in which the higher-priced homes either sold or left, and the remaining stock is cheaper and has waited longer. It is an inference from the two numbers and not a statement of either source.
Houzeo's median sale price of $1,078,000 is 7.3% above Realtor.com's sold median. Its charts showed no data, so the figure and the 18 days beside it cannot be checked against a series. The Redfin figure of $505,830 reported by the blog is about half of the other sold medians and is probably a different area, since it is hard to square with $554 per foot. At that price per foot it would buy a house of about 910 square feet. This brief treats it as a measure of some other boundary.
| Source | Median price | Median days on market | Homes |
|---|---|---|---|
| Realtor.com, September | $792,450 listing, $1,005,000 sold | 95 | 50 for sale |
| Realtor.com, as quoted in June | $909,000 listing | 74 | 59 for sale |
| Redfin, as quoted for the three months to May | $505,830 sold | 41 (average) | 34 sold in May |
| Houzeo | $1,078,000 sold | 18 | 12 listed |
Source: Realtor.com, Houzeo and a Tampa brokerage blog as cited. The $628,000, $907,000, $212,550, 26.8%, 14.7%, 7.3% and 910 square foot figures are this brief's arithmetic from the stated figures. The reading of the mix of homes is this brief's inference and is not a statement of any source. Commercial content; not independently verified.
Do 94 homes in a table add up to 50?
The Realtor.com page lists homes for sale in eleven named areas with a count above zero. They are Hyde Park Historic District 31, Courier City and Oscawana 28, Bayshore Condominiums 10, The Madison at SoHo Condominiums 10, Adalia Bayfront Condominiums 3, Corronella 3, Oscawana 3, Hyde Park Place Condominiums 2, Hyde Park Walk a Condominium 2, Bayshore Place 1 and Bungalow Terrace 1. The sum is 94. The headline count is 50. The table adds up to 188% of it.
The reason is overlap. Courier City and Oscawana is one area on the list, and Oscawana is another. Adalia Bayfront Condominiums appears in the table for Davis Islands as well, with the same 3 homes. A home can sit in a subdivision, a historic district and a larger neighborhood at once, and the table counts it in each. The headline of 50 counts every home once. This is a useful warning for any reader who adds up a neighborhood table.
The table is still informative about price. The Hyde Park Historic District has a median listing price of $1,398,500 and $597 per foot, which implies a house of about 2,340 square feet. Courier City and Oscawana has $490,000 and $359, about 1,360 square feet. Bayshore Condominiums has $574,500 and $531, about 1,080 square feet, and The Madison at SoHo Condominiums has $314,500 and $346, about 910 square feet. The top of the list costs 4.4 times the bottom.
The waits differ by area as well. The Madison at SoHo shows 64 days, Courier City and Oscawana 78 and the Historic District 82. All three are below the neighborhood's 95. A neighborhood median can sit above every named area it contains if the unnamed homes wait longer, which suggests that homes outside the named areas, perhaps the larger and more expensive ones, take the longest to sell.
For the postal area that includes Hyde Park, the same page shows 155 homes for sale (down 21.55%), a median listing price of $1,300,000, $548 per foot and a median rent of $2,300. The postal-area median is 64% above the neighborhood's $792,450. The postal area also holds other neighborhoods, so it is not a better measure for Hyde Park. It shows how much the answer depends on where the line is drawn.
| Area | Median listing price | Price per sq ft | Homes for sale |
|---|---|---|---|
| Hyde Park Historic District | $1,398,500 | $597 | 31 |
| Courier City and Oscawana | $490,000 | $359 | 28 |
| Bayshore Condominiums | $574,500 | $531 | 10 |
| The Madison at SoHo Condominiums | $314,500 | $346 | 10 |
Source: Realtor.com page as cited. The sum of 94, the 188%, 4.4, 64% and square foot estimates are this brief's arithmetic. Only four of the eleven areas are shown in the table. The reading of overlapping areas is this brief's inference from the repeated names. Commercial content; not independently verified.
Which clock should a seller plan around?
Of the four waits, the one in the most recent, best-documented source is the Realtor.com figure of 95 days, which is up 2.13% on the year. It is the only one with a stated month and a change on the year. The blog's 74 days for June is also Realtor.com, and the rise from 74 to 95 over three months is 28.4%, or 21 days. The pace of the rise is itself a fact for a seller: the wait grew faster in Hyde Park than in the region.
The Tampa area series says that the median days on market rose from 67 in May to 76 in September, an increase of nine days, or 13.4%. Hyde Park's rise of 21 days over June to September is more than twice that. It may be a result of higher asking prices meeting a cooler summer, though the pages do not say. Hyde Park's 95 days is 19 days, or 25%, above the regional 76.
The shorter waits deserve a careful reading. Redfin's average of 41 days, as quoted, is an average and may count homes that sold quickly at lower prices. Houzeo's 18 days comes with 12 homes listed and charts that showed nothing, and the page speaks of 1.33 months of supply, which is about 40 days of stock at the sales pace. Both are well below the Realtor.com figure for the same year. Numbers that low would put Hyde Park among the fastest markets in Tampa, and the Realtor.com page does not support it.
The sale-to-list ratio is more consistent. Realtor.com has 96% with homes selling 3.51% below asking. Houzeo has 96.64%. Those two agree within a point. On the Realtor.com listing median of $792,450, a 3.51% discount is about $27,800. The practical advice is to expect a sale a few percent under the ask and a wait that is closer to three months than to three weeks.
Source: Realtor.com, Houzeo, the Tampa brokerage blog and the Tampa series as cited. The 28.4%, 21 day, nine day, 13.4%, 19 day, 25%, 40 day and $27,800 figures are this brief's arithmetic. The reading of the shorter waits is this brief's reasoning and not a statement of either source. Commercial content; not independently verified.
What do the city's historic district rules mean for a sale?
The Tampa brokerage blog notes that the City of Tampa describes Hyde Park as the city's oldest existing neighborhood and that development in historic districts is reviewed by architectural boards, with a Certificate of Appropriateness required for new construction, additions and exterior repairs. The City of Tampa's Hyde Park Design Guidelines page lists headings for the history and architectural styles of the district, the purpose of the guidelines, the design of compatible new construction, scale, massing and building form, landscape and site elements, fences and walls, and artificial siding.
For a seller, that has a plain consequence. A house inside the district cannot be changed as freely as a house outside it, and a buyer who plans to rebuild, add on or replace siding has to ask the city first. That can lower what some buyers will pay, and raise what others will pay for a house that is already in good shape. It also means that a seller's own repair projects before a sale may need review, which takes time.
The Census shows how much of the postal area is old. Of 11,406 homes, 2,121 were built in 1939 or earlier, 18.6%, the largest single group after the 2010s. A further 535 date from the 1940s and 965 from the 1950s. Together, homes built before 1960 number 3,621, 31.7%. Those are the houses most likely to be inside a historic district, and the oldest to need work on roofs, wiring and plumbing.
This brief does not know whether any particular house is inside the district, and the boundary matters. The Realtor.com table separates the Hyde Park Historic District, with a median of $1,398,500, from Courier City and Oscawana at $490,000. An owner should confirm the status of the house with the city before pricing it, and should ask any buyer whether they plan work that needs review.
Source: City of Tampa page, the Tampa brokerage blog, Realtor.com and the U.S. Census Bureau, American Community Survey 2020-2024, as cited. The 3,621 and 31.7% figures are this brief's arithmetic. The consequences for sellers are this brief's general reasoning and not statements of the city.
What does the Census say about the people and the stock?
The postal area that includes Hyde Park has 24,570 residents and 11,406 housing units, of which 9,885 are occupied. Renters hold 5,546 of them (56.1%) and owners 4,339 (43.9%). The 1,521 vacant homes are 13.3% of the stock. The median household income is $120,729 and the owner-estimated median home value is $845,600, with a margin of error of $73,045, or 8.6%.
The Census value is 6.7% above the Realtor.com listing median of $792,450 and 15.9% below the sold median of $1,005,000. It sits between them. It is 7.0 times the median income. The Realtor.com listing median is 6.6 times the income, and the sold median is 8.3 times. A typical household with a typical income would need most of a decade of gross income to buy at any of the three prices.
The Census median gross rent is $2,100 and the Realtor.com median rent is $2,500, 19.0% higher. At $2,500 a month the yearly rent is $30,000, which is 3.8% of the listing median and 3.0% of the sold median. Rent also fell 19.02% on the year on the page, though the 59 rentals behind it are few. The Census rent applies to every renter in the postal area, not only to new leases.
The stock has two ends. At one end, homes from 1939 or earlier are 18.6% of the total. At the other, 2,267 homes from the 2010s and 244 from 2020 or later are 22.0%. The homes from the 1960s number 469, only 4.1%, the smallest decade. The median year built is 1991. Hyde Park sits in the older group, and the newer towers and townhouses near it make up the rest.
Source: U.S. Census Bureau, American Community Survey 2020-2024 and Realtor.com as cited. Multiples, shares, yields and gaps are this brief's arithmetic. The remark on where Hyde Park sits in the stock is this brief's reasoning and not a statement of the Census.
What does the Tampa series add, and what should an owner ask?
Active listings in the Tampa area stood at 17,967 in May 2026 and 17,965 in September (Realtor.com, active listings), with a peak of 18,292 in July. The stock is flat while the wait rose, which means homes are leaving the market more slowly. New listings fell from 6,200 in May to 5,534 in July (Realtor.com, new listings), a drop of 10.7%.
The regional median listing price was $400,000 in May and $397,450 in July (Realtor.com, median listing price), so the Hyde Park listing median is 2.0 times it. Homes with a price cut numbered 7,596 in May (Realtor.com, price reduced listings), 42.3% of the 17,967 active homes, after 7,938 in March. Four in ten homes in the region had cut their price.
An owner can test any offer, public or private, with plain questions. What is the price, and is any part of it conditional on an inspection, a loan or the sale of another home? What will I take home after every charge? When will the sale close, and can that date move? Who pays for the repairs a buyer asks for after an inspection?
For a house in Hyde Park there are more. Is the house inside the historic district, and what would a buyer be allowed to change? What are the age and condition of the roof, the wiring, the plumbing and the foundation in a house from the 1920s? What do flood and wind insurance cost, given the nearness of the water? If the sale takes three months, what does an owner pay in taxes, insurance and upkeep before it closes? Readers comparing markets can also read the Victoria Park brief and the Davis Islands brief.
Source: Realtor.com series published by the Federal Reserve Bank of St. Louis as cited. The 10.7%, 2.0 and 42.3% figures are this brief's arithmetic. The questions are this brief's general reasoning and not statements of any source.
What does a private sale change?
Maison Off-Market buys homes directly from their owners. It does not list a home, hold showings or put a home on a public listing. For a Hyde Park owner, the five benefits are plain. There are no showings and no neighbors talking about the sale. The closing date can be flexible, which gives time to find a new home. There are no commission costs and no closing costs for the seller, and there are no inspections and repairs.
A little arithmetic shows what that is worth. Each 1% of a $1,005,000 sale is $10,050. A seller who gives up 3% gives up $30,150, and one who gives up 5% gives up $50,250. At the Realtor.com listing median of $792,450, each 1% is $7,925. This brief does not claim that those are the costs of any sale, since the real figures depend on the agreement the seller signs. It shows how quickly a percentage becomes a sum.
The last benefit matters most in an old house. A public sale of a 1920s house usually brings an inspection, and an inspection brings a list of repairs and a round of negotiation. In a historic district, some of those repairs need the city's review before the work can start. A seller who sells as is, to a buyer who plans the work, avoids that step. The trade is that the price may differ from what a public sale could bring, and each owner can weigh the two.
Maison Off-Market speaks only to sellers. An owner who wants to know what a direct offer would look like can use the contact form below, or call 401-219-4207, and ask for a figure with no showings, no listing and no obligation.
Source: Maison Off-Market. The fee figures are this brief's arithmetic and not claims about any sale.
Methodology and limitations
Prices, price per square foot, days on market, listing and rental counts and the neighborhood tables come from a national listing site page as of September 2026. Other figures come from a second price page and from a Tampa brokerage blog dated June 2026 that quotes two further sites. The pages use different boundaries and months and are not independently verified.
Age, tenure, vacancy, income, rent and owner-estimated value come from the American Community Survey 2020-2024 five-year estimates for the postal-code area that includes Hyde Park. Shares are calculated from published counts, and owner-estimated value carries a margin of error.
Days on market, active and new listings, median listing price and price reduced counts are Realtor.com series published by the Federal Reserve Bank of St. Louis for the Tampa-St. Petersburg-Clearwater metropolitan area. They describe the region and not the neighborhood. The brief makes no forecast and values no home.
Conclusion
The Hyde Park record shows four waits from 18 days to 95, four medians from $792,450 to $1,078,000 and a neighborhood table that adds up to 94 homes against a headline of 50. The best-documented page points to a slower, more negotiated market than the fastest pages claim.
It does not fix a price for any one home. The choice between a public listing and a private sale comes down to whether an owner would rather meet a slow quarter of showings, inspections and historic district questions or take privacy, a flexible closing date, no commission, no closing costs and no inspections or repairs. To see what a direct offer would look like for your home, use the contact form below or call 401-219-4207.
Frequently Asked Questions
What is the median home price in Hyde Park?
Realtor.com reports a median listing price of $792,450 and a median sold price of $1,005,000 for September 2026. Houzeo reports a median sale price of $1,078,000.
How long do Hyde Park homes take to sell?
Realtor.com reports a median of 95 days. A Tampa brokerage blog quotes 74 days for June on Realtor.com and 41 on Redfin, and Houzeo reports 18.
Why do the pages disagree?
They use different boundaries and months, and they count listings and sales, which are different homes.
Do historic district rules affect a sale?
The City of Tampa reviews changes in historic districts, so a buyer who plans work may need approval first.
Does a private sale always beat a public listing?
No. A public listing can attract competing bids. A private sale offers privacy, a flexible closing date, no commission, no closing costs and no inspections or repairs.
Compare your options before committing. Request a written private offer for your property, with no obligation, then weigh it against your listing plan.
Sources
- Realtor.com, 2026. Hyde Park Neighborhood of Tampa, FL Housing Market. https://www.realtor.com/local/market/florida/tampa/hyde-park.
- Houzeo, 2026. Hyde Park, Tampa, FL Housing Market in 2026. https://www.houzeo.com/housing-market/florida/tampa/hyde-park.
- 360 Realty Tampa, 2026. Is It the Right Time To Sell Your Hyde Park Home?. https://360realtytampa.com/blog/is-it-the-right-time-to-sell-your-hyde-park-home.
- U.S. Census Bureau, 2026. American Community Survey 2020-2024 five-year estimates, the Hyde Park area (via Census Reporter). https://censusreporter.org/profiles/86000US33606-33606/.
- Realtor.com, 2026. Housing Inventory: Median Days on Market in Tampa-St. Petersburg-Clearwater, FL (CBSA). https://fred.stlouisfed.org/series/MEDDAYONMAR45300.
- City of Tampa, 2026. Hyde Park Design Guidelines. https://www.tampa.gov/historic-preservation/info/design-guidelines/hyde-park-design-guidelines.
- Realtor.com, 2026. Housing Inventory: Active Listing Count in Tampa-St. Petersburg-Clearwater, FL (CBSA). https://fred.stlouisfed.org/series/ACTLISCOU45300.
- Realtor.com, 2026. Housing Inventory: New Listing Count in Tampa-St. Petersburg-Clearwater, FL (CBSA). https://fred.stlouisfed.org/series/NEWLISCOU45300.
- Realtor.com, 2026. Housing Inventory: Median Listing Price in Tampa-St. Petersburg-Clearwater, FL (CBSA). https://fred.stlouisfed.org/series/MEDLISPRI45300.
- Realtor.com, 2026. Housing Inventory: Price Reduced Count in Tampa-St. Petersburg-Clearwater, FL (CBSA). https://fred.stlouisfed.org/series/PRIREDCOU45300.
Related research

Seller Guide · October 6, 2026
How to Prepare Point Pleasant Beach Rental Records Before Selling
Separate rental approval, income history and booked stays before comparing sale terms.

Seller Guide · October 6, 2026
How to Prepare Rumson Flood and Waterfront Records Before Selling
Separate flood disclosure, elevation, repairs and waterfront rights before comparing sale terms.

Seller Guide · October 6, 2026
How to Prepare Sarasota Condo Inspection and Reserve Records Before Selling
Separate building condition, reserve funding and resale documents before comparing sale terms.