Market Brief · by Aidan Sowa · October 5, 2026
How Long Does a Bellevue Home Really Take to Sell? Reading a Short Wait and a Longer Wait
Reading a Short Wait and a Longer Wait for Bellevue, WA, with each source dated and its limits noted, for owners weighing a listing against a direct sale.
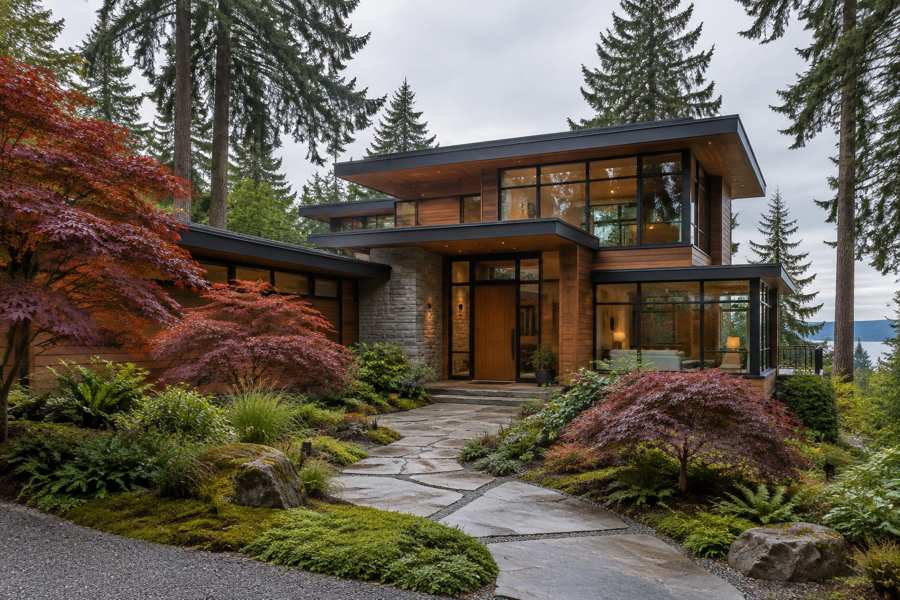
How long does a Bellevue home take to sell? Redfin says 16 days, up from 8 a year ago. Realtor.com says the median listing has been on the market for 45 days, up about 14% on the year. Both pages describe the same city in the same summer, and the second figure is nearly three times the first.
The labels disagree too. Redfin gives Bellevue a Compete Score of 79 out of 100 and calls it very competitive, with an average of 2 offers per home. Realtor.com calls it a warm market in one sentence and a balanced market two sentences later. Meanwhile the numbers on both pages point the same way: lower prices than a year ago, fewer sales, and more homes for sale.
This brief reads both pages together with the Census profile of the postal area that includes Bellevue and the Realtor.com series for the Seattle area. It asks what a doubling from 8 days to 16 means, why the Census value for Bellevue stops at $2 million, and what a seller who is not in a hurry should take from a market that is cooling from a very hot start. It then sets out what a private sale changes.
Key Findings
- Redfin reported a Bellevue median sale price of $1,549,224 for the three months to July 2026, down 5.8% on the year, at $646 per square foot (down 9.78%), with homes selling in 16 days against 8 a year earlier, 441 homes sold in July against 489, and 2 offers per home on average (Redfin, Bellevue).
- Redfin put the sale-to-list ratio at 98.1% (down 1.3 points), the share of homes sold above list price at 13.0% (down 13.4 points) and the share with price drops at 30.5% (up 1.0 point), and gave Bellevue a Compete Score of 79 (same Redfin page).
- Realtor.com reported a median listing price of $1,585,749 (down 2.60%), a median sold price of $1,525,000 (down 2.09%), $689 per square foot (down 5.10%), 747 active listings (up 29.21%, and up 158.84% over three years), a median of 45 days on market (up 14.29%) and a median rent of $2,950 a month (down 9.79%) (Realtor.com, Bellevue).
- In the Census postal area, 5,993 of 21,221 housing units (28.2%) were built before 1980, owners occupy 7,113 of 19,515 occupied homes (36.4%), median household income is $182,545 and the median home value is reported as $2,000,001, the top code of the table (U.S. Census Bureau, 2020-2024).
- In the Seattle-Tacoma-Bellevue area the median days on market rose from 34 in April 2026 to 45 in August (Realtor.com, days on market).
What does a wait that doubled from 8 days to 16 actually mean?
Sixteen days is a short wait. It is also twice the wait of a year earlier, and the page says so plainly: 16 days against 8. A seller reading only the first number would call Bellevue a fast market. A seller reading the second would see a market that has slowed by half in speed. Both readings are fair, and the useful question is which one describes the year ahead.
The sales count points to the slower reading. Redfin counted 441 homes sold in July against 489 a year earlier, which is 48 fewer, or 9.8%. Fewer homes sold, each took longer, and the share that sold above the asking price fell from about 26.4% to 13.0%, a drop of 13.4 points. The last figure is arithmetic on the page's own numbers: 13.0 plus 13.4.
A year ago, roughly one Bellevue home in four closed above its list price. Today it is roughly one in eight. That is the sharpest change on the page, and it describes the kind of competition a seller faces. A bidding war is possible, but it is no longer the usual outcome.
Median days on market is also a blunt measure. It sits at the middle of the homes that sold, so it hides the fastest and the slowest. Redfin's Compete Score panels say that the hottest homes go pending in about 5 to 7 days, while the average home in the same panels takes 15 to 22 days. Between those two figures lies the whole question for an owner: is my home one of the hot ones or one of the average ones?
| Indicator | Value | Change on the year |
|---|---|---|
| Median sale price | $1,549,224 | Down 5.8% |
| Median days on market | 16 | Up 8 days |
| Homes sold in July | 441 | Down 9.8% |
| Sale-to-list ratio | 98.1% | Down 1.3 points |
| Sold above list price | 13.0% | Down 13.4 points |
| Homes with price drops | 30.5% | Up 1.0 point |
Sources: Redfin page as cited. The 48, 9.8% and 26.4% figures are this brief's arithmetic on the page's numbers. The reading of the hot and average homes is this brief's reasoning. Commercial content; not independently verified.
Why does Realtor.com say 45 days?
The Realtor.com figure is not wrong, and it is not a different market. It measures a different thing. The page describes the median days on market for homes in Bellevue, and the series it draws on counts listings that are active, which are the homes that have not sold. Redfin counts homes that did sell. Homes that sell in a week leave the active count at once, so a list of homes still for sale leans toward homes that have sat.
That is why the two figures can both be true. In a market where the best homes go in a week and the rest wait six weeks or more, the sold figure comes out near two weeks and the unsold figure comes out near six. The gap between 16 and 45 days is roughly the gap between the homes that worked and the homes that did not.
The year-on-year change on the Realtor.com page is a rise of 14.29%, from about 39 days to 45. On the Redfin page the change is a doubling. Both pages show a slowdown, and they differ on its size because the unsold group was already slow a year ago.
A seller should ask of any wait figure whether it counts the homes that sold or the homes that did not. A figure of 16 days describes the successes. A figure of 45 days describes the listings that are still there. A home priced a little above the market tends to join the second group.
Sources: Redfin and Realtor.com pages as cited. The 39 days figure is this brief's arithmetic from the 14.29% rise. The explanation of the two clocks is this brief's reasoning and not a statement of either page. Commercial content; not independently verified.
Which price should a Bellevue owner start from?
Redfin's median sale price is $1,549,224 and Realtor.com's median sold price is $1,525,000. They differ by $24,224, or 1.6%. Two commercial sources that agree within 2% are a fair base, though both rely on listing data and are not fully independent.
The direction of change is consistent as well. Redfin reports a fall of 5.8%, which on its own figures means the median was about $95,000 higher a year ago. Realtor.com reports a fall of 2.09% for the sold median and 2.60% for the listing median. A seller using last year's price in mind would be about two to six percent too high on these pages.
The price per square foot is less settled. Redfin shows $646, down 9.78%, and Realtor.com shows $689, down 5.10%. The gap is $43, or 6.7% of the lower figure. A measure per square foot depends on which homes are counted and how the area is measured, so a gap of this size is not surprising, though both agree that the figure is falling faster than the price itself. That suggests that the homes selling now are somewhat larger than a year ago or that smaller homes are selling for less per foot.
The sensible starting point for a conversation about price is therefore the zone from about $1.52 million to $1.55 million for the median Bellevue sale. Whether a particular home is above or below that depends on its size, age, lot, view and street, and none of these pages measures those things. The median is a starting point and no more.
Sources: Redfin and Realtor.com pages as cited. The $24,224, 1.6%, $95,000 and 6.7% figures are this brief's arithmetic. The explanation of the price per square foot is this brief's reasoning and not a finding. Commercial content; not independently verified.
Is Bellevue very competitive, warm or balanced?
The pages use five labels between them. Redfin says very competitive. Realtor.com says warm, because homes sold in a median of 45 days, and balanced for August 2026, because supply and demand are about the same. Its summary paragraph says that the median listing price signals strong demand at the upper end of the market, while the next paragraph says the 14.29% rise in days on market means buyers have more time and sellers need sharper pricing.
The numbers behind the labels are more consistent than the labels. Homes sold at 2.48% below the asking price on average in August, and the sale-to-list ratio is 98%. Redfin's ratio is 98.1%. Two sources, two methods, one figure. A home that sells for 98 cents on the asking dollar is not in a frenzy, and it is not in trouble either.
Redfin's Compete Score of 79 is high, and the page lists two nearby cities at 82 and 75. A score of 79 says that Bellevue is close to its neighbors, which means competition is a regional condition and not a Bellevue peculiarity. It does not say that the score has held; the page does not give the score for a year ago.
A seller can take a simple reading: the market is still active, it is slower than last year, and a well-priced home is still likely to sell near its ask. An overpriced home is likely to sit, because buyers now have more choice than they did a year ago.
Sources: Redfin and Realtor.com pages as cited. The reading of the labels is this brief's reasoning. Commercial content; not independently verified.
What do 747 listings and 441 sales add up to?
If the two counts are both right, 747 active listings against 441 monthly sales would be about 1.7 months of supply. Months of supply divides the homes for sale by the number that sell in a month. The listing count comes from Realtor.com and the sales count from Redfin, and they may not count the same homes, so this is a rough illustration and not a measurement.
The direction is clearer than the level. Realtor.com reports active listings up 29.21% on the year and up 158.84% over three years, which is a little more than two and a half times the count of three years ago. At the same time Redfin reports fewer sales than a year ago. More homes for sale and fewer sales is how supply builds up.
The same page also reports that listings moved by minus 1.47% on the month, which it describes as a slight tightening. A fall of 1.47% over a month and a rise of 29.21% over a year are not in conflict. The year is the larger signal.
Redfin says 30.5% of homes had a price drop, up 1.0 point on the year. Almost a third of homes that come to market in Bellevue are cut at some stage. A cut is a public mark on a listing. Buyers see the history, and a home with a cut is often read as one that is priced too high at the start.
Sources: Redfin and Realtor.com pages as cited. The 1.7 months and the factor of two and a half are this brief's arithmetic and illustrations. Commercial content; not independently verified.
Why does the Census value for Bellevue stop at $2 million?
The Census profile covers the postal area that includes Bellevue. It counts 39,897 people and 21,221 housing units, of which 19,515 are occupied and 1,706 vacant, a vacancy rate of 8.0%. Median household income is $182,545 and median gross rent is $2,803 a month.
Owners are in a minority. Owners occupy 7,113 homes (36.4% of those occupied) and renters occupy 12,402 (63.6%). The Census table does not say how many of the owned homes are houses and how many are condominiums, so the profile cannot tell a seller how many comparable homes there are. It does tell a seller that most of the occupied homes here are rented.
The median owner-estimated value is reported as $2,000,001. That is not a price. It is the highest value the table can show, and a median that lands on it means that at least half of the owners in the area estimated their home at $2 million or more. The Census figure therefore cannot be compared with the sale medians of $1.5 million, which describe all the home types sold in the city and not only owned houses in the postal area.
The homes are newer than in most of the markets in this series. The median year built is 2001. The two largest groups are 5,375 homes from the 2000s (25.3%) and 5,041 from the 2010s (23.8%), and together with the 496 built since 2020 they make 10,912 homes, or 51.4%. Only 5,993 homes, 28.2%, were built before 1980.
| Indicator | Value | Note |
|---|---|---|
| Population | 39,897 | Whole postal area |
| Housing units | 21,221 | All units |
| Built before 1980 | 5,993 | 28.2% of units |
| Built since 2000 | 10,912 | 51.4% of units |
| Owner occupied | 7,113 | 36.4% of occupied homes |
| Renter occupied | 12,402 | 63.6% of occupied homes |
| Median household income | $182,545 | Whole postal area |
| Median home value | $2,000,001 | Top code of the table |
Source: U.S. Census Bureau as cited. The 10,912 and 51.4% figures are this brief's arithmetic. The reading of the top code is this brief's explanation. Census figures cover the postal area, not the city.
What does the Seattle series say about the climate?
The Realtor.com series for the Seattle-Tacoma-Bellevue area shows the region and not the city, but its direction matches the Bellevue pages. The median days on market was 34 in April, 36 in May, 37 in June, 44 in July and 45 in August. That is a rise of 11 days, or 32%, in four months.
Active listings in the area (Realtor.com, active listings) went from 6,427 in February to 7,415 in March, 8,630 in April, 10,456 in May and 11,644 in June. The June count is 81% above the February count. Spring is the usual season for new listings, so some of the rise is seasonal, and the series here is not adjusted for season. New listings, however, peaked at 6,100 in May and fell to 5,814 in June and 5,326 in July, so the supply that remains is homes that did not sell, not a flood of new ones.
The count of listings with a price reduction (Realtor.com, price reduced listings) rose from 1,786 in February to 4,714 in June, a factor of 2.6. The median listing price for the area (Realtor.com, median listing price) was $780,000 in May, $783,250 in June, $775,000 in July, $750,000 in August and $749,970 in September, a fall of 3.8% from May. The Bellevue median listing price of $1,585,749 is more than twice the area figure, 2.1 times, a reminder that Bellevue is a high-priced pocket of a wider region.
For a seller the message is steady. The region is slower than in spring, supply is stocked with unsold homes, and price cuts are far more common than in winter. None of this fixes the price of one home, and the series makes no forecast. An owner who waits for spring to list may find the same pattern again: a burst of new homes, a slower pace once the summer buyers are gone and cuts by autumn. That is a pattern in the series, not a prediction, and a seller who prefers certainty can ask for a direct offer on a date of their own choosing. Readers comparing markets can also read the Kirkland brief and the Redmond brief.
Sources: Realtor.com series on FRED as cited, for the Seattle-Tacoma-Bellevue metropolitan area. The 32%, 81%, 2.6, 3.8% and 2.1 figures are this brief's arithmetic. Series are not seasonally adjusted. Commercial content; not independently verified.
What does a private sale change in a high-priced suburb?
On a home that sells near $1.5 million, each 1% of the price is $15,492. That is arithmetic, and it is not a claim about any commission or cost. It shows how quickly a percentage turns into dollars at this level, and why the net an owner keeps, and not the headline price, is the figure to compare.
A private sale offers five things that a public listing cannot. There is privacy, because there are no showings and no neighbors talking about you selling. The closing date can be flexible, which gives you time to find a new home. There are no commission costs. There are no closing costs. And there are no inspections or repairs for the buyer to ask for.
The last point matters in a market that is slowing. In a public sale, the weeks of showings are followed by an offer, and the offer is followed by an inspection and a request. When 30.5% of homes in the city have already had a price cut, a request from a buyer after the inspection is a second cut. A buyer who takes the home as it is does not ask.
Privacy matters for a different reason at this price. A listing is public and shows the price, the photographs and the days on market. A home that sits for six weeks shows a visible record that every later buyer can read. A private sale leaves no such record.
None of this means a private offer beats the market in every case. A very hot home in a hot week may draw several bids. The question for an owner is whether the chance of that outcome is worth the wait, the showings, the inspection and the public listing, against a clean sale on a date of the owner's choosing.
Source: this brief's arithmetic and reasoning. The 30.5% figure is from Redfin as cited. The benefits are those offered by Maison Off-Market. Commercial content; not independently verified.
Methodology and limitations
Prices, price per square foot, days on market, offers, sale-to-list ratio, price drops, Compete Score, listing counts and rents for Bellevue come from two commercial pages: a national brokerage and a national listing site. They measure different things and were not independently verified. A third commercial page was requested and returned a page for a different city, so it was not used.
Age, tenure, vacancy, income, rent and owner-estimated value come from the American Community Survey 2020-2024 five-year estimates for the postal-code area that includes Bellevue. Shares are calculated from published counts. The median value is at the top code of the table.
Days on market, active and new listings, median listing price and price reduced counts are Realtor.com series published by the Federal Reserve Bank of St. Louis for the Seattle-Tacoma-Bellevue metropolitan area. They describe the region and not the city. The brief makes no forecast and values no home.
Conclusion
The Bellevue record shows a wait of 16 days that doubled in a year and a wait of 45 days that rose about 14%, a sale median down about 5.8% or 2.1%, supply up 29% on the year and a region in which days on market, listings and price cuts have risen since spring.
It does not fix a price for any one home. The choice between a public listing and a private sale comes down to whether an owner would rather compete in that market or take privacy, a flexible closing date, no commission, no closing costs and no inspections or repairs. To see what a direct offer would look like for your home, use the contact form below or call 401-219-4207.
Frequently Asked Questions
What is the median home price in Bellevue?
Redfin reports $1,549,224 for the three months to July 2026, down 5.8%, and Realtor.com reports a median sold price of $1,525,000, down 2.09%.
How long do Bellevue homes take to sell?
Redfin says 16 days, up from 8, for homes that sold. Realtor.com says 45 days, which counts listings that are still for sale.
Is Bellevue a seller's market?
Redfin calls it very competitive, while Realtor.com calls it warm and balanced; sales are down 9.8% and listings are up 29% on the year.
Why does the Census value show $2,000,001?
It is the top code of the table, so at least half of owners estimated their home at $2 million or more.
Does a private sale always beat a public listing?
No. A public listing can attract competing bids. A private sale offers privacy, a flexible closing date, no commission, no closing costs and no inspections or repairs.
Compare your options before committing. Request a written private offer for your property, with no obligation, then weigh it against your listing plan.
Sources
- Redfin, 2026. Bellevue Housing Market Trends. https://www.redfin.com/city/1387/WA/Bellevue/housing-market.
- Realtor.com, 2026. Bellevue, WA Housing Market and Rental Trends. https://www.realtor.com/local/market/washington/king-county/bellevue.
- U.S. Census Bureau, 2026. American Community Survey 2020-2024 five-year estimates, the Bellevue area (via Census Reporter). https://censusreporter.org/profiles/86000US98004-98004/.
- Realtor.com, 2026. Housing Inventory: Median Days on Market in Seattle-Tacoma-Bellevue, WA (CBSA). https://fred.stlouisfed.org/series/MEDDAYONMAR42660.
- Realtor.com, 2026. Housing Inventory: Active Listing Count in Seattle-Tacoma-Bellevue, WA (CBSA). https://fred.stlouisfed.org/series/ACTLISCOU42660.
- Realtor.com, 2026. Housing Inventory: Price Reduced Count in Seattle-Tacoma-Bellevue, WA (CBSA). https://fred.stlouisfed.org/series/PRIREDCOU42660.
- Realtor.com, 2026. Housing Inventory: Median Listing Price in Seattle-Tacoma-Bellevue, WA (CBSA). https://fred.stlouisfed.org/series/MEDLISPRI42660.
Related research

Seller Guide · October 6, 2026
How to Prepare Point Pleasant Beach Rental Records Before Selling
Separate rental approval, income history and booked stays before comparing sale terms.

Seller Guide · October 6, 2026
How to Prepare Rumson Flood and Waterfront Records Before Selling
Separate flood disclosure, elevation, repairs and waterfront rights before comparing sale terms.

Seller Guide · October 6, 2026
How to Prepare Sarasota Condo Inspection and Reserve Records Before Selling
Separate building condition, reserve funding and resale documents before comparing sale terms.