Market Brief · by Aidan Sowa · October 5, 2026
Why Does Old Naples Trade as Separate Markets Divided by Price? Reading the Inventory Count, the Tier Split and the Naples Clock
Reading the Inventory Count, the Tier Split and the Naples Clock for Old Naples, FL, with each source dated and its limits noted, for owners weighing a listing against a direct sale.
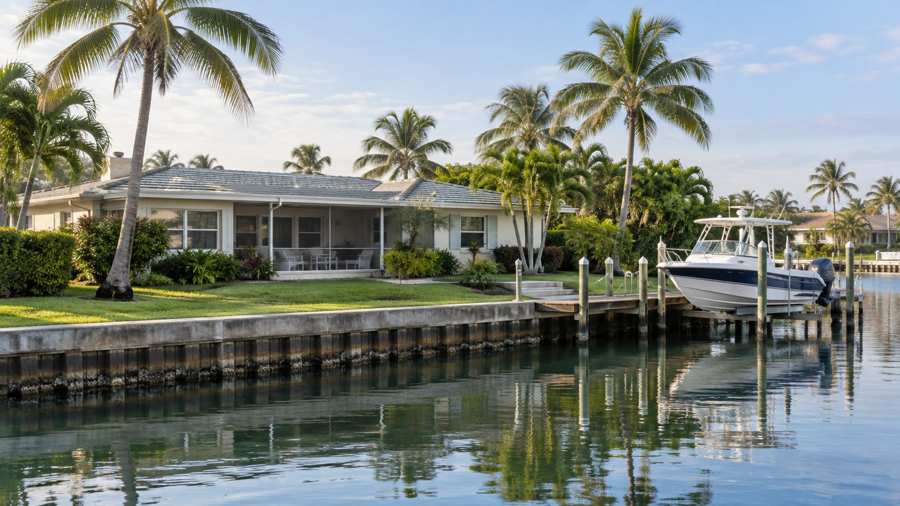
If you own a cottage a few blocks from the beach in Old Naples, the number you most often see quoted for your neighborhood may have nothing to do with your house. In May 2026, a local agent points out, the single-family median in the beach corridor jumped 71.6% in a year, from $2,681,250 to $4,600,000. The reason was not a boom. Only 43 single-family homes closed that month across the corridor, and a handful of large sales in Port Royal, Old Naples and Park Shore pulled the middle of the group upward (a Naples agent, August 2026).
This brief looks at what a seller can learn from numbers that thin. It covers the inventory counts and sale medians published for Old Naples itself, the way the market splits at about $5 million, and the Naples metropolitan listing series for days on market and new listings. It then asks what a private direct sale changes for an owner who does not want a long public listing.
The limits are stated up front. The district figures come from brokerage reports that draw on the local multiple listing service and were not re-pulled from it. The metropolitan series cover a county and every price level. And a market that closes a dozen single-family homes in a month cannot support a trend line, only a range.
Key Findings
- Active single-family listings in Old Naples fell from 108 in March 2025 to 73 in March 2026, while condominium listings slipped from 137 to 127, according to a Q1 2026 brokerage report (Bonnycastle Realty, April 2026).
- The same report puts the March 2026 median sale price at $2.34 million for all homes, $6.85 million for single-family homes and $1.24 million for condominiums, and counts 38 closed sales in the first quarter.
- A second brokerage newsletter reports a rolling 12-month average single-family sale price of $6,494,221 through March 2026, down 9.7% from a year earlier, with 61 single-family sales, up 60.5% (Matt Brown Real Estate, April 2026).
- Across Naples, the $1.5 million to $5 million tier had 7.7 months of supply and the $5 million-plus tier had 13.8, with days on market at 160 for the upper tier, for the 12 months through May 2026.
- The Naples-Marco Island metropolitan median listing took 106 days to sell in August 2026, up from 87 in April (Realtor.com, days on market).
How thin is the Old Naples sales record?
A Q1 2026 report from a Naples brokerage counts 38 closed sales in Old Naples in the first quarter, the same number as in the first quarter of 2025. January had 9, February 11 and March 18. Those totals include condominiums, which make up a large share of the district's homes, so the number of single-family sales is smaller still.
The report's price figures show how much a few sales can move the picture. The overall median sale price was $2.34 million in March 2026. For single-family homes alone it was $6.85 million, and for condominiums $1.24 million. The overall median is not a price anyone paid for a house. It sits between the two groups because the mix of what sold, in a given month, determines where the middle falls. The same report notes that January posted a median of $6.05 million and February only $2 million, and says that those swings reflect which properties closed, not instability.
A second newsletter, written by a luxury advisor, looks only at Old Naples single-family homes priced at $1 million or more over a rolling twelve months to March 2026. It counts 61 sales, up 60.5% from the prior twelve months, with an average sale price of $6,494,221, down 9.7%, and an average price per square foot of $1,743, down 28.4%. Both series are brokerage compilations from the Southwest Florida multiple listing service and were not checked against it here.
Put side by side, the two reports agree on the size of the market, a few dozen single-family sales in a year, and on the level of prices, in the high single-digit millions for a house. They differ in how they describe the trend, which is what one would expect when each uses a different window and a different group of homes. A seller reading either should ask what it would take for a single sale to change the number.
| Measure | Figure | Source and window |
|---|---|---|
| Closed sales, first quarter | 38 | Bonnycastle, Q1 2026 |
| Median sale price, all homes | $2.34 million | Bonnycastle, March 2026 |
| Median sale price, single-family | $6.85 million | Bonnycastle, March 2026 |
| Median sale price, condominiums | $1.24 million | Bonnycastle, March 2026 |
| Average single-family sale price | $6,494,221 | Matt Brown, 12 months to March 2026 |
| Single-family sales | 61 | Matt Brown, 12 months to March 2026 |
Source: Bonnycastle Realty, Olde Naples Real Estate Market Report Q1 2026; Matt Brown Real Estate, Old Naples Real Estate Market Report April 2026.
Is inventory falling, or just changing?
The Bonnycastle report counts 200 homes for sale in Old Naples in March 2026, 73 single-family and 127 condominiums. A year earlier the count was 245, made up of 108 single-family homes and 137 condominiums. Single-family listings therefore fell by 35 homes, or 32.4%, and condominium listings by 10, or 7.3%. The report calls the market balanced after the surge of 2025 and says that some owners who listed last year appear to be preparing more carefully for the next cycle instead of rushing to list.
The luxury advisor's newsletter gives a similar figure from a different cut. It counts 70 active single-family listings priced at or above $1 million, down 34.6% in a year, and reports 13.8 months of supply for that group. Months of supply is the number of months it would take to sell the current listings at the recent pace of sales. A common rule of thumb treats around six months as balanced, so 13.8 is high even after the drop in the number of listings.
The two statements can both be true. A falling count of listings with a high months-of-supply figure means that sales are slow relative to the stock, even though the stock has shrunk. For a seller, that means competition has eased somewhat, since there are fewer houses to compare against, but the buyer still has a long list to choose from. Fewer competing houses is helpful. A buyer who is in no hurry is not.
Neither report forecasts what comes next. The newsletter notes that pending sales rose 59% over the year, which hints that some of the listings are under contract and will leave the count. It does not say how many of those contracts will close, and a pending sale can fall through.
Source: Bonnycastle Realty, Olde Naples Real Estate Market Report Q1 2026; Matt Brown Real Estate, April 2026.
What happens on either side of $5 million?
The agent who explained the May median also splits the market in two. Using tier data from the Naples Area Board of Realtors for the twelve months through May 2026, published for the county and not for Old Naples alone, the $1.5 million to $5 million tier had 1,223 closings, up 26.5%, and 7.7 months of supply, down from 14.1. The $5 million-plus tier had 265 closings, up 17.3%, with 13.8 months of supply and days on market that climbed to 160.
A later report cited by the same agent, for June 2026, says sales between $1.5 million and $5 million rose 29.4% over a year, while sales above $5 million grew 11.5%. The gap between the tiers, in other words, has not closed. The agent argues that Old Naples straddles the two tiers more than most neighborhoods, with cottages and renovated bungalows between the beach and Ninth Street North trading in the lower tier, and the larger estates on Gulf Shore Boulevard South, Gordon Drive and the historic Lake Drive lots trading above $5 million.
The implication is that one blended median for Old Naples averages two markets that behave differently. A cottage owner is in the faster tier, where the supply of homes has almost halved in a year. An estate owner is in the slower one, where homes wait an average of 160 days and a buyer may compare several options. The same street can hold both.
A seller should therefore ask which tier a house belongs to before looking at any figure, and should treat statistics for the other tier as background. The tier data are county-wide, so they are a guide, not a measurement of Old Naples.
Source: a Naples agent's August 2026 article citing Naples Area Board of Realtors tier data for the 12 months through May 2026 and its June 2026 report.
What do the Naples listing series say about timing?
The Realtor.com series for the Naples-Marco Island metropolitan area cover the whole county and every price level, so they describe the speed of the typical listing and not a house in Old Naples. The median days on market was 87 in April 2026, 95 in May, 102 in June, 104 in July and 106 in August. The August figure is 19 days, or 21.8%, above April, and every month was longer than the last.
New listings moved the other way. The metropolitan area added 1,196 in April, 976 in May, 814 in June, 848 in July and 808 in August. August is 32.4% below April (Realtor.com, new listings). Seasonal patterns explain part of that drop, since fewer owners list in the summer. The seasonal pattern does not explain the longer waits on its own, because a quiet season should leave buyers fewer homes to consider and so shorten the wait.
Fewer new listings and longer times to sell together describe a market where owners are choosing not to list in the heat of summer, and where buyers who are in the market are taking their time. The agent quoted above suggests a different reading of seasonality, namely that off-season buyers are often more motivated, which is a claim about behavior that the data here cannot test.
The series for active listings and listing prices were not available for Naples in the open data used, so this brief does not report them.
Source: Realtor.com via FRED, Housing Inventory: Median Days on Market and New Listing Count, Naples-Marco Island, FL (CBSA).
How does the condominium side of Old Naples differ?
Old Naples is not only houses. In March 2026 the Bonnycastle report counted 127 condominiums for sale against 73 single-family homes, so condominiums were the larger share of what a buyer could choose from. Their median sale price that month was $1.24 million, less than a fifth of the $6.85 million single-family median. A reader who sees a single Old Naples median of $2.34 million is looking at a number that falls between the two groups and describes neither.
The luxury advisor's newsletter points the same way. It reports that condominium sales priced above $1 million fell 27.6% over its twelve-month window, with an average price per square foot of $1,035, down 11.2%, while single-family sales rose 60.5% and their price per square foot fell 28.4% to $1,743. The two groups moved in opposite directions on sales and both softened on price per square foot. That is a mixed picture, and a seller of one type should not read the other type's numbers as their own.
The same newsletter notes a development that sits just over the northern edge of the district, a resort with branded residences that is opening in phases and that the author says has already had an effect on the market. It does not give the size of the effect, and this brief does not try to. The point for an owner is that new supply nearby, at the top of the price range, gives buyers another option to compare against an older house.
For a single-family owner in the district, the practical lesson is that the buyer pool is not shopping only against other cottages. It is also looking at condominiums, new construction and houses in neighboring districts. A fair price comes from comparing against all of these and not from the district average.
What does a private sale change for an Old Naples owner?
The question for a cottage owner in the faster tier is not whether the house will sell. It is how much of the owner's time, privacy and certainty a public sale will cost. A listing means showings, a sign and a number that every neighbor can look up. It also means a buyer's inspection and the repair requests that follow, on a house that, in this district, is likely to be fifty years old or more. A direct private sale to a buyer such as Maison Off-Market changes each of those, and the differences are the five benefits that owners most often value.
The first is privacy, with no showings and no neighbors talking about you selling, which matters in a district where an open house is a neighborhood event. The second is a flexible closing date, giving the owner time to find the next home. The third is no commission, the fourth is no closing costs, and the fifth is avoiding inspections and repairs, so the house is bought as it stands.
The first of those can be sized with arithmetic and no assumption about a rate. Each 1% of the $2.34 million overall median in the Bonnycastle report is $23,400. Each 1% of the $6.85 million single-family median is $68,500. A commission at any ordinary rate is a multiple of those amounts. These are round-number illustrations and are not a quote or an offer.
The tradeoff is real. A well-presented cottage in the fast tier can attract competing offers, and a public listing might reach a higher price than a single private bid. An owner who values certainty and a quiet exit over that possibility has a reason to ask for a private offer first. An owner of a larger estate in the slower tier, who might otherwise wait months, has a different reason to ask.
What can an owner learn from the Naples Beach Club and new supply nearby?
The luxury advisor's April 2026 newsletter says that a Four Seasons resort and residences just over the northern edge of Old Naples has already made an impact on the market and will continue to as it opens in phases. It gives the figure of 339 closings in the Naples beachfront corridor in the first four months of 2026, worth $1.23 billion, against 246 in the same period a year earlier, and calls it the most active start to a year since 2021, when there were 624 closings worth $1.64 billion.
Those corridor figures take in Port Royal, Aqualane Shores, Old Naples, Coquina Sands, the Moorings and Park Shore, so they are not an Old Naples number. They suggest that a great deal was happening in the beachfront market in early 2026, and they stand in contrast to the slow wait for estate sales reported later in the year. The two can both be true, since activity was concentrated in the lower of the two price tiers.
For an Old Naples owner, the information is context and not a price. New supply close by gives a buyer a new option, and a busy spring tells a seller that the market was open. It does not say that the autumn will be the same, and the metropolitan data show a longer wait by August. Readers comparing markets can also read the Sunset Park brief and the Port Royal brief.
What should an owner ask before accepting any offer?
Whichever route an owner takes, four questions make offers comparable. What is the price, and how much of it arrives at closing after any costs the owner would pay? When will the money arrive, and is the date firm? What conditions let the buyer walk away, such as financing, an inspection or the sale of another property? And what does the buyer expect the owner to repair, remove or leave behind?
A written answer to each question lets the owner compare a public offer with a private one on the same terms. In a market where a few sales set the headline numbers, the answers are more reliable than any average, and they are the only numbers that apply to the owner's own house.
One last practical point is that the thin market makes timing matter less than it seems. A house that lists in the winter season may attract a different group of buyers than one that lists in the summer, but the data here cannot say which group pays more. An owner who has no deadline can afford to wait. An owner with a deadline, such as a purchase elsewhere, should weigh the chance of a higher price against the risk that a long listing runs past the date.
Methodology and limitations
The Old Naples sales and inventory figures are quoted from two brokerage reports, one published in April 2026 and one last modified in June 2026, which compile data from the local multiple listing service. The tier figures are from the Naples Area Board of Realtors as cited by a third brokerage's August 2026 article and are county-wide. All three are marketing content by firms that earn fees from sales and were not independently verified. Percentage changes are those reported by the sources or calculated from their published counts.
Days on market and new listings are Realtor.com series published through the Federal Reserve Bank of St. Louis for the Naples-Marco Island metropolitan area, which is larger than Old Naples. Active-listing and median-listing-price series were not available in the open data used. Months of supply is as defined in the sources.
This brief makes no forecast and does not estimate what any particular house would sell for.
Conclusion
For an owner in Old Naples, the public record supports a short list of conclusions. The district records only a few dozen single-family sales a year, medians swing with the mix of homes that close, the market splits into a faster tier below about $5 million and a slower one above it, and the Naples metropolitan market has been taking longer to sell each month since April.
It does not support a price for any one house, and it does not support a forecast. The choice between a public listing and a private sale comes down to how much an owner values a possible higher price against privacy, a flexible closing date, no commission, no closing costs and no inspections or repairs.
Frequently Asked Questions
Why does the Old Naples median change so much from month to month?
Very few single-family homes close in a month, so a few large sales can move the middle of the group a long way.
What does months of supply mean?
It is the number of months it would take to sell all current listings at the recent pace of sales. Around six months is often treated as balanced.
Do the tier figures describe Old Naples alone?
No. They cover all of Naples and are used here as a guide to how the market splits.
Why are there no listing-price figures for the metro area?
The Realtor.com series for Naples were not available in the open data used, and the brief does not estimate them.
Does a private sale always beat a public listing?
No. A public listing can attract competing bids and sometimes a higher price. A private sale offers privacy, a flexible closing date, no commission, no closing costs and no inspections or repairs, in exchange for a single offer.
Compare your options before committing. Request a written private offer for your property, with no obligation, then weigh it against your listing plan.
Sources
- Naples agent (Heather Hobrock), 2026. Old Naples Home Prices Market Data: What to Watch Now. https://heatherhobrock.com/blog/the-old-naples-median-price-everyones-quoting-is-hiding-the-real-story.
- Bonnycastle Realty, 2026. Olde Naples Real Estate Market Report: Q1 2026. https://bonnycastle.com/market-reports/olde-naples-real-estate-market-q1-2026.
- Matt Brown Real Estate, 2026. Old Naples Real Estate Market Report: April 2026. https://www.mattbrownrealestate.com/blog/old-naples-real-estate-newsletter-april-2026/.
- Realtor.com, 2026. Housing Inventory: Median Days on Market in Naples-Immokalee-Marco Island, FL (CBSA). https://fred.stlouisfed.org/series/MEDDAYONMAR34940.
- Realtor.com, 2026. Housing Inventory: New Listing Count in Naples-Immokalee-Marco Island, FL (CBSA). https://fred.stlouisfed.org/series/NEWLISCOU34940.
Related research

Seller Guide · October 6, 2026
How to Prepare Point Pleasant Beach Rental Records Before Selling
Separate rental approval, income history and booked stays before comparing sale terms.

Seller Guide · October 6, 2026
How to Prepare Rumson Flood and Waterfront Records Before Selling
Separate flood disclosure, elevation, repairs and waterfront rights before comparing sale terms.

Seller Guide · October 6, 2026
How to Prepare Sarasota Condo Inspection and Reserve Records Before Selling
Separate building condition, reserve funding and resale documents before comparing sale terms.