Market Brief · by Aidan Sowa · October 5, 2026
Why Do Pinecrest Data Pages Disagree by So Much? Reading the Share of Price Cuts and the Price Range
Reading the Share of Price Cuts and the Price Range for North Pinecrest, FL, with each source dated and its limits noted, for owners weighing a listing against a direct sale.
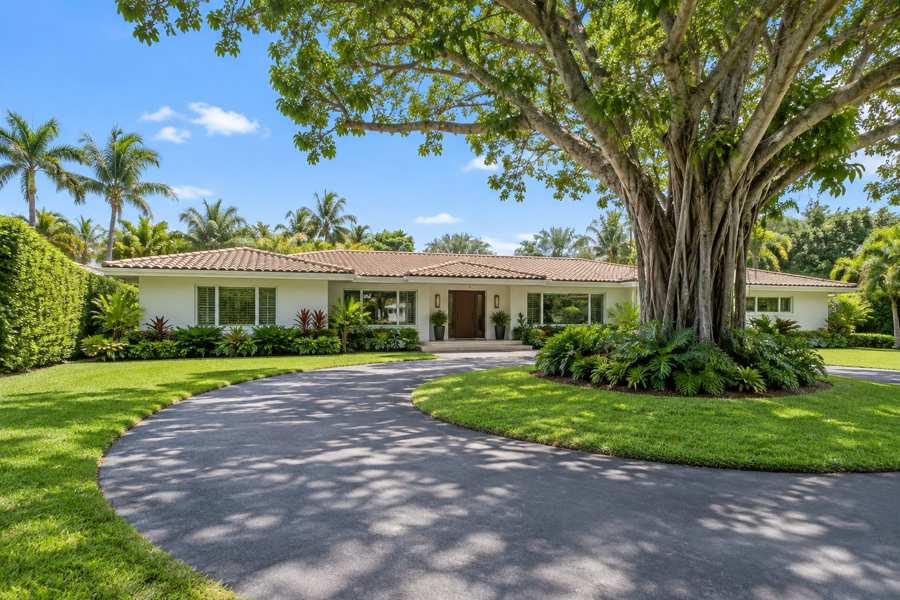
Two data pages describe the same set of houses in the same month and arrive at very different pictures. One counts 108 houses for sale and a median wait of 118 days. The other counts 30 active listings and a median of 24 days. One says the median closed sale is about $2.7 million. The other says $1.82 million. An owner in North Pinecrest reading both would be right to ask which one to believe.
The answer is neither alone, and the difference is the story. The pages use different sources, different windows and different definitions of what counts as a listing, a sale and a day. When two honest pages disagree by hundreds of thousands of dollars, the disagreement itself says that the market has a very wide spread, with a few very large sales at the top and many smaller ones below. One page puts the middle half of recent sales between $435,000 and $4,125,000, a span of almost $3.7 million.
This brief reads the two pages, a price-cut press kit and the Census profile of the postal area that includes North Pinecrest. It sets them beside the Miami metropolitan listing series. It does not price any house. The sales pages are brokerage and data-vendor content, and the brief labels them as such.
Key Findings
- A brokerage press kit dated October 2, 2026 found that 40 of the 108 Pinecrest houses for sale (37%) were asking less than their original list price, by a median 6.4% (about $376,000), against 40.1% across Miami-Dade County (PBP Real Estate, October 2026).
- The same kit reports a median of 118 days on market for active houses, with 59.3% (64 of 108) listed more than 90 days.
- A data page snapshot of September 7, 2026 tracked 30 active listings and 26 pending sales in the postal area, a median asking price of $1,100,000, and a median closed sale of $1,820,000 on 316 sales over six months, with the middle half between $435,000 and $4,125,000 (Resideline, September 2026).
- In the Census postal area, 8,923 of 12,113 occupied homes (73.7%) are owner-occupied and 1,056 of 13,169 units (8.0%) have no usual resident (U.S. Census Bureau, 2020-2024).
- The Miami-Fort Lauderdale-West Palm Beach metropolitan median days on market rose from 74 in March 2026 to 85 in July (Realtor.com, days on market).
Why would two pages count the same market so differently?
The first reason is the time window. The Resideline page is a snapshot dated September 7, 2026 and uses a closed-sale window of the last six months. The PBP kit is a snapshot of October 2, 2026 and counts listings from a single MLS feed on that day. A month apart, in a market of this size, listings come and go.
The second reason is definition. The PBP kit says plainly that it separates houses from condominiums and townhouses and never combines them, and its 108 count is houses only. Resideline reports on a postal area, and the page text used here does not state a houses-only basis, so its median asking price of $1,100,000 is far below the houses-only figures from the other source. A median that mixes condominiums, which sell for a fraction of the price of a Pinecrest house, with houses will sit well below a houses-only median.
The third reason is what counts as active. Resideline reports 30 active listings and 26 pending. PBP reports 108 houses for sale and 27 under contract. The pending counts are close, 26 against 27, which suggests that both pages see the same flow of deals. The active counts are not close, and the pages do not explain why. A difference of that size is more likely to come from the definition of active, for example listings in different statuses, than from a month of change.
None of this means that one page is wrong. It means an owner should read each page for what it says it measures, and should be wary of any single figure quoted without its definition. The median closed sale of $1,820,000 describes a mix that includes the cheaper end of the market. The median asking price for houses alone on the PBP page is not published in the material used here, so the brief does not quote one.
Source: Resideline, September 7, 2026; PBP Real Estate, October 2, 2026. Data-vendor and brokerage content, not independently verified.
What does a $435,000 to $4,125,000 middle range tell an owner?
Resideline reports that the middle half of the 316 closed sales it tracked ranged from $435,000 to $4,125,000. The middle half is the span between the 25th and the 75th percentile, so a quarter of sales closed below $435,000 and a quarter above $4,125,000. That is a spread of $3,690,000 between the two edges, and it is wider than the median itself.
A spread like that has two causes. The first is the mix of property types: condominiums and townhouses sell far below houses, and the postal area has a few of them. The second is the mix of houses: a small older house on a typical lot and a new estate on a large one are in the same market and sell for very different prices. Together they put the market on a wide band, not at a point.
For a seller, the lesson is that the median says little about a particular house. A house in the lower half of the band should not expect the median, and a house in the upper quarter will not be compared with it. The question to ask is where a house falls within the band, which depends on the lot, the condition and the buyer who wants it.
The same data page calls the market a seller's market by its own yardstick, a ratio of pending to active listings of 0.87, which it says is above a 0.6 threshold. That ratio rests on the page's count of 30 active listings, a number the other source does not share. A seller reading a headline of a hot market should check the definition before taking comfort in it.
Source: Resideline, September 7, 2026. Percentile range and ratio as the page defines them; not independently verified.
What do 37 percent price cuts and 118 days say about sellers?
The PBP kit measures a specific thing: of 108 Pinecrest houses for sale on October 2, 2026, 40 had a current asking price below the original list price. That is 37%, and the median reduction among those 40 is 6.4%, which the kit puts at about $376,000. The remaining 68 are not necessarily at full price; the kit counts 63 unchanged and 5 above original. County-wide, the share of houses asking below original is 40.1%, so Pinecrest sits a little under the county.
The kit is careful about what it does not claim. A below-original ask compares two recorded prices at one moment. It is not a price history, and it does not show how many times a listing was cut or whether it was relisted. The median reduction of 6.4% is among the 40 that cut, not all 108.
The clock is the other half. The kit reports a median of 118 days for active houses, in both of the two recorded fields, and 59.3% of houses (64 of 108) with more than 90 days listed. In the same month, the PBP statistics page reported that houses that sold had taken a median 98 days to go under contract. A house that is for sale is, on the whole, waiting longer than the house that sold.
That is how selection works in any market. The houses that sell quickly leave the list, and the ones that stay are the ones that were priced too high or that appeal to fewer buyers. A seller whose house has been listed for three months is looking at a group of houses that have been through the same wait. Cutting the price by a median of 6.4% is what the kit shows many of them doing.
A last point on the clock: the PBP kit notes that equal medians in its two recorded day-count fields describe the recorded fields only and do not establish anything about individual listing histories, and that it found no sign of relisting in its data. That caution applies to every reader. A house that shows 118 days may have been on the market for longer under an earlier listing, or may have been withdrawn and returned. Owners comparing their own house to the median should ask the agent for the full history, because buyers can often see it, and a long history shapes what they offer. A private buyer does not look at that history in the same way, because the house was never listed, and there is no clock to read.
Source: PBP Real Estate press kit, October 2, 2026; PBP Real Estate statistics page, October 4, 2026. Brokerage content, not independently verified.
Who lives in the postal area, and what does that say about the buyers?
The postal area has 33,628 people in 12,113 occupied homes, or about 2.8 people per household. Median household income is $137,076. Owners live in 8,923 homes (73.7%) and renters in 3,190 (26.3%). Median gross rent is $1,951 a month, $23,412 a year, which is 17.1% of median income. Only 1,056 homes, 8.0%, have no usual resident.
A market with few second homes and a high owner share is a market of people who plan to stay. They buy for the schools, the lot and the quiet, and they look at a house as the place where they will live for years. That is a patient buyer, who will inspect, negotiate and wait for the right house.
Owners estimate the median home at $1,120,100, with a margin of error of $60,881, or 5.4%. The Resideline median asking price of $1,100,000 is close to that, which may be a coincidence of mixing property types. The houses-only medians on the PBP page are more than twice that. Whether owners underestimate their homes or whether the surveyed area mixes in cheaper units, the two figures differ by a margin that no seller should ignore.
The age of the stock is the last piece. Of 13,169 homes, 8,316 (63.1%) were built before 1980, and the median year built is 1973. Homes of that age may need work, and a buyer who inspects will say so. A seller of an older house in a market with a 118-day wait and 6.4% cuts should expect the inspection to be part of the negotiation.
| Indicator | Value | Note |
|---|---|---|
| Population | 33,628 | Whole postal area |
| Occupied homes | 12,113 | Of 13,169 units |
| Owner-occupied homes | 8,923 | 73.7% of occupied |
| Renter-occupied homes | 3,190 | 26.3% of occupied |
| No usual resident | 1,056 | 8.0% of all units |
| Median household income | $137,076 | Estimate |
| Median gross rent | $1,951 | Monthly |
| Owner-estimated median value | $1,120,100 | Margin of error $60,881 |
Source: U.S. Census Bureau, American Community Survey 2020-2024 five-year estimates, tables B01003, B19013, B25002, B25003, B25034, B25064 and B25077.
What does the Miami clock say?
Realtor.com publishes listing series for the Miami-Fort Lauderdale-West Palm Beach metropolitan area through the Federal Reserve Bank of St. Louis. They show direction, not the level for North Pinecrest. The median days on market was 74 in March 2026, 77 in April, 79 in May, 82 in June and 85 in July. Active listings fell from 43,929 in May to 40,908 in August and ended September at 41,277 (Realtor.com, active listings).
The median listing price slipped from $499,000 in May to $490,000 in September (Realtor.com, median listing price). Listings with a price reduction fell from 10,942 in March to 8,810 in July (Realtor.com, price reduced listings), a count that fell along with the number of listings and is not a share.
Set the metropolitan 85 days against the local readings. The PBP kit has active houses at 118 days, the statistics page has sold houses at 98 days to contract, and the Resideline page has the median active listing at 24 days. Three local numbers span a factor of five. The 24 days is the outlier, and it probably reflects the page counting only recent listings as active.
The direction is the safest reading. The metropolitan clock lengthened by 11 days from March to July, and the metropolitan price slipped. The local data say that sellers are cutting by about 6.4% where they cut, and that a majority of the houses on the market have waited more than three months.
Source: Realtor.com via FRED, Miami-Fort Lauderdale-West Palm Beach, FL (CBSA); PBP Real Estate; Resideline.
How should an owner read any data page about a luxury market?
A few habits make the difference between using a page and being used by it. The first is to look for the definition behind every number. A median asking price is not a median sale price, a median over six months is not a median over twelve, and a count of active listings depends on which statuses a page treats as active. When a page does not say, treat the figure as a rough mood and not a measure.
The second habit is to look for the count behind every median. The PBP statistics page states that the September median house sale was based on 15 sales, and that fewer than five condominium sales closed in the month, so it widens the window. A median built on fifteen sales can move by hundreds of thousands of dollars if two large sales land on the other side of it. The twelve-month figure of 203 sales is steadier and more useful for a decision.
The third habit is to separate the mix from the movement. A median that falls may mean that prices fell, or it may mean that more small houses sold that month and fewer large ones. In a market with a spread as wide as the one described here, mix changes dominate. A seller who sees a headline that the median dropped 12% should ask what sold, not just what the number did.
The fourth is to treat vendor and brokerage pages as what they are. They are often careful, as the PBP kit is about the limits of a below-original comparison, and they are also written to attract sellers and buyers. A page that tells an owner this is a seller's market is making a case, and a page that tells an owner that the market is slowing is making a different case. The numbers are worth reading. The conclusion at the end is the part to weigh.
The fifth is to use the figures as a bracket and then price from comparable sales. A house with a similar lot, a similar age and a similar condition that sold in the last six months is worth more as evidence than any median. An owner who asks a buyer to show comparable sales is asking for the right thing, and an owner who has a private offer should ask the same question about how the number was built.
The last habit is to keep the owner's own goal in view. Some owners care most about the highest possible price and are willing to wait, accept showings and fund repairs to get it. Others care most about privacy, a date they set and an end to the process. The data pages do not tell an owner which goal is right. They only show what the market has been doing, and the choice between a public sale and a private one belongs to the seller. Readers comparing markets can also read the Pinecrest brief and the Southside Village brief.
Source: this section is analysis of the figures and statements in the pages cited above.
What would a private sale change for a seller who is waiting?
A direct sale to a buyer who purchases homes off the market changes five things. There are no showings and no neighbors talking about you selling. The closing date can be flexible, giving time to find a new home. There are no commission costs and no closing costs for the seller. And there are no inspections or repairs. For a seller who has watched a house sit for 118 days, the first and the last matter most: the house is not shown, and the inspection never happens.
The fee benefit needs no assumed rate. For every 1% of a sale price that would otherwise go to fees, a sale at $1,100,000 keeps $11,000, a sale at $1,820,000 keeps $18,200 and a sale at $2,725,000 keeps $27,250. A median price cut of 6.4% on a $2,725,000 ask is $174,400, which is a figure the owner can compare to the cost of waiting.
The trade-off is the usual one. A public listing can attract competing bids, and in a market where a quarter of sales close above $4,125,000, some houses do very well. A private sale offers one buyer, one number and a date the seller sets. It will not tell the seller what the most motivated buyer would pay, and it will not take months.
An owner should keep two numbers side by side: what a private offer nets after no commission and no closing costs, and what a public sale might net after commissions, closing costs, credits for repairs and the likely cut. The comparison is arithmetic, and the seller decides.
Source: calculation from stated prices and the stated 6.4% median reduction; no commission rate, closing cost or repair cost is assumed.
Methodology and limitations
Tenure, vacancy, income, rent, population, age of housing and owner-estimated value come from the American Community Survey 2020-2024 five-year estimates for the postal-code area that includes North Pinecrest. The area is wider than the neighborhood. Shares are calculated from published counts, and owner-estimated value carries a stated margin of error.
Days on market, active listings, median listing price and price reduced counts are Realtor.com series published by the Federal Reserve Bank of St. Louis for the Miami-Fort Lauderdale-West Palm Beach metropolitan area. The price-reduced series ends in July 2026 and the others in September 2026. Listing prices are asking prices and not sale prices.
The local price-cut, clock and sales figures come from a brokerage press kit and a data page. They use different windows and definitions and were not independently verified. The brief makes no forecast and does not estimate what any particular home would sell for.
Conclusion
The public record supports a short list for a North Pinecrest owner. Two data pages describe the same market with very different numbers, 37% of houses have cut their price by a median 6.4%, the median active house has waited 118 days, and the middle half of recent sales spans almost $3.7 million.
It does not support a price for any one home. The choice between a public listing and a private sale comes down to how much an owner values a possibly higher bid against privacy, a flexible closing date, no commission, no closing costs and no inspections or repairs.
Frequently Asked Questions
Why do two data pages show different medians?
They use different sources, windows and definitions of listings and sales, and one separates houses from condominiums.
How many Pinecrest houses have cut their price?
A brokerage press kit counted 40 of 108 on October 2, 2026, or 37%, with a median reduction of 6.4%.
How long do active houses wait?
The same kit reports a median of 118 days for active houses.
Does the Miami metropolitan data describe North Pinecrest?
No. It covers a three-county area and shows direction only.
Does a private sale always beat a public listing?
No. A public listing can attract competing bids. A private sale offers privacy, a flexible closing date, no commission, no closing costs and no inspections or repairs, in exchange for a single offer.
Compare your options before committing. Request a written private offer for your property, with no obligation, then weigh it against your listing plan.
Sources
- PBP Real Estate, 2026. Pinecrest asking-price reductions and recorded days on market (press kit). https://www.pbprealestate.com/press/pinecrest/pbp-pinecrest-price-cuts-press-kit-ba5e38ace566e-2026-10-02.pdf.
- Resideline, 2026. Pinecrest Housing Market 2026 (postal area page). https://resideline.com/market/33156/.
- U.S. Census Bureau, 2026. American Community Survey 2020-2024 five-year estimates, the North Pinecrest area (via Census Reporter). https://censusreporter.org/profiles/86000US33156-33156/.
- Realtor.com, 2026. Housing Inventory: Median Days on Market in Miami-Fort Lauderdale-West Palm Beach, FL (CBSA). https://fred.stlouisfed.org/series/MEDDAYONMAR33100.
- Realtor.com, 2026. Housing Inventory: Active Listing Count in Miami-Fort Lauderdale-West Palm Beach, FL (CBSA). https://fred.stlouisfed.org/series/ACTLISCOU33100.
- Realtor.com, 2026. Housing Inventory: Median Listing Price in Miami-Fort Lauderdale-West Palm Beach, FL (CBSA). https://fred.stlouisfed.org/series/MEDLISPRI33100.
- Realtor.com, 2026. Housing Inventory: Price Reduced Count in Miami-Fort Lauderdale-West Palm Beach, FL (CBSA). https://fred.stlouisfed.org/series/PRIREDCOU33100.
Related research

Seller Guide · October 6, 2026
How to Prepare Point Pleasant Beach Rental Records Before Selling
Separate rental approval, income history and booked stays before comparing sale terms.

Seller Guide · October 6, 2026
How to Prepare Rumson Flood and Waterfront Records Before Selling
Separate flood disclosure, elevation, repairs and waterfront rights before comparing sale terms.

Seller Guide · October 6, 2026
How to Prepare Sarasota Condo Inspection and Reserve Records Before Selling
Separate building condition, reserve funding and resale documents before comparing sale terms.