Market Brief · by Aidan Sowa · October 5, 2026
Is Kierland Really a Tight Market? Reading the One-Sale Price Bands, the Condo Shelf and the Older Stock
Reading the One-Sale Price Bands, the Condo Shelf and the Older Stock for Kierland, AZ, with each source dated and its limits noted, for owners weighing a listing against a direct sale.
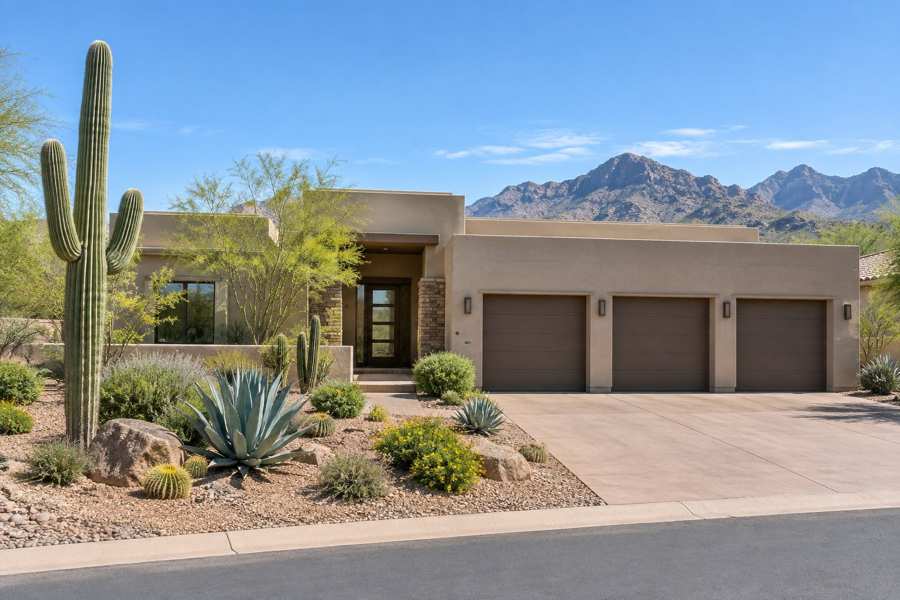
A homeowner near Kierland who opens a market report in the fall of 2026 sees a clear headline. An absorption report for the area, last updated on August 31, says it has 1.1 months of inventory across all segments, and that conditions favor sellers: demand is outpacing supply, homes tend to sell quickly and prices are likely holding or rising. Under three months of supply, the report explains, is high demand and low inventory.
Then the owner scrolls to the tables. A price band of $900,000 to $950,000 for houses shows no active listings and one sale in the last six months. So do the bands at $1.1 million, $1.4 million and $1.5 million. Townhouses show the same, one sale per band. And one condo band, at $600,000 to $650,000, shows six months of inventory, which the report calls the coolest segment. The headline and the tables describe the same place and say different things.
This brief reads both. It sets the report beside the Census profile of the postal area that includes Kierland, whose housing was built mostly in the 1970s, 1980s and 1990s, and the Phoenix metropolitan listing series from Realtor.com. The limits are plain: the report is a brokerage tool, the Census figures describe a postal area wider than Kierland, and the metropolitan series cover the whole Phoenix area. Nothing here prices a house.
Key Findings
- The absorption report, updated August 31, 2026, shows 1.1 months of inventory across all segments for Kierland, a condo overview of 2.4 months, and a condo band at $600,000 to $650,000 with six months of inventory (Homes by Marco, 2026).
- In the report's house table, four price bands show one sale each in six months and no active listings, each with an absorption rate of 0.2 a month; the townhouse table shows two bands in the same position.
- In the Census postal area, 7,334 of 21,914 housing units (33.5%) were built in the 1980s, and 72.0% of occupied homes are owner-occupied (U.S. Census Bureau, 2020-2024).
- The Phoenix metropolitan median days on market rose from 60 in May 2026 to 67 in July and August and eased to 62 in September (Realtor.com, days on market).
- Listings with a price reduction in the Phoenix metropolitan area fell from 10,902 in March to 8,348 in July (Realtor.com, price reduced listings).
How does an absorption report get to 1.1 months?
The report explains its own method. Months of inventory is the number of homes available divided by the rate at which they sell, and the rate comes from sales in the last six months. A band with one sale in six months has an absorption rate of about 0.17 a month, which the report rounds to 0.2. If there is one home available in that band, the months of inventory is about six. If there are none available, the months of inventory is zero, and the report prints a seller's market label next to it.
That arithmetic is correct and also fragile. A band with no active listings and one sale shows zero months of supply, which looks like a shortage. It is also a band in which only one buyer bought in half a year. The same sale can make a market look tight or thin depending on whether any listing happens to be on the shelf the day the report is built.
The report's own tables show how this works. For houses, the bands at $900,000 to $950,000, $1.1 million to $1.2 million, $1.4 million to $1.5 million and $1.5 million to $1.6 million each have one sale and no active listing. For townhouses, the bands at $750,000 to $800,000 and $1 million to $1.1 million are in the same position. Add them up and the report shows six sales across six bands in half a year, one a month in all, which is the pace the 1.1 months rests on.
A small worked example shows how much one sale matters. Suppose the six bands above had held a total of 12 sales in six months instead of 6. The monthly rate would be 2 instead of 1, and every months-of-inventory figure would halve. Now suppose a seller lists a house in a band that has seen one sale. If the buyer for that sale was the only one that season, the list price is a guess about a buyer who has not yet appeared. The report cannot see that buyer, and neither can the seller.
The report also carries a plain legend for how to read the label. Under three months is high demand and low inventory, three to six months is balanced, and over six months favors buyers. Notice that the condo band at exactly six months sits on the line between balanced and buyer-favoring, and that the 2.4 months for condominiums as a group and the 1.1 months for the area as a whole sit on the seller side. The labels are real, but they flip with one sale or one new listing.
None of this makes the headline false. It means the headline is a fact about a small number of transactions. An owner who reads that Kierland has 1.1 months of supply should read it as, roughly, that the few homes that are listed in the area sell, not that every home sells fast.
Source: Homes by Marco, absorption report updated August 31, 2026. The explanation of method restates the report's definitions; the sale counts are the report's and were not independently verified.
What is the condo shelf telling an owner?
The condo table is where the report cools. It lists a band at $600,000 to $650,000 with an absorption rate of 0.2 and six months of inventory, and names it the coolest segment, with buyers having more time and negotiating power. It lists the band above, at $650,000 to $700,000, as the most active, with no active listings and two sales in the last six months. The overall condo overview reads 2.4 months of inventory.
The report lists the specific addresses in each band, which is unusual for a market report. That makes the sample visible. Six sales across six price bands in houses and townhouses means that each band can be traced to a single address, and a seller on the same street can look up what it sold for. The practical value of that visibility is that an owner can test the headline against the real comparable, which is the single closing that sits in the owner's own band.
Two neighboring bands $50,000 apart behave in opposite ways. At $650,000 to $700,000, two buyers bought and nothing is left. At $600,000 to $650,000, one buyer bought and a listing is still waiting. The simplest reading is that buyers in the area were willing to pay for a better unit and not for a cheaper one, and that a condominium that is listed below the stronger band without a reason can sit.
There is a second reading of the shelf, which is that it reflects the unit and not the band. A listing that has been available for months in a band may have an association fee, a floor or a view that buyers dislike, and the band inherits the blame. An owner reading the report should ask whether the unit on the shelf is like theirs. If it is a different floor plan, the six months say little. If it is the same floor plan and the same building, the six months are a warning.
A seller of a condominium can use the shelf. If the unit is at the edge of two bands, the choice of list price decides which band it joins. A price of $649,000 puts it on a shelf with six months of supply. A price of $675,000 puts it with the band where buyers have been active. This is not advice to price higher. It shows that a $50,000 move at a band boundary can matter more than a $50,000 move in the middle of a band.
A direct buyer who purchases homes off the market does not read a band. The buyer looks at the unit, its association fees and its condition, and quotes a price. For an owner who does not want to wait out a six-month shelf, that is a different way to choose a number.
Source: Homes by Marco, absorption report updated August 31, 2026. Not independently verified.
What does a 1980s postal area look like?
The Census profile shows a stock that was built in one long wave. Of 21,914 housing units in the postal area, 7,334 were built in the 1980s, which is 33.5%, and 5,420 in the 1970s (24.7%) and 5,044 in the 1990s (23.0%). Together those three decades account for 17,798 units, or 81.2% of the stock. The median year built is 1986. Since 2020, 339 units have been built, 1.5% of the total, and only 793 date from the 1960s.
A neighborhood built in that window has features in common. The homes are old enough for second or third roofs, air conditioners and pool equipment, and young enough that few have been torn down. The pre-1980 share is 28.8%, 6,314 units, which is lower than in the older postal areas in this series. A buyer who inspects a house built in 1985 will find mechanical items near the end of their life, and each becomes a credit or a delay.
The Census cut and the report fit together. The report's one-sale bands are the resale market for houses and townhouses of that vintage, and the sales are few because owners in that stock tend to stay. Seventy-two percent of occupied homes are owned, 14,071 of 19,533, and 28.0% are rented, 5,462. A stock with that much owner occupancy turns over slowly.
Age also sets the repair agenda. A house built in 1985 is now about 40 years old, and a cooling system from that period has usually been replaced at least once. Roofs in the desert last a shorter time than the label says, because of heat. Pool pumps, irrigation lines and windows are also on the list. None of that is unusual, and a buyer who inspects expects to find it. An owner who has receipts for the last replacement of each system turns an unknown into a known, and an owner who sells as is to a buyer who does not inspect avoids the negotiation altogether.
The market is therefore thin for structural reasons as well as seasonal ones. Few units are built each year, most owners stay, and the units that do come to market are compared one by one. In that kind of market a median is not a measurement. It is a description of the last few closings.
Source: U.S. Census Bureau, American Community Survey 2020-2024, table B25034 and B25003. Shares calculated from published counts.
Who owns, who rents and what do they earn?
The postal area has 45,558 residents and 21,914 housing units, of which 19,533 are occupied. Owners live in 14,071 (72.0%) and renters in 5,462 (28.0%). The other 2,381 units, 10.9% of the total, have no usual resident, which is typical of a market with seasonal owners. Median household income is $123,203, and median gross rent is $2,156 a month, or $25,872 a year, which is 21.0% of the median income.
Owners estimate the median home at $785,700, with a margin of error of $25,171, about 3.2%. That is lower than the $900,000 to $1.6 million bands for houses in the absorption report, because the postal area includes condominiums, townhomes and older houses, and because owner estimates are collected over several years. A margin of 3.2% is small, which says the estimate is reliable as a description of the postal area, not that it applies to any house.
The income figure is also a clue to who the buyers are. A household earning $123,203 a year can support a payment on a condominium in the $600,000 band only with a large down payment or a second income, which is why the report's most active bands for townhouses and houses sit well above that figure. The buyers in the stronger bands are likely to be owners moving up, relocating from elsewhere or buying with equity from another sale. The Census does not tell us which, and this brief does not guess.
An income of $123,203 against a rent of $25,872 shows an area where renters are well paid. A tenant who pays $2,156 a month is a buyer in waiting for some of the townhouses and condominiums in the report's lower bands, and an investor who owns a rental is a seller who may respond to a direct offer. In a market with one sale per band, a single investor can change a band.
The vacancy of 10.9% includes second homes, units for sale or rent and units held off the market. The Census does not separate them, and this brief does not guess at the split.
| Indicator | Value | Note |
|---|---|---|
| Population | 45,558 | Whole postal area |
| Housing units | 21,914 | All units |
| Owner-occupied homes | 14,071 | 72.0% of occupied |
| Renter-occupied homes | 5,462 | 28.0% of occupied |
| No usual resident | 2,381 | 10.9% of all units |
| Median household income | $123,203 | Estimate |
| Median gross rent | $2,156 | Monthly |
| Owner-estimated median value | $785,700 | Margin of error $25,171 |
Source: U.S. Census Bureau, American Community Survey 2020-2024 five-year estimates, tables B01003, B19013, B25003, B25034, B25064 and B25077.
What does the Phoenix metro clock say?
Realtor.com publishes listing series for the Phoenix, Mesa and Scottsdale metropolitan area through the Federal Reserve Bank of St. Louis. They show direction and not the level for Kierland. The median days on market was 60 in May 2026, 64 in June, 67 in July and August, and 62 in September.
Active listings were 19,517 in May and 18,437 in September, a fall of 5.5%, with a low of 17,661 in July (Realtor.com, active listings). New listings fell from 8,670 in March to 5,854 in July (Realtor.com, new listings), a decline of 32.5%. The median listing price slipped from $498,000 in May to $475,000 in September (Realtor.com, median listing price), a decline of 4.6%.
The count of listings with a price reduction fell from 10,902 in March to 8,348 in July. That is a count and not a share, and it fell along with the number of new listings, so it does not show that fewer sellers were cutting.
Compare the two descriptions of supply. The metro lost 5.5% of its active listings between May and September while new listings fell by almost a third between March and July. A fall in new listings is the sellers' side of the story: fewer owners chose to list, perhaps because they could not find a place to move to or were waiting for rates to fall. That is consistent with a thin neighborhood market, where the supply of listings is limited by owners' choices and not by a lack of demand.
The metro picture is a market that slowed through July, with fewer new listings and a longer clock, then eased a little in September. It matches the report's tone in one way, that supply is not large, and differs in another, since a metro median of 62 days is far from the idea of homes that sell quickly. The two are not in conflict, because one describes a metropolitan area of millions and the other a few price bands in one neighborhood. Readers comparing markets can also read the Paradise Valley brief and the Scottsdale Airpark brief.
Source: Realtor.com via FRED, Housing Inventory: Median Days on Market, Active Listing Count, New Listing Count, Median Listing Price and Price Reduced Count, Phoenix-Mesa-Scottsdale, AZ (CBSA).
What would a private sale change in Kierland?
A direct sale to a buyer who purchases homes off the market changes five things for the seller. There are no showings and no neighbors talking about you selling, which is the privacy benefit. The closing date can be flexible, giving time to find a new home. There are no commission costs and no closing costs for the seller. And there are no inspections or repairs, which matters on a stock where roofs, cooling systems and pool equipment from the 1980s are coming due.
The fee benefit needs no assumed rate. For every 1% of a sale price that would otherwise go to fees, a sale at $650,000 keeps $6,500, a sale at $950,000 keeps $9,500 and a sale at $1,450,000 keeps $14,500. An owner can set whatever percentage applies against a private offer and compare the two on net proceeds.
Consider timing as well. A seller who lists in September in a market where the metro clock is 62 days faces a possible close in December, after the 60 days of a typical listing plus 30 to 45 days of escrow. A seller who needs to move by a fixed date, for work or for a school year, has to ask whether the public path can hit it. A private buyer can often agree a date at the start, and the date is a term in the offer and not an outcome of the process.
In a market of one sale per band, the value of certainty is higher than it looks. A seller who lists in a band where nothing has sold for months is betting on a buyer who may not exist this season. A private offer is a number that is already there.
The trade-off is the usual one. A public listing can bring competing bids, and the report says the area favors sellers. A private sale brings one offer, on a date the seller chooses. An owner who values privacy, a settled date and freedom from repairs may prefer it. The choice belongs to the owner.
Source: calculation from stated prices; no commission rate or closing cost is assumed.
Methodology and limitations
Age, tenure, vacancy, income, rent, population and owner-estimated value come from the American Community Survey 2020-2024 five-year estimates for the postal-code area that includes Kierland. The area is wider than the neighborhood. Shares are calculated from published counts, and owner-estimated value carries a stated margin of error.
Days on market, active listings, new listings, median listing price and price reduced counts are Realtor.com series published by the Federal Reserve Bank of St. Louis for the Phoenix-Mesa-Scottsdale metropolitan area. The price-reduced series ends in July 2026 and the others in September 2026. Listing prices are asking prices and not sale prices.
The absorption report is a brokerage tool. Its counts of homes, sales and months of inventory were not independently verified, and the arithmetic about absorption rates restates its definitions. The brief makes no forecast and does not estimate what any particular home would sell for.
Conclusion
The public record supports a short list for a Kierland owner. A 1.1-month headline rests on a handful of sales across thin price bands, a condo band 50,000 dollars below the active one shows six months of supply, and the postal area is a stock built mostly between 1970 and 1999 with owners who stay.
It does not support a price for any one home, and it does not support a forecast. The choice between a public listing and a private sale comes down to how much an owner values a possible higher price against privacy, a flexible closing date, no commission, no closing costs and no inspections or repairs.
Frequently Asked Questions
What does 1.1 months of inventory mean?
In the report, it is the number of available homes divided by the monthly sales rate over the last six months, across all segments.
Why can a band show zero months of supply?
If no home is listed in a band, the division gives zero, even when only one buyer bought there in six months.
Why does one condo band show six months?
The report lists one available unit and about one sale in six months at $600,000 to $650,000.
Does the metro listing data describe Kierland?
No. It covers the whole Phoenix area and shows direction only.
Does a private sale always beat a public listing?
No. A public listing can attract competing bids. A private sale offers privacy, a flexible closing date, no commission, no closing costs and no inspections or repairs, in exchange for a single offer.
Compare your options before committing. Request a written private offer for your property, with no obligation, then weigh it against your listing plan.
Sources
- Homes by Marco, 2026. Kierland, Scottsdale, AZ Housing Market Report. https://www.homesbymarco.com/neighborhoods/kierland-in-scottsdale-az/housing-market-report.
- U.S. Census Bureau, 2026. American Community Survey 2020-2024 five-year estimates, the Kierland area (via Census Reporter). https://censusreporter.org/profiles/86000US85254-85254/.
- Realtor.com, 2026. Housing Inventory: Median Days on Market in Phoenix-Mesa-Scottsdale, AZ (CBSA). https://fred.stlouisfed.org/series/MEDDAYONMAR38060.
- Realtor.com, 2026. Housing Inventory: Price Reduced Count in Phoenix-Mesa-Scottsdale, AZ (CBSA). https://fred.stlouisfed.org/series/PRIREDCOU38060.
- Realtor.com, 2026. Housing Inventory: Active Listing Count in Phoenix-Mesa-Scottsdale, AZ (CBSA). https://fred.stlouisfed.org/series/ACTLISCOU38060.
- Realtor.com, 2026. Housing Inventory: New Listing Count in Phoenix-Mesa-Scottsdale, AZ (CBSA). https://fred.stlouisfed.org/series/NEWLISCOU38060.
- Realtor.com, 2026. Housing Inventory: Median Listing Price in Phoenix-Mesa-Scottsdale, AZ (CBSA). https://fred.stlouisfed.org/series/MEDLISPRI38060.
Related research

Seller Guide · October 6, 2026
How to Prepare Point Pleasant Beach Rental Records Before Selling
Separate rental approval, income history and booked stays before comparing sale terms.

Seller Guide · October 6, 2026
How to Prepare Rumson Flood and Waterfront Records Before Selling
Separate flood disclosure, elevation, repairs and waterfront rights before comparing sale terms.

Seller Guide · October 6, 2026
How to Prepare Sarasota Condo Inspection and Reserve Records Before Selling
Separate building condition, reserve funding and resale documents before comparing sale terms.