Market Brief · by Aidan Sowa · October 5, 2026
Is the Miami Beach Median Home a Condo or a House? Reading a Large Condo Market and a Small House Market
Reading a Large Condo Market and a Small House Market for Miami Beach, FL, with each source dated and its limits noted, for owners weighing a listing against a direct sale.
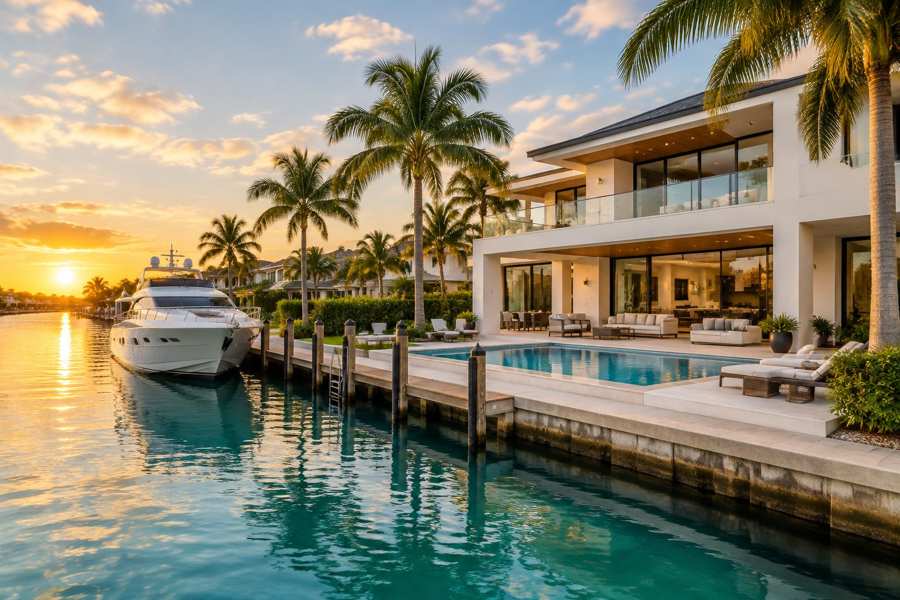
Is the Miami Beach median home $525,000 or $5,750,000? Both figures are published for September 2026, from the same listing data, and both are right. The median Miami Beach house sold that month for $5,750,000, up 138.8% on September 2025, on 20 sales. The median condo or townhouse sold for $525,000, up 8.2%, on 100 sales. The first is 10.95 times the second. A page that blends the two will publish a number that describes neither.
City-wide pages do blend them, and they disagree. Realtor.com's median sold price for August is $420,000, down 29.11% on the year. Redfin's three-month median to July is $560,000. A market-data page that tracks closings shows $535,000 for six months. Another shows $757,500 over twelve months, up 9.5%, and also shows that the median fell 7.5% a year since 2012 from $2.24 million, a drop that this brief reads as a change in what sells and not as a collapse in prices. Between $420,000 and $757,500 is a gap of 1.8 times.
Maison Off-Market buys luxury homes and estates directly from their owners and speaks only to sellers. We do not estimate what any home is worth, and nothing here is a valuation. This brief reads the pages side by side, keeps houses and condominiums apart, and states what a percentage of a price is worth in dollars. Every figure is attributed, every calculation is this brief's own arithmetic and every inference is labeled as one.
Key Findings
- A brokerage research page built on BeachesMLS data, last updated October 5, 2026, showed a September median house sale of $5,750,000 (20 sales) and a median condo or townhouse sale of $525,000 (100 sales), 156 houses and 1,633 condos and townhouses for sale, 7.8 and 16.3 months of inventory, and 29.3% of houses and 34.7% of condos priced below their original ask (PBP Real Estate, Miami Beach real estate statistics).
- Realtor.com, with indicators as of August 2026, showed a median listing price of $644,000, a median sold price of $420,000 (down 29.11% on the year), 2,096 active listings (down 21.79%), a median of 102 days on market and homes sold 4.76% below the asking price (Realtor.com, Miami Beach market data).
- Redfin showed a median sale price of $560,000 for the three months to July 2026 (down 0.41%), 146 days on market against 130 a year earlier and 542 homes sold in July against 484 (Redfin, Miami Beach housing market).
- A market page tracking closings showed 1,537 closings in six months at a median of $535,000, $603 per square foot and a middle half between $330,000 and $1,649,875, with a median of $623,750 for sales listed on the multiple listing service alone (Resideline, Miami Beach housing market).
- A market-data page updated September 30, 2026 showed a twelve-month median sale price of $757,500 on 1,338 recorded sales, $689 per square foot, 96 days to contract and 90.6% of the original asking price (Move With Momentum, Miami Beach home values).
- The Census shows a postal area with 20,342 residents and 15,871 homes, of which 45.0% are vacant, with a median household income of $107,063 and a median owner-occupied home value of $866,900 (Census Reporter, American Community Survey profile).
Why does a house sell for ten times a condo?
The research page keeps houses and condos apart, which most city pages do not. For September 2026 it shows 20 house sales at a median of $5,750,000 and $1,577 per square foot, and 100 condo and townhouse sales at $525,000 and $582 per square foot. For the nine months to September 30 it shows 177 houses at $4,500,000 and 1,231 condos and townhouses at $510,000, against 166 houses at $3,425,000 and 1,113 condos at $495,000 in the same months of 2025. The year-to-date house median is 8.8 times the condo median.
The September house figure is the sale of 20 homes, and it is up 138.8% on a September that had a median of $2,408,275. The page warns that monthly medians compare different homes and are not repeat sales, so a swing that large reflects which homes happened to sell. This brief draws the same lesson: when 20 sales make a median, one or two sales of waterfront estates can double it. The year-to-date figure of $4,500,000, up 31.4% on $3,425,000, is a steadier guide. The percentage is this brief's arithmetic.
Houses are a small part of the market. The 177 house sales are 12.6% of the 1,408 sales in the first nine months, which is this brief's arithmetic. The remaining 87% or so are condos and townhouses, which is why a city-wide median lands near the condo figure. The market page that tracks closings says as much: its tracked sales are overwhelmingly condos, and its median follows that segment and not a blend.
For a seller, the point is plain. A condo owner and a house owner are in two separate markets that share a city name. A $525,000 median says nothing about a waterfront house, and a $5,750,000 median says nothing about a one-bedroom condominium.
| Source | Figure | Period and sample |
|---|---|---|
| Realtor.com: median sold | $420,000 | August 2026 |
| Condos and townhouses, brokerage page | $525,000 (100 sales) | September 2026 |
| Resideline: median closing price | $535,000 (1,537 closings) | Six months to October 2026 |
| Redfin: median sale price | $560,000 (542 sold in July) | Three months to July 2026 |
| Move With Momentum: median sale | $757,500 (1,338 sales) | Twelve months to September 2026 |
| Houses, brokerage page | $5,750,000 (20 sales) | September 2026 |
Source: the pages as cited. The 10.95 times figure is this brief's arithmetic ($5,750,000 divided by $525,000). Commercial content; not independently verified.
How many homes are for sale in Miami Beach?
The research page counts 156 houses and 1,633 condos and townhouses for sale on October 5, with a further 36 houses and 190 condos under contract. That is 1,789 for sale. Realtor.com shows 2,096 active listings for August, down 21.79% on the year, which is 17% above the research page's count. The market-data page shows 1,065 active and 155 pending. The three counts are 1,065, 1,789 and 2,096, and none of the pages says which streets or home types it includes.
The inventory figures are the clearest difference between houses and condos. At September's sales pace, the research page says there are 7.8 months of house inventory and 16.3 months for condos and townhouses. The county figures it gives are 5.8 and 13.6. Both Miami Beach figures are higher than the county's, and the condo figure is more than twice the 6-month line that is often described as balanced. The reading is this brief's inference, and the page does not use that line.
The median asking price of a house for sale is $5,900,000, or $1,642 per square foot, and of a condo or townhouse $574,000, or $664 per square foot. Condominium owners also carry association fees. The page shows a median monthly fee of $1,131 on condos for sale, with 57.2% above $1,000 a month and a median annual fee of 2.3% of the asking price. On a $574,000 condo, $1,131 a month is $13,572 a year, which is 2.4% of the price. That is this brief's arithmetic and is close to the page's figure.
The same logic applies to houses in a different way. A house for sale has no monthly fee, but it has a much longer list of costs that fall to the owner during a long wait, among them insurance, upkeep of a pool or a seawall and property tax. None of these appears in the pages cited, so this brief does not put numbers on them. They are a reason to ask how long a home like yours is likely to sit.
For a seller of a condo, a fee of that size is part of what a buyer weighs and part of what a long wait costs. More than 1,600 other condos are for sale in the same city, and 16.3 months of supply means that the typical one will be competing for a long time.
What does the neighborhood table add up to?
Realtor.com's neighborhood table for Miami Beach lists median listing prices from $299,000 in Flamingo-Lummus and $315,000 in North Shore to $1,294,500 in South Pointe, $1,537,500 in Bayshore and $1,945,444 in the Venetian Islands. The top is 6.5 times the bottom. The price per square foot runs from $410 in the Isle of Normandy to $1,186 in South Pointe.
The same table counts homes for sale. South Beach has 967, Mid Beach 560, North Beach 498, Ocean Front 438 and Flamingo-Lummus 358. The fifteen rows add up to 4,015. The page's own headline is 2,096. The rows therefore add up to 1.92 times the headline, an excess of 1,919. The likeliest explanation, and it is this brief's inference, is that the named areas overlap, so that a condominium in South Beach is also counted under a smaller name inside it. The page does not explain it.
The overlap has a practical meaning. A number for a neighborhood on this page cannot be read as a share of the city, and two rows cannot be added. An owner who wants to know how many homes compete with theirs needs a count of the building or the block, which no public city page provides.
The median days on market tables on the same page list individual condominium buildings with 58 to 68 days, against 102 for the city. A building's own history says more about a sale than the city's, because owners in a building share fees, rules and often a buyer pool.
How long does a Miami Beach sale take, and what is the discount?
The pages disagree on time. The research page shows that houses sold in September took a median of 96 days to go under contract and condos 86 days. For the nine months to September the figures are 110 and 84 days. Homes still for sale have been listed 92 days at the median, and counting earlier listings the figure is 122 days for houses and 118 for condos. Realtor.com shows a median of 102 days. Redfin shows 146 days for three months to July, up from 130, and calls the market not very competitive. The market-data page shows 96 days to contract.
The discount is measured differently by each page. The research page shows that houses sold in September at 92.0% of the final asking price and condos at 95.0%. It also says 94.0% of houses and 90.5% of condos sold in 2026 closed below their original ask. Realtor.com shows homes sold 4.76% below the asking price, a ratio of 95%, and the market-data page shows 90.6% of the original ask. The numbers range from 90.5% to 95%. Part of that spread is likely to come from measuring against the original ask in one place and the final ask in another, which is an inference and not something every page says.
Price cuts affect a large share of listings. The research page shows that 29.3% of houses and 34.7% of condos for sale are below their original asking price, with a median recorded cut of 6.8% ($375,000) for houses and 5.6% ($31,000) for condos. It says the share is a floor, since the listing record does not carry every price change. In the text of the page, the county comparison reads Palm Beach County at 40.4% and 37.9%, while the page's table labels the same figures Miami-Dade County. The page contradicts itself on which county it means, so this brief does not use those two figures.
Cash matters too. The page says 71.4% of house sales and 68.5% of condo sales in 2026 were cash. A market in which seven buyers in ten pay cash is less sensitive to mortgage rates than one in which they do not. That is an inference, and the page makes no such claim.
What do the Census and county series add?
The Census profile for the postal area shows a median household income of $107,063, a median gross rent of $2,194 and a median owner-occupied home value of $866,900, with a margin of error of $154,450, or 17.8% of the figure. That margin is the widest in this series of posts, and it fits a market with houses and condos at opposite ends. Of 15,871 homes, 8,728 are occupied by someone as a usual residence and 7,143, or 45.0%, are vacant. Of the occupied homes, 57.8% are owner-occupied and 42.2% are rented.
The stock is mid-century. The median year built is 1968, the 1960s is the largest decade with 4,894 homes, and 69.8% of homes were built before 1980. A second wave from the 2000s is smaller, at 1,303. Buildings of that age may carry the repairs, special assessments and inspection requirements that older condominium buildings face. That is general context and not a finding from the pages here.
The Miami-Dade County series from Realtor.com, published through the Federal Reserve Bank of St. Louis, give the county background. The median days on market was 83 in May and 87 in September, up 4.8% (Realtor.com, days on market). Active listings were 17,140 in May and 17,010 in September (Realtor.com, active listings). The median listing price was $595,000 in May and $589,000 in September (Realtor.com, median listing price). The count of listings with a reduction fell from 3,312 in March to 2,924 in July, down 11.7% (Realtor.com, price reduced count), which is 17.7% of the 16,534 active listings in July. The percentages are this brief's arithmetic.
Miami Beach's own share of listings with a cut, 29.3% to 34.7%, is well above the county's 17.7%, though the two measures are not the same. The county series are not Miami Beach figures, and the series titles were checked on their series pages. Readers comparing markets can also read the Destin brief and the Bal Harbour brief.
Source: Realtor.com series published by the Federal Reserve Bank of St. Louis as cited. The 4.8%, 11.7% and 17.7% figures are this brief's arithmetic. The series names were checked against the series pages.
What should an owner ask, and what does a private sale change?
Ask whether a number counts houses, condominiums or both, and how many sales sit behind it. Ask whether a discount is measured against the first or the last asking price, and how many months a figure covers. A condo owner should ask about the building and the fees. A house owner should ask about waterfront, lot and the handful of sales that make up a monthly median.
A private sale changes how a home reaches a buyer. With Maison Off-Market there are no showings and no neighbors talking about a sale, the closing date can be flexible so that an owner has time to find a new home, there are no commission costs, there are no closing costs and there are no inspections or repairs. For an owner of an older building or an older house, skipping a buyer's inspection may matter most. This brief does not claim that a private sale always brings a higher price than a public listing.
Fee arithmetic shows why the commission point matters, without assuming any rate. Each 1% of a sale price is $4,200 at $420,000, $5,250 at $525,000 and $7,575 at $757,500. At 3% those amounts are $12,600, $15,750 and $22,725. At 5% they are $21,000, $26,250 and $37,875. On the $5,750,000 house median each 1% is $57,500, which is $172,500 at 3% and $287,500 at 5%. These are illustrations of what a percentage means on each of the figures in this brief, and they are not a statement of what any agent charges or what any sale would cost.
Privacy is the point many owners of larger homes raise first. A public listing puts photographs, a price history and the date of every price change in front of anyone with a phone, and neighbors read them too. A private sale keeps those details out of view. That is a matter of preference and not a claim about price.
Timing is the other thing an owner controls. A public listing starts a clock that buyers can see, and the pages above show 84 to 146 days. A private sale lets the owner choose the closing date, which matters most to people who need to find the next home first.
If you are weighing a sale of a Miami Beach home, one conversation costs nothing and obliges you to nothing. We ask about the home, the timing you would like and what you would need from a buyer, and we say plainly whether a private sale fits.
If you would like a private, no-obligation offer for a Miami Beach home, call 401-219-4207 or use the contact form on this site.
Methodology and limitations
Prices, days on market, counts, price cuts and neighborhood figures come from a brokerage research page built on BeachesMLS data and updated October 5, 2026, Realtor.com's city page with indicators as of August 2026, Redfin's city page for the three months to July 2026, a market page tracking closings in the six months to October 2026 and a market-data page updated September 30, 2026. The sources cover different periods and home types, and most are commercial pages, so they are not independent of each other.
Census figures come from the American Community Survey 2020-2024 five-year estimates for the postal area, through Census Reporter. County series are Realtor.com data published by the Federal Reserve Bank of St. Louis for Miami-Dade County, Florida, and the series titles were checked on the series pages. Percentages, gaps, ratios and fee amounts are this brief's own arithmetic and are labeled as such. Where a reading goes beyond what a page says, it is called an inference. No agent names, contact details or street addresses from the pages are reproduced.
Conclusion
The Miami Beach record shows a $5,750,000 house median and a $525,000 condo median for the same month, city-wide medians from $420,000 to $757,500, 156 houses and 1,633 condos for sale, a neighborhood table that sums to 4,015 against a headline of 2,096, and 84 to 146 days to sell. The numbers differ because houses and condominiums are different markets, and because the pages count different homes, areas and months.
It does not fix a price for any one home. The choice between a public listing and a private sale comes down to whether an owner would rather meet showings, price cuts and a public clock, or sell quietly on a date that suits them. Maison Off-Market speaks only to sellers, and a conversation costs nothing.
Frequently Asked Questions
What is the median home price in Miami Beach?
It depends on the home type and the source. A brokerage research page shows $5,750,000 for houses and $525,000 for condos and townhouses in September 2026. Realtor.com shows $420,000 for August. Redfin shows $560,000 for three months to July. A market-data page shows $757,500 for twelve months.
How many homes are for sale in Miami Beach?
A brokerage research page shows 156 houses and 1,633 condos and townhouses on October 5, 2026. Realtor.com shows 2,096 active listings for August. A market-data page shows 1,065 active and 155 pending.
How long do homes take to sell in Miami Beach?
A research page shows 96 days to contract for houses and 86 for condos in September 2026. Realtor.com shows a median of 102 days. Redfin shows 146 days for three months to July.
Why do Miami Beach neighborhood counts not add up?
Realtor.com lists 2,096 active listings city-wide, but its neighborhood rows add up to 4,015, which suggests the named areas overlap.
What is the difference between a private sale and a public listing?
A private sale with Maison Off-Market has no showings, a flexible closing date, no commission costs, no closing costs and no inspections or repairs. A public listing exposes the home to a wider group of buyers. This brief does not claim either always gets a higher price.
Compare your options before committing. Request a written private offer for your property, with no obligation, then weigh it against your listing plan.
Sources
- PBP Real Estate, 2026. Miami Beach Real Estate Statistics 2026. https://www.pbprealestate.com/miami-beach-real-estate-statistics/.
- Realtor.com, 2026. Miami Beach, FL Housing Market and Rental Trends. https://www.realtor.com/local/market/florida/miami-dade-county/miami-beach.
- Redfin, 2026. Miami Beach Housing Market Trends. https://www.redfin.com/city/11467/FL/Miami-Beach/housing-market.
- Resideline, 2026. Miami Beach, FL Housing Market 2026: Prices and Trends. https://resideline.com/blog/miami-beach-fl-housing-market.
- Move With Momentum, 2026. Miami Beach Home Values 2026. https://movewithmomentum.com/home-value/miami-beach-fl/.
- U.S. Census Bureau, 2026. American Community Survey 2020-2024 five-year estimates, the Miami Beach area (via Census Reporter). https://censusreporter.org/profiles/86000US33140-33140/.
- Realtor.com, 2026. Housing Inventory: Median Days on Market in Miami-Dade County, FL. https://fred.stlouisfed.org/series/MEDDAYONMAR12086.
- Realtor.com, 2026. Housing Inventory: Active Listing Count in Miami-Dade County, FL. https://fred.stlouisfed.org/series/ACTLISCOU12086.
- Realtor.com, 2026. Housing Inventory: Median Listing Price in Miami-Dade County, FL. https://fred.stlouisfed.org/series/MEDLISPRI12086.
- Realtor.com, 2026. Housing Inventory: Price Reduced Count in Miami-Dade County, FL. https://fred.stlouisfed.org/series/PRIREDCOU12086.
Related research

Seller Guide · October 6, 2026
How to Prepare Point Pleasant Beach Rental Records Before Selling
Separate rental approval, income history and booked stays before comparing sale terms.

Seller Guide · October 6, 2026
How to Prepare Rumson Flood and Waterfront Records Before Selling
Separate flood disclosure, elevation, repairs and waterfront rights before comparing sale terms.

Seller Guide · October 6, 2026
How to Prepare Sarasota Condo Inspection and Reserve Records Before Selling
Separate building condition, reserve funding and resale documents before comparing sale terms.