Market Brief · by Aidan Sowa · October 5, 2026
Is North Raleigh Worth More or Just Bigger? Reading a Rising Median Beside a Falling Price per Foot
Reading a Rising Median Beside a Falling Price per Foot for North Raleigh, NC, with each source dated and its limits noted, for owners weighing a listing against a direct sale.
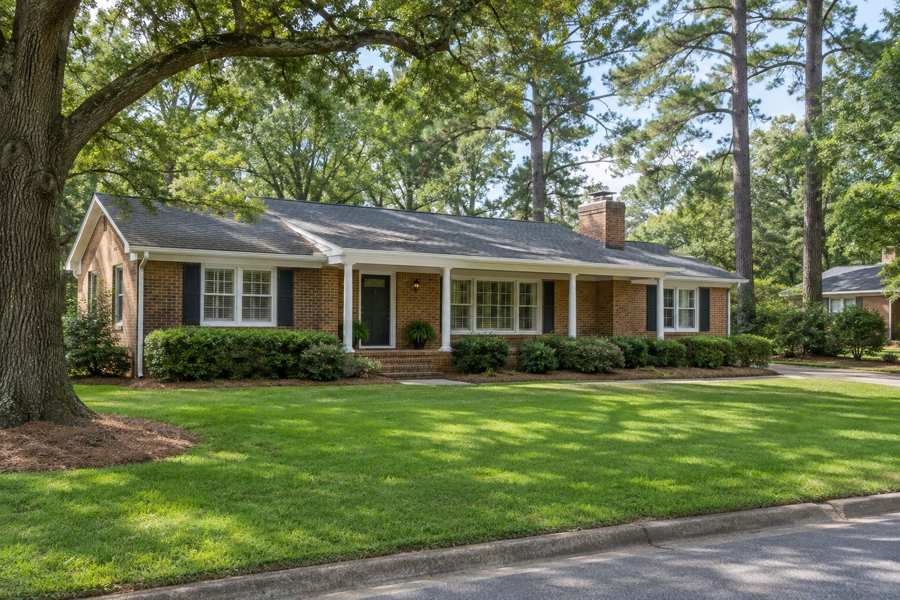
Is a North Raleigh home worth more than it was a year ago? A local brokerage blog, using Redfin's figures for the three months to June 2026, says that the median sale price was $500,000, up 4.1%. In the same sentence it says that the median price per square foot was $236, down 4.3%. The blog's point is that the two cannot both describe the same houses getting more valuable. The likelier reading is that the houses that sold were bigger.
Other pages add to the puzzle. Realtor.com's June figures show a median listing price of $499,990, up 0.02%, and a median sold price of $497,500, up 0.25%, with a price per square foot of $243, down 5.85%. Redfin's own page for March shows a median sale price of $454,000, down 3.0%, and a price per foot of $255, up 5.4%. Realtor.com also counts 490 homes for sale and 1,872 rentals, nearly four rentals for every sale listing.
This brief reads the Realtor.com page for North Raleigh, the Redfin page, a brokerage blog on the price per square foot and a second blog on pricing into the fall side by side, tests the neighborhood table against the headline count, adds the Census profile and the Raleigh series, and asks what the numbers mean for an owner who is choosing between a public listing and a private sale.
Key Findings
- Realtor.com reported, with key indicators as of June 2026, a median listing price of $499,990 for North Raleigh (up 0.02% on the year and down 7.05% on three years), a median sold price of $497,500 (up 0.25% and up 13.07%), $243 per square foot (down 5.85%), 490 homes for sale (up 1.75% and up 113.30%) and a median of 44 days on market (up 2.33% and up 57.14%).
- The same page counted 1,872 rentals (up 36.10% on the year and up 106.37% on three years) at a median rent of $1,512 a month (up 2.37%), gave a sale-to-list ratio of 100% and called the market a seller's market.
- Redfin reported, for March 2026, a median sale price of $454,000 (down 3.0% on the year), $255 per square foot (up 5.4%), 220 homes sold (207 a year earlier), an average of 40 days on market against 36, and one offer on average. It rated the area somewhat competitive.
- A Raleigh brokerage blog, quoting Redfin for the three months to June 2026, reported a median sale price of $500,000 (up 4.1%), $236 per square foot (down 4.3%) and 27 days on market. A second blog, quoting Redfin's July read, reported a three-month median of $495,000 (up 0.8%), 28 days and a compete score of 72 out of 100 against 66 for Raleigh as a whole. These are the blogs' reports and were not checked against Redfin.
- In the Census postal area that includes North Raleigh, the median household income is $112,754 and the owner-estimated median home value is $479,000, with a margin of error of $11,873 (Census Reporter, American Community Survey profile).
- In the Raleigh area the median days on market was 44 in April 2026 and 54 in July (Realtor.com, days on market).
Can a price rise while the price per foot falls?
Yes, and the arithmetic shows how. A median sale price of $500,000 at $236 per square foot implies a house of about 2,120 square feet. A year earlier, a median of about $480,300 (500,000 divided by 1.041) at a price per foot of about $247 (236 divided by 0.957) implies about 1,950 square feet. The median house that sold grew by about 170 square feet, or 8.7%, while the price per foot fell. The price rose because the houses were larger.
Redfin's March page gives a smaller house. At $454,000 and $255 per foot, the median sale was of about 1,780 square feet. At Realtor.com's $243 per foot, the listing median of $499,990 is about 2,060 square feet. Houses that list are larger than houses that sell in March, and houses that sold in spring were smaller than those that sold in early summer. A median that moves from $454,000 to $500,000 between March and June is partly a story of the season and of mix.
The first blog's reading is that the price per foot is the steadier guide to value and that it is falling. Realtor.com agrees on the direction, with $243 per foot down 5.85% on the year. Redfin's March figure of $255 up 5.4% disagrees. Two of three pages say the price per foot is lower than a year ago, and the third says it is higher. That is a split verdict, with a lean toward down.
For an owner, the useful point is to compare by size. A house of 2,100 square feet that sells at $243 per foot brings about $510,000, and one at $255 brings about $535,500. The difference of $25,500 is the spread between two pages' price per foot, and it is larger than the whole year's change in the median on Realtor.com.
| Source | Median price | Price per sq ft | Days on market |
|---|---|---|---|
| Realtor.com, June | $499,990 listing, $497,500 sold | $243 (down 5.85%) | 44 (median) |
| Redfin, March | $454,000 sold (down 3.0%) | $255 (up 5.4%) | 40 (average) |
| Brokerage blog, three months to June | $500,000 sold (up 4.1%) | $236 (down 4.3%) | 27 |
| Second blog, Redfin July read | $495,000 sold (up 0.8%) | Not given | 28 |
Source: Realtor.com, Redfin and two brokerage blogs as cited. The 2,120, 1,950, 170, 8.7%, 1,780, 2,060, $510,000, $535,500 and $25,500 figures are this brief's arithmetic from the stated figures. The reading of the change in mix is this brief's inference and is not a statement of any source. Commercial content; not independently verified.
Why are there 1,872 rentals beside 490 homes for sale?
The Realtor.com page counts 1,872 rental properties, up 36.10% on the year and up 106.37% on three years. That is 3.8 rentals for every home for sale. A median rent of $1,512 a month, up 2.37%, sits 6.2% below the Census median gross rent of $1,612 for the postal area. Apartments are a large part of North Raleigh, and many of the rentals are probably units in complexes with many vacancies at once, which is why the count is large and the rent is low.
The Census puts the renter share in context. Renters hold 5,313 of the 19,274 occupied homes in the postal area, 27.6%, and owners 13,961, 72.4%. The 1,872 listed rentals are 35% of the renter households, which is a high share for a month's listings, and fits a market in which renters move often. Rental supply has doubled in three years, according to the page.
For a seller, this matters in two ways. First, a house that does not sell can be rented, but a landlord faces a market in which rental supply has doubled. At $1,512 a month, the yearly rent is $18,144, 3.6% of the sold median of $497,500. That is before taxes, insurance, repairs and vacancy. Second, buyers who are investors can choose among many rentals, so a seller should not count on an investor to pay a premium.
The count of homes for sale tells a similar story. At 490, it is up 113.30% on three years, which implies about 230 homes in 2023. The stock has more than doubled in three years while the wait rose from about 28 days to 44. The page still calls the market a seller's market, with a sale-to-list ratio of 100%. Supply has grown, and sellers are still getting asking price.
Source: Realtor.com page and U.S. Census Bureau, American Community Survey 2020-2024, as cited. The 3.8, 6.2%, 35%, 3.6%, 230 and 28 day figures are this brief's arithmetic. The remark on apartment complexes is this brief's inference and not a statement of Realtor.com. Commercial content; not independently verified.
Does the neighborhood table cover the neighborhood?
The Realtor.com page lists homes for sale in seven named areas with a count above zero. They are North Ridge Condominiums 5, The Falls Condominiums 5, Tealbriar 4, Fairfax Hills 2, Cambridge Oaks 1, North Haven 1 and Westbrook North 1. The sum is 19. The headline count is 490. The table covers 3.9% of the homes, and 471 homes, 96.1%, are in no named area.
That is the thinnest coverage of any table in this series of briefs. The neighborhood is made of dozens of subdivisions that the page does not break out, and the reader cannot tell which streets hold the homes.
The page is a headline with almost no detail, and the median is a median over thousands of properties of every type.
A seller should therefore not assume that the headline median describes one street. The second blog makes the same point, saying the market is splitting in two, and the Census profile shows a stock built across five decades. The street and the age of the house matter more than the neighborhood name.
| Area | Homes for sale |
|---|---|
| North Ridge Condominiums | 5 |
| The Falls Condominiums | 5 |
| Tealbriar | 4 |
| Fairfax Hills | 2 |
| Cambridge Oaks, North Haven and Westbrook North | 3 |
| Homes in no named area | 471 |
Source: Realtor.com page as cited. The sum of 19, the 3.9%, 471 and 96.1% figures are this brief's arithmetic. Commercial content; not independently verified.
Which clock should a seller plan around?
Realtor.com gives a median of 44 days, up 2.33% on the year and up 57.14% on three years, which implies about 28 days in 2023. Redfin gives an average of 40 days for March against 36 a year earlier. The two blogs give 27 and 28 for the summer. The range runs from 27 to 44, and the difference between the shortest and the longest is 17 days.
The difference is partly what is counted. The blogs quote Redfin's days on market for sold homes, a figure for homes that have sold. Realtor.com's median is for homes on the market now and includes listings that have waited a long time without selling. A median of homes still unsold is longer than a median of homes that sold, because the slow ones stay in the count.
The second blog's main point is useful for this. It says that homes that stay at their original list price go under contract in about 27 days at roughly 99% of original list price, and that homes that miss on price at the start take much longer and close lower. That is a claim by a brokerage, and it is not tested here, but it agrees with the Realtor.com ratio of 100% and with a median of 27 to 28 days on the Redfin side.
The Raleigh series shows the region slowing. The median days on market for the Raleigh area went from 44 in April to 54 in July, an increase of 10 days or 22.7%. North Raleigh's 44 days in June compares with 50 for the region in June, six days quicker. A seller who prices well can expect a few weeks, and one who does not can expect a quarter or more.
Source: Realtor.com, Redfin, the two brokerage blogs and the Raleigh series as cited. The 28 day, 17 day, 10 day, 22.7% and six day figures are this brief's arithmetic. The remark on what each clock counts is this brief's reasoning and not a statement of any source. Commercial content; not independently verified.
What does the Census say about the stock?
The postal area that includes North Raleigh has 46,019 residents and 20,862 housing units, of which 19,274 are occupied. The 1,588 vacant homes are 7.6% of the stock. The median household income is $112,754 and the owner-estimated median home value is $479,000, with a margin of error of $11,873, or 2.5%.
The Realtor.com sold median of $497,500 is 3.9% above the Census value, and the listing median of $499,990 is 4.4% above it. The three are close, a rare agreement in this series. The sold median is 4.4 times the median income. The Census median gross rent is $1,612, and the yearly rent of $19,344 is 4.0% of the Census value.
The stock is the product of one long building boom. Homes from the 1980s number 7,776, 37.3% of the total, and from the 1990s 5,075, 24.3%. Together, those two decades are 61.6%. Homes from the 1970s add 3,096, 14.8%. Homes built before 1980 are 3,813, 18.3%, and homes built since 2010 are 1,917, 9.2%. The median year built is 1989.
Owners hold 13,961 of the occupied homes, so there are about 2.6 owner households for every renter household. Of the 20,862 units, 1,588 stand vacant, which is a vacancy rate of 7.6%. A vacancy rate of that size is the normal churn of a large area where people move for work, and it is one reason a seller should expect buyers to compare several homes before they make an offer. It does not by itself say that homes are hard to sell.
The income figure helps to size the buyer pool. A household that earns the Census median of $112,754 and spends no more than three times its income on a home can reach about $338,000, which is 32% below the sold median. A buyer at the sold median needs about 4.4 times the median income, so many of the buyers must bring equity from a previous sale or a second income. That points to move-up buyers, and move-up buyers often have a home of their own to sell first, which can lengthen a closing.
A house from 1989 is now more than thirty-five years old. The roof, the heating and cooling equipment, the windows and the water heater of a typical North Raleigh house are at or beyond their usual lives. Buyers know it and ask for the work or for a lower price, which is one reason that inspection and repair demands shape sales here. A seller who has done the work can say so, and one who has not will hear about it.
Source: U.S. Census Bureau, American Community Survey 2020-2024 and Realtor.com as cited. Multiples, shares and gaps are this brief's arithmetic. The remark on the age of equipment is this brief's general reasoning and not a statement of the Census.
What does the Raleigh series add, and what should an owner ask?
Active listings in the Raleigh area rose from 5,126 in April 2026 to 6,024 in August (Realtor.com, active listings), an increase of 17.5%. New listings fell from 2,980 in April to 2,220 in August (Realtor.com, new listings), a drop of 25.5%. More homes are staying on the market, and fewer are arriving.
Homes with a price cut rose from 2,242 in April to 2,824 in July (Realtor.com, price reduced listings), an increase of 26.0%, and were 2,716 in August, 45.1% of the 6,024 active homes. The regional median listing price was $457,500 in May and $445,000 in September (Realtor.com, median listing price), a drop of 2.7%, so the North Raleigh listing median is 1.09 times the June regional figure of $457,000.
An owner can test any offer, public or private, with plain questions. What is the price, and is any part of it conditional on an inspection, a loan or the sale of another home? What will I take home after every charge? When will the sale close, and can that date move? Who pays for the repairs a buyer asks for after an inspection?
For a house here there are more. How old are the roof, the heating and cooling equipment and the water heater, in a house from the 1980s? Is the house in a neighborhood with a homeowners association, and what are the dues? Is the street one of the established ones with large lots, or one of the many with smaller houses? If the sale takes two months, what does an owner pay in taxes, insurance and upkeep before it closes? Readers comparing markets can also read the Foxcroft brief and the North Ridge brief.
Source: Realtor.com series published by the Federal Reserve Bank of St. Louis as cited. The 17.5%, 25.5%, 26.0%, 45.1%, 2.7% and 1.09 figures are this brief's arithmetic. The questions are this brief's general reasoning and not statements of any source.
What does a private sale change?
Maison Off-Market buys homes directly from their owners. It does not list a home, hold showings or put a home on a public listing. For a North Raleigh owner, the five benefits are plain. There are no showings and no neighbors talking about the sale. The closing date can be flexible, which gives time to find a new home. There are no commission costs and no closing costs for the seller, and there are no inspections and repairs.
A little arithmetic shows what that is worth. Each 1% of a $497,500 sale is $4,975. A seller who gives up 3% gives up $14,925, and one who gives up 5% gives up $24,875. This brief does not claim that those are the costs of any sale, since the real figures depend on the agreement the seller signs. It shows how quickly a percentage becomes a sum.
The last benefit matters most for a house from the 1980s. A buyer's inspection of a thirty-five year old roof and air handler leads to a repair list, and the list leads to a round of negotiation. A seller who sells as is, to a buyer who plans the work, avoids that step. The trade is that a direct offer may differ from what a public sale could bring, and each owner can weigh the two.
One more point on timing: a flexible closing date is worth most when the next home is not yet found. A seller who must move in thirty days has little choice, and one who can pick a date sixty or ninety days out can search without pressure, pay for one home at a time and move once. In a market with 490 homes for sale, the extra time also lets a seller buy with care instead of buying in haste.
Maison Off-Market speaks only to sellers. An owner who wants to know what a direct offer would look like can use the contact form below, or call 401-219-4207, and ask for a figure with no showings, no listing and no obligation.
Source: Maison Off-Market. The fee figures are this brief's arithmetic and not claims about any sale.
Methodology and limitations
Prices, price per square foot, days on market, listing and rental counts and the neighborhood table come from a national listing site page with key indicators as of June 2026. Sale prices, sales counts and competition ratings come from a second brokerage page for March 2026 and from two brokerage blogs that quote it for later months. The sources cover different months and are not independently verified.
Age, tenure, vacancy, income, rent and owner-estimated value come from the American Community Survey 2020-2024 five-year estimates for the postal-code area that includes North Raleigh. Shares are calculated from published counts, and owner-estimated value carries a margin of error.
Days on market, active and new listings, median listing price and price reduced counts are Realtor.com series published by the Federal Reserve Bank of St. Louis for the Raleigh metropolitan area. They describe the region and not the neighborhood. The brief makes no forecast and values no home.
Conclusion
The North Raleigh record shows a median that rose 4.1% while the price per foot fell 4.3%, a stock of 490 homes for sale beside 1,872 rentals, and a neighborhood table that names 19 homes out of 490. It describes a large market of 1980s houses in which size, street and condition matter more than the neighborhood name.
It does not fix a price for any one home. The choice between a public listing and a private sale comes down to whether an owner would rather meet showings, inspections and a repair list or take privacy, a flexible closing date, no commission, no closing costs and no inspections or repairs. To see what a direct offer would look like for your home, use the contact form below or call 401-219-4207.
Frequently Asked Questions
What is the median home price in North Raleigh?
Realtor.com reports a median listing price of $499,990 and a median sold price of $497,500 for June 2026. A brokerage blog quotes Redfin at $500,000 for the three months to June.
Are North Raleigh prices rising?
The median sale price is up about 4% on one source, while the price per square foot is down 4.3% to 5.85%, which suggests larger houses are selling.
How long do North Raleigh homes take to sell?
Realtor.com reports a median of 44 days. Redfin and two blogs report 27 to 40 days.
How many rentals are there?
Realtor.com counts 1,872 rental properties, about four for every home for sale.
Does a private sale always beat a public listing?
No. A public listing can attract competing bids. A private sale offers privacy, a flexible closing date, no commission, no closing costs and no inspections or repairs.
Compare your options before committing. Request a written private offer for your property, with no obligation, then weigh it against your listing plan.
Sources
- Realtor.com, 2026. North Raleigh Neighborhood of Raleigh, NC Housing Market. https://www.realtor.com/local/market/north-carolina/raleigh/north-raleigh.
- Redfin, 2026. North Raleigh, NC Housing Market. https://www.redfin.com/neighborhood/50826/NC/Raleigh/North-Raleigh/housing-market.
- Whalen and Company, 2026. North Raleigh's Median Price Is Climbing. Your Dollar Per Square Foot Isn't.. https://whalenandco.com/blog/north-raleighs-median-price-is-climbing-your-dollar-per-square-foot-isnt.
- Bobbie Callahan, 2026. Pricing a North Raleigh Home Into Fall 2026. https://bobbiecallahan.com/blog/pricing-a-north-raleigh-home-into-fall-2026-how-the-market-is-splitting-in-two.
- U.S. Census Bureau, 2026. American Community Survey 2020-2024 five-year estimates, the North Raleigh area (via Census Reporter). https://censusreporter.org/profiles/86000US27615-27615/.
- Realtor.com, 2026. Housing Inventory: Median Days on Market in Raleigh, NC (CBSA). https://fred.stlouisfed.org/series/MEDDAYONMAR39580.
- Realtor.com, 2026. Housing Inventory: Active Listing Count in Raleigh, NC (CBSA). https://fred.stlouisfed.org/series/ACTLISCOU39580.
- Realtor.com, 2026. Housing Inventory: New Listing Count in Raleigh, NC (CBSA). https://fred.stlouisfed.org/series/NEWLISCOU39580.
- Realtor.com, 2026. Housing Inventory: Price Reduced Count in Raleigh, NC (CBSA). https://fred.stlouisfed.org/series/PRIREDCOU39580.
- Realtor.com, 2026. Housing Inventory: Median Listing Price in Raleigh, NC (CBSA). https://fred.stlouisfed.org/series/MEDLISPRI39580.
Related research

Seller Guide · October 6, 2026
How to Prepare Point Pleasant Beach Rental Records Before Selling
Separate rental approval, income history and booked stays before comparing sale terms.

Seller Guide · October 6, 2026
How to Prepare Rumson Flood and Waterfront Records Before Selling
Separate flood disclosure, elevation, repairs and waterfront rights before comparing sale terms.

Seller Guide · October 6, 2026
How to Prepare Sarasota Condo Inspection and Reserve Records Before Selling
Separate building condition, reserve funding and resale documents before comparing sale terms.