Market Brief · by Aidan Sowa · October 5, 2026
Can a North Ridge Home List Far Above the Sold Median? Reading Homes for Sale and a Long Wait
Reading Homes for Sale and a Long Wait for North Ridge, NC, with each source dated and its limits noted, for owners weighing a listing against a direct sale.
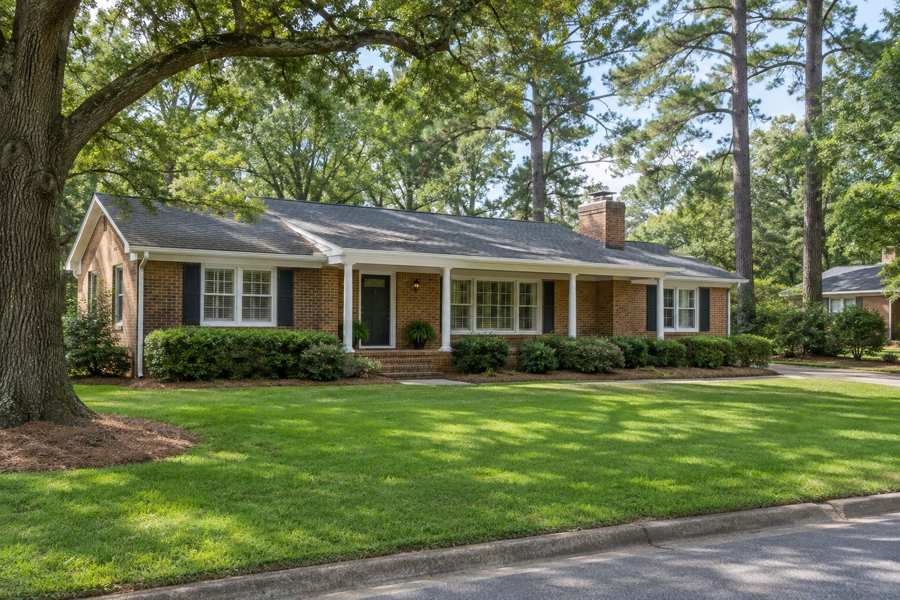
Can a home in a neighborhood where the typical house sells for $360,000 list at a median of $2,785,000? Realtor.com's page for North Ridge in Raleigh, with key indicators as of September 2026, shows both figures at once. The listing median rose 28.05% on the year while the sold median fell 16.03%. The listing figure is 7.7 times the sold figure.
The page counts 45 homes for sale, down 2.63% on the year, a median of 74 days on market, up 12.12%, and 7 rentals at a median rent of $1,825 a month, down 25.42%. It says that homes sold 2.94% below asking, with a sale-to-list ratio of 97%, and calls the area a buyer's market. Further down, a table of neighborhoods puts a different place, North Raleigh, at the top with 472 homes for sale.
This brief reads the Realtor.com page for North Ridge beside the Redfin page for the larger North Raleigh area, tests the figures against each other, adds the Census profile and asks what such a gap means for an owner who is choosing between a public listing and a private sale.
Key Findings
- Realtor.com reported, with key indicators as of September 2026, a median listing price of $2,785,000 for North Ridge (down 15.59% on the month and up 28.05% on the year), a median sold price of $360,000 (unchanged on the month and down 16.03% on the year) and $442 per square foot (down 25.53% and down 9.98%).
- The same page reported 45 active listings (down 2.63% on the year), a median of 74 days on market (down 21.69% on the month and up 12.12% on the year), 7 rental properties and a median rent of $1,825 a month (down 1.08% and down 25.42%).
- The page said that homes in North Ridge sold 2.94% below the asking price on average in September 2026, with a sale-to-list ratio of 97%, and described the area as a buyer's market.
- Its neighborhood table gave 472 homes for sale and 1,927 rentals to North Raleigh, 4 homes to Tealbriar, 3 to Lake Forest, 3 to North Ridge Estates and 2 to North Ridge Condominiums. Eleven further named areas showed none.
- In the Census postal area that includes North Ridge, 72.4% of occupied homes are owned, 7.6% of homes are vacant and the median household income is $112,754.
- In the Raleigh area the median days on market was 44 in April 2026 and 54 in July (Realtor.com, days on market).
How can the listing median be 7.7 times the sold median?
A median is the middle value of a list. When a neighborhood has only 45 homes for sale, a handful of very expensive listings can move the middle a long way, and a different handful can move it back. The page shows that happening: the listing median fell 15.59% in one month, from about $3,298,000 to $2,785,000, and was still 28.05% above a year earlier, which implies about $2,175,000 then.
The sold median does not move that way. It is $360,000, unchanged on the month and down 16.03% on the year, which implies about $428,700 a year earlier. A sold median describes the homes that actually closed, and a listing median describes the homes that are on offer now. The two can differ when the homes on offer are a different kind of home from the ones that sell.
That is the likeliest reading here. The homes that sold at a median of $360,000 are modest houses and condominiums, and the homes now listed at a median above $2.7 million include some large or special properties. This is an inference, since the page does not show the individual listings. The point for an owner is that neither figure is a price for an ordinary house on an ordinary street.
The price per square foot gives a second check. At $442 per foot, a $360,000 home implies about 815 square feet, which fits a condominium or a small house. A $2,785,000 home at the same price per foot would be about 6,300 square feet. The two medians describe two different kinds of property, and a single neighborhood label hides the gap.
| Measure | Now | Change | Implied earlier value |
|---|---|---|---|
| Median listing price | $2,785,000 | up 28.05% on the year | about $2,175,000 |
| Median sold price | $360,000 | down 16.03% on the year | about $428,700 |
| Price per square foot | $442 | down 9.98% on the year | about $491 |
| Median days on market | 74 | up 12.12% on the year | about 66 |
| Median rent | $1,825 a month | down 25.42% on the year | about $2,447 |
Source: Realtor.com page as cited. The implied earlier values, 6,300 and 815 square feet and the 7.7 ratio are this brief's arithmetic from the published changes. The reading that the homes differ in type is this brief's inference and not a statement of Realtor.com. Commercial content; not independently verified.
Whose homes does the table count?
The summary says 45 homes for sale. The table lists, for North Ridge areas, Tealbriar with 4, Lake Forest with 3, North Ridge Estates with 3 and North Ridge Condominiums with 2. The sum is 12, which is 27% of 45. The other 33 homes are in no named area, or are counted elsewhere.
The largest line in the table is not a North Ridge area at all. North Raleigh, the larger area around it, has 472 homes for sale, up 10.43% on the year, and 1,927 properties for rent, down 4.82% on the month. The table is a list of the neighborhoods that surround or contain North Ridge, and the first line is the biggest of them. A reader who adds up the column gets a number that has little to do with North Ridge.
The same page lists five postal areas with their listing medians and prices per foot: $379,450 and $185, $375,000 and $212, $529,000 and $240, $744,709 and $230, and $725,000 and $344. The range of medians, from $375,000 to $744,709, is a factor of 2.0. None of them is near $2,785,000. The North Ridge listing median is far above every postal area around it.
The neighboring North Raleigh listing median is $465,000, at $242 per foot and $1,506 a month. North Ridge's $442 per foot is 83% above it. A neighborhood priced 83% higher per foot at a sold median 23% lower is a puzzle, and the most direct answer is that the figures rest on very few sales. The page does not show how many.
| Area | Homes for sale | Rentals |
|---|---|---|
| North Raleigh (larger area) | 472 | 1,927 |
| Tealbriar | 4 | 0 |
| Lake Forest | 3 | 1 |
| North Ridge Estates | 3 | 0 |
| North Ridge Condominiums | 2 | 4 |
| Eleven other named areas | 0 | 0 |
Source: Realtor.com page as cited. The sum of 12, the 27%, 33, 83%, 23% and factor of 2.0 are this brief's arithmetic. The remark that the figures rest on few sales is this brief's inference. Commercial content; not independently verified.
What does a buyer's market mean when homes sell 2.94% below asking?
The page calls North Ridge a buyer's market, with a sale-to-list ratio of 97% and an average sale 2.94% below the asking price. On the sold median of $360,000, 2.94% is about $10,900, so an asking price near $370,900 would have been the typical starting point. That is a modest discount, and it fits a market in which sellers do not have to cut deeply to close.
The wait is more telling. A median of 74 days is up 12.12% on the year, and it is 30 days longer than the Raleigh area's 44 days in April and 20 days longer than its 54 days in July. The median in the larger area fell short of that in every month of the regional series. A seller here waits about two and a half months for a median listing.
The Redfin page for the larger North Raleigh area gives a contrast. It showed 40 days on average in March 2026 and about one offer per home, and it called the market somewhat competitive. The page is for a different area and a different month, so the figures are not a direct comparison. They do show that a longer wait is not the rule across the whole district.
A buyer's market, in the page's own words, is one where the supply of homes is greater than the demand for homes. With 45 homes for sale, that is not a large supply in absolute terms, but it is large against the number of buyers who want a house in that price range. Sellers in that position tend to compete on price, on condition and on the date of closing, and the page's figures show that the competition is mostly on time: the discount is small, and the wait is long.
For an owner, the useful figure is the product of the two. A 74-day wait and a 2.94% discount on $360,000 means about $10,900 and about ten weeks of carrying costs. With the taxes, insurance and upkeep of a house running whatever they run for the owner, the cost of waiting can be more than the cost of the discount, so a firm date can be worth a price below the asking figure.
Source: Realtor.com, Redfin and the Raleigh series as cited. The $10,900, $370,900, 30 day, 20 day and ten week figures are this brief's arithmetic. Commercial content; not independently verified.
Why do the rentals fall so far?
The page counts 7 rental properties, down 12.50% on the month and the year, at a median rent of $1,825 a month. The rent is down 25.42% on the year, which implies about $2,447 a year earlier. With only 7 rentals, one or two listings can swing a median by hundreds of dollars, so the fall says more about the small count than about the market.
The postal areas on the same page show median rents from $1,492 to $1,564 a month. North Ridge's $1,825 is 17% to 22% above them. The Census median gross rent for the postal area that includes North Ridge is $1,612, and the page's figure is 13% above it. A rent that high suggests larger or newer homes in the sample, which would agree with the high listing median.
A yearly rent of $21,900 is 6.1% of a $360,000 sold median and 0.8% of a $2,785,000 listing median. The first figure would make a rental house an attractive hold, and the second would make it a poor one. The gap is another way of seeing that the two medians describe different homes.
It is also worth noticing what the page does not show. It gives no count of sales, no breakdown by property type and no list of the 45 homes. A reader cannot tell how many homes sit behind the sold median of $360,000, and cannot tell whether the same few properties have driven both medians for several months. The monthly change of zero in the sold median suggests that the figure may not have been updated by any new sale in the month, which is another reason to treat it as a rough guide.
For a seller, the choice between selling and renting out a home turns on those figures, and the thin count makes any one of them unreliable. A landlord must also deal with vacancy, repairs, and the taxes and insurance of a house, which the page does not measure. A direct sale ends those costs at closing.
Source: Realtor.com page and U.S. Census Bureau, American Community Survey 2020-2024, as cited. The $2,447, 17%, 22%, 13%, $21,900, 6.1% and 0.8% figures are this brief's arithmetic. The remark on larger or newer homes is this brief's inference. Commercial content; not independently verified.
What does the Census say about owners and vacancy?
The Census data is for the postal area that includes North Ridge, which is much bigger than the neighborhood. It has 46,019 residents and 20,862 housing units, of which 19,274 are occupied. Owners hold 13,961 of the occupied homes, 72.4%, and renters 5,313, 27.6%. There are 1,588 vacant homes, 7.6% of all units.
The median household income is $112,754. The sold median of $360,000 is 3.2 times that income, and the owner-estimated median home value of $479,000 is 4.2 times it. The sold median is 25% below the Census value, and the listing median is 5.8 times it. A neighborhood sold median that is 25% below the area's owner-estimated value points to homes that are smaller or older than the area's typical home.
The Census median year built is 1989, and 3,813 homes, 18.3%, were built before 1980. The median home is therefore more than thirty-five years old. Whatever the size of a house, a buyer's inspection of its roof, heating and cooling equipment and windows is likely to produce a list. In a buyer's market, with a sale 2.94% below asking, a seller has less room to refuse that list.
Owners outnumber renters by about 2.6 to 1. That matters for a seller because most buyers of a modest house here are likely to be owner-occupiers, who will finance the purchase and who will usually ask for an inspection. A cash buyer who plans the repairs is a different kind of counterpart, and the terms they offer can differ from a financed buyer's in the way that counts most to a seller: whether the sale depends on a lender, an appraisal and a repair list.
The size of the postal area is worth restating. Its 46,019 residents and 20,862 homes are many times the 45 homes on the market in North Ridge. A seller should read the Census figures as the setting and the Realtor.com figures as the thin evidence of what is happening on a few streets. The margin of error on the Census value, $11,873, is 2.5% of the figure, so the value of $479,000 is a firmer number than any North Ridge median on the page.
Vacancy of 7.6% is the churn of a large area. It is not a sign of distress, and it does not describe North Ridge on its own. The 7 rentals on the page are a small share of the 1,588 vacant homes in the postal area, and most of the vacant homes are not for rent or for sale on this page.
Source: U.S. Census Bureau, American Community Survey 2020-2024 and Realtor.com as cited. Multiples, shares and gaps are this brief's arithmetic. The inference about smaller or older homes and the remark on inspections are this brief's reasoning and not statements of the Census.
What does the regional series add, and what should an owner ask?
Across the Raleigh area, active listings rose from 5,126 in April 2026 to 6,024 in August (Realtor.com, active listings), an increase of 17.5%. The median days on market rose from 44 to 54 between April and July, an increase of 10 days or 22.7%. More homes are staying longer in the region, and North Ridge's 74 days is further out on the same curve.
An owner who wants to judge any offer, public or private, can ask plain questions. What is the price, and is any part of it conditional on an inspection, a loan or the sale of another home? What will I take home after every charge? When will the sale close, and can the date move? Who pays for the repairs a buyer asks for?
A seller in a neighborhood with so few sales has more to ask. Which recent sales are the closest to my house in size and age? Is my house a type that the 45 listings include, or one that the sold median describes? Do the medians on the page describe my street? What would I pay in taxes, insurance and upkeep if the sale takes another two months?
There is no single answer to any of these. They are the points where a public sale tends to produce uncertainty, and a direct offer can fix them in advance. An owner can compare the written terms of a direct offer with the likely range of a public listing, and choose the one that suits the home and the plan. Readers comparing markets can also read the North Raleigh brief and the Bald Head Island brief.
Source: Realtor.com series published by the Federal Reserve Bank of St. Louis as cited. The 17.5%, 10 day and 22.7% figures are this brief's arithmetic. The questions are this brief's general reasoning and not statements of any source.
What does a private sale change?
Maison Off-Market buys homes directly from their owners. It does not list a home, hold showings or put a home on a public listing. For a North Ridge owner, the five benefits are plain. There are no showings and no neighbors talking about the sale. The closing date can be flexible, which gives time to find a new home. There are no commission costs and no closing costs for the seller, and there are no inspections and repairs.
A little arithmetic shows what that is worth. Each 1% of a $360,000 sale is $3,600. A seller who gives up 3% gives up $10,800, and one who gives up 5% gives up $18,000. This brief does not claim that those are the costs of any sale, since the real figures depend on the agreement the seller signs. It shows how quickly a percentage becomes a sum, and how it compares with the 2.94% average discount and the 74-day wait on the page.
The benefits that matter most here are privacy and the date. A listing with 7.7 times the typical sale price attracts attention that an ordinary house does not want, and a wait of 74 days means 74 days of showings. A seller who sells directly can choose a closing date sixty or ninety days out and look for the next home without pressure, paying for one home at a time.
Maison Off-Market speaks only to sellers. An owner who wants to see what a direct offer would look like can use the contact form below, or call 401-219-4207, and ask for a figure with no showings, no listing and no obligation.
Source: Maison Off-Market. The fee figures are this brief's arithmetic and not claims about any sale.
Methodology and limitations
Prices, price per square foot, days on market, listing and rental counts, rents and the neighborhood and postal-area tables come from a national listing site page with key indicators as of September 2026. A second brokerage page for the larger North Raleigh area provides a March 2026 comparison. The sources cover different areas and months and are not independently verified.
Age, tenure, vacancy, income, rent and owner-estimated value come from the American Community Survey 2020-2024 five-year estimates for the postal-code area that includes North Ridge. The area is far larger than the neighborhood. Shares are calculated from published counts, and owner-estimated value carries a margin of error of $11,873.
Active listings and days on market are Realtor.com series published by the Federal Reserve Bank of St. Louis for the Raleigh metropolitan area. They describe the region and not the neighborhood. Implied earlier values are this brief's arithmetic from published percentage changes. The brief makes no forecast and values no home.
Conclusion
The North Ridge record shows a listing median of $2,785,000 beside a sold median of $360,000, 45 homes for sale, a 74-day wait and a table in which another neighborhood holds 472 homes. It describes a very small market in which a few homes decide the medians, and in which neither median is the price of an ordinary house.
It does not fix a price for any one home. The choice between a public listing and a private sale comes down to whether an owner would rather meet showings, inspections and a repair list or take privacy, a flexible closing date, no commission, no closing costs and no inspections or repairs. To see what a direct offer would look like for your home, use the contact form below or call 401-219-4207.
Frequently Asked Questions
What is the median home price in North Ridge?
Realtor.com reports a median listing price of $2,785,000 and a median sold price of $360,000 for September 2026. The two describe different homes.
How long do North Ridge homes take to sell?
Realtor.com reports a median of 74 days on market, up 12.12% on the year.
Is North Ridge a buyer's market?
Realtor.com calls it one, with homes selling 2.94% below asking and a sale-to-list ratio of 97%.
How many homes are for sale?
Realtor.com counts 45 active listings. Its neighborhood table lists 12 in North Ridge areas and 472 for the larger North Raleigh area.
Does a private sale always beat a public listing?
No. A public listing can attract competing bids. A private sale offers privacy, a flexible closing date, no commission, no closing costs and no inspections or repairs.
Compare your options before committing. Request a written private offer for your property, with no obligation, then weigh it against your listing plan.
Sources
- Realtor.com, 2026. North Ridge Neighborhood of Raleigh, NC Housing Market. https://www.realtor.com/local/market/north-carolina/raleigh/north-ridge.
- Redfin, 2026. North Raleigh, NC Housing Market. https://www.redfin.com/neighborhood/50826/NC/Raleigh/North-Raleigh/housing-market.
- U.S. Census Bureau, 2026. American Community Survey 2020-2024 five-year estimates, the North Ridge area (via Census Reporter). https://censusreporter.org/profiles/86000US27615-27615/.
- Realtor.com, 2026. Housing Inventory: Median Days on Market in Raleigh, NC (CBSA). https://fred.stlouisfed.org/series/MEDDAYONMAR39580.
- Realtor.com, 2026. Housing Inventory: Active Listing Count in Raleigh, NC (CBSA). https://fred.stlouisfed.org/series/ACTLISCOU39580.
Related research

Seller Guide · October 6, 2026
How to Prepare Point Pleasant Beach Rental Records Before Selling
Separate rental approval, income history and booked stays before comparing sale terms.

Seller Guide · October 6, 2026
How to Prepare Rumson Flood and Waterfront Records Before Selling
Separate flood disclosure, elevation, repairs and waterfront rights before comparing sale terms.

Seller Guide · October 6, 2026
How to Prepare Sarasota Condo Inspection and Reserve Records Before Selling
Separate building condition, reserve funding and resale documents before comparing sale terms.