Market Brief · by Aidan Sowa · October 5, 2026
Is Morningside a Moderate Neighborhood or a Very Expensive One? Reading a Median Built on Very Few Sales, Sales Counts and Price Ranges
Reading a Median Built on Very Few Sales, Sales Counts and Price Ranges for Morningside, FL, with each source dated and its limits noted, for owners weighing a listing against a direct sale.
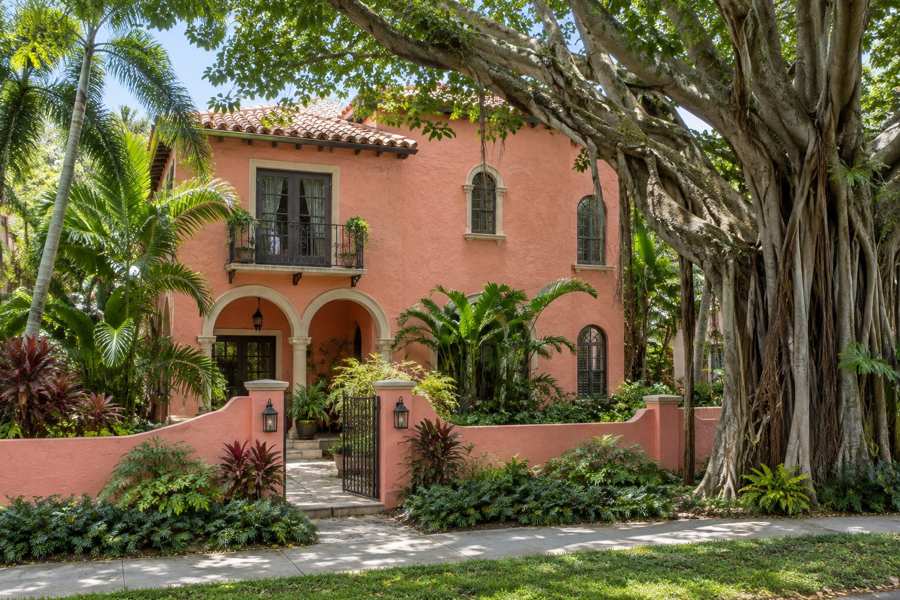
Is Morningside an $818,750 neighborhood or a $2,978,550 one? Both figures sit on public pages and both describe Morningside, the historic bayfront neighborhood of Miami. A market-data page shows a median closing price of $818,750 for the past year. A brokerage page shows an average selling price of $2,978,550 across 20 sales. The second figure is 3.6 times the first. The difference is not an error. One rests on two sales and the other on twenty, and they use different statistics.
The sources do not agree on how many homes sold. The market-data page counts 2 sales in the last year. A brokerage page counts 20. Another brokerage counts 23 home sales, with $65,816,000 in total and an average of $2,861,565. Redfin's page has a median sale of $2,000,000 on 5 homes sold in a single month, May 2025, which makes it 16 months old. One page gives two different price ranges for the same neighborhood within a few lines.
A fifth source is different in kind. In September 2026 The Real Deal reported that a Morningside waterfront home sold off-market for a reported $24.1 million, a year after it sold for a reported $16 million. This brief reports what the article says and nothing beyond it. Maison Off-Market buys luxury homes and estates directly from their owners and speaks only to sellers. We do not estimate what any home is worth, and nothing here is a valuation. Every figure is attributed, every calculation is labeled as this brief's arithmetic and every inference is called an inference.
Key Findings
- A brokerage page with MLS figures as of August 2026 counted 20 sales in the past year at an average asking price of $3,311,900 and an average selling price of $2,978,550, a list-to-sell ratio of 90%, $1,048 per square foot and 113 days to sell (BEX Realty, Morningside).
- A second brokerage, updated September 2026, counted 23 home sales in twelve months, $65,816,000 in closed sales and an average selling price of $2,861,565 at $1,076 per square foot. It listed 2 condos and 12 homes and lots for sale at prices from $440,000 to $7,900,000 (Zilbert, Morningside).
- A market-data page for the Morningside subdivision, updated August 2026, showed a median closing price of $818,750 on 2 sales in the last year and a median listing price of $1,250,000 on 3 listings, with 105 days on market (Subdivisions.com, Morningside market trends).
- Redfin's neighborhood page showed a median sale price of $2,000,000, down 2.4% on the year, on 5 homes sold in May 2025, with 138 days on market. Its recently sold homes are dated 2025, so the page is about a year and a half old (Redfin, Morningside housing market).
- The Real Deal reported on September 24, 2026 that a waterfront Morningside home sold in an off-market deal for a reported $24.1 million, against a reported $16 million paid the year before (The Real Deal, Morningside record).
- The Census shows a postal area with 28,980 residents and 14,384 housing units, of which 52.2% of the occupied homes are rented (Census Reporter, American Community Survey profile).
Why do the Morningside sales counts differ, 2, 20 and 23?
Start with the counts. The Zilbert page counts 23 closed home sales in twelve months, which worked out to $65,816,000, an average of $2,861,565. This brief checks the division: $65,816,000 over 23 is $2,861,565. The BEX page counts 20 sales at an average of $2,978,550. The two averages are $116,985 apart, which is 3.9% of the higher figure and is this brief's arithmetic. For two pages that cover the same neighborhood, that is close. The three-sale difference could come from the dates, from a different boundary or from one page counting a type of sale that the other leaves out.
The Subdivisions.com page is the outlier, with 2 sales and a median of $818,750. It describes itself as a subdivision page, and the web address names a single numbered subdivision. This brief infers that it covers one platted subdivision inside the wider neighborhood and not the neighborhood itself. That would explain the count and the price. It means the page's median describes two sales and says nothing about the other 20 or so.
The Pure Equity page shows how thin sold records can be. It lists two recently sold properties, both multi-family, at $979,000 and $950,000, and says that properties are priced from $3,200,000 to $6,800,000. A few lines later the same page gives current prices from $1,099,000 to $6,380,000 and a median list price of about $1,324,500. Two ranges for the same place, a low end of $3,200,000 and a low end of $1,099,000, do not describe the same set of homes. This brief reads the page as a template that mixes data from different dates and does not rely on it.
The practical point for an owner is simple. A median of two sales, an average of twenty and an average of twenty-three are three different reliability levels. A seller who hears the number $818,750 should ask how many sales it rests on. The answer is two.
Why do medians and averages differ so much here?
The brokerage pages report averages and the other pages report medians. In a neighborhood with a few very large sales, the average sits well above the median. The BEX average of $2,978,550 and the Redfin median of $2,000,000, on a page from 2025, are 1.49 times apart, and this brief cannot tell how much of that is the statistic and how much is the year. Neither page gives both measures for the same period, so the difference cannot be separated.
The list side shows the spread. The Zilbert page lists 12 homes and lots with prices from $2,000,000 to $15,900,000, and 2 one-bedroom condominiums at $440,000 and $465,000. Four of the 12 are home sites, or lots, not houses. The other 8 are houses with listed sizes, and their list prices are $7,900,000, $6,380,000, $5,950,000, $4,500,000, $3,500,000, $2,895,000, $2,390,000 and $2,000,000. The median of those eight is $4,000,000, which is this brief's arithmetic.
That is 3.0 times the Pure Equity median list price of $1,324,500. It is also 1.34 times the BEX average selling price of $2,978,550. The houses on the market today are priced above the houses that sold over the past year, which suggests that the recent sales were of smaller or less expensive homes, or that owners are asking for more than buyers have paid. The pages do not say which, and this brief offers both as possibilities.
The price per square foot adds a second view. The listed houses run from $760 to $1,484 per square foot. The BEX page reports $1,048 for sales and the Zilbert page reports $1,076. The Redfin page reports $1,540 for May 2025 on five sales. A home that lists at $1,484 per square foot is 38% above the Zilbert sold figure, which is this brief's arithmetic.
What does the $24.1 million off-market sale tell an owner?
The Real Deal reported that a waterfront home on a nearly one-acre lot sold to an undisclosed trust for a reported $24.1 million, according to sources. It reported that the same home had sold for $16 million the year before. The increase is $8.1 million, which is a rise of 50.6%. The agents on the buyer's side said the sale was off-market, that the seller had no intention of selling and that they negotiated for months. They said the buyer plans to build a new house on the property.
The article adds that a lack of inventory of waterfront land and homes has pushed a number of buyers' agents to reach out to potential sellers. It also says the earlier sale of that home in 2025 set a record for Morningside, exceeding a waterfront purchase of $14 million in 2021. These are statements by the article and its sources. This brief did not verify the price, which is described as reported, and the article is the only source for it.
What can an owner take from it? One narrow point and one caution. The narrow point is that at least one large Morningside sale in 2026 did not go through a public listing, and the article says buyers' agents are approaching owners directly. A public listing is one route to a buyer and not the only one. The caution is that a record sale of a nearly one-acre waterfront lot says little about a smaller house on a dry street. This brief does not claim that any other home would reach a similar price.
It also shows how far the headline averages sit from the top of the market. The reported $24.1 million is 8.1 times the BEX average selling price, and 8.4 times the Zilbert average, both of which are this brief's arithmetic. One sale of that kind would move the average of a 23-sale year by over a million dollars, which is why averages in a market like this are unstable.
What does the Redfin page show, and how old is it?
The Redfin page says the median sale price in Morningside was $2,000,000 last month, down 2.4% on the year, and that the median price per square foot was $1,540, up 121.6%. It reports that 5 homes sold in May and that homes sold after a median of 138 days on market, against 139 a year earlier. Its list of recently sold homes shows a sale in June 2025 at $1,475,000, 13% under the list price, after 124 days.
The page says last month, but its sold homes are from 2025. This brief infers that the copy read for this brief is a snapshot from mid 2025, which makes it the oldest of the figures here. A price per square foot that rose 121.6% on a base of a handful of sales shows how little a one-month figure can say. The page also says that homes in Morningside sell about 6% below the list price in about 62 days, with a separate figure of 176 days for a different group of homes. The page does not say which group.
Redfin's competition score, as the page describes it, is not very competitive. Taken together, the page describes a slower market than its headline suggests, and that is consistent with the 113 days the BEX page reports for the past year. It is not consistent with a market where a house is gone in weeks. For a seller on a public listing, the figures in the pages point to a wait of roughly four months.
What does the Census say about the area?
The Census profile for the postal area gives a population of 28,980 and 14,384 housing units, of which 12,571 are occupied and 1,813 are vacant, a vacancy rate of 12.6%. Of the occupied homes, 6,015 are owner-occupied, or 47.8%, and 6,556 are rented, or 52.2%. A majority of occupied homes are rentals, which reflects the apartment buildings along the boulevard and the lower-rise streets on either side of it. That reading is an inference.
Median household income is $75,051, median gross rent is $1,611 and the median value of an owner-occupied home is $784,700, with a margin of error of $86,375. The Redfin median of $2,000,000 is 2.55 times that Census value, and the BEX average is 3.8 times, both of which are this brief's arithmetic. The postal area is much larger than the historic neighborhood and includes apartments and older bungalows, so the Census value describes a different group of homes.
A neighborhood profile from RE/MAX gives a more local picture. It shows a median household income of $71,246 and a housing mix of 41.7% single detached homes, 7.2% small apartment buildings and 51.1% large apartment buildings (RE/MAX, Morningside and Bay Shore guide). Half of the homes in its area are in large buildings, which supports the reading that the Census vacancy and tenure figures are driven by apartments.
The housing is old. The median year built is 1970. Homes built before 1960 are 6,067 of the 14,384 units, or 42.2%, and the 1950s is the largest decade with 2,999 homes. Those figures are for the postal area. The neighborhood's historic core is older still, and a house there may carry preservation rules that a buyer will weigh. Whether any particular home does is a question for its owner and for the city, and the pages read for this brief do not say.
| Source | Figure | Date and sample |
|---|---|---|
| Subdivisions.com: median closing | $818,750 | Two sales, year to August 2026 |
| Redfin: median sale | $2,000,000 | Five sales, May 2025 |
| Zilbert: average selling price | $2,861,565 | 23 sales, twelve months to September 2026 |
| BEX Realty: average selling price | $2,978,550 | 20 sales, year to August 2026 |
| The Real Deal: waterfront sale, reported | $24,100,000 | Reported September 2026 |
Source: the five pages as cited. The 3.6 times, 3.9% and 8.1 times figures are this brief's arithmetic. The reading of the Redfin date is this brief's inference. Commercial content; not independently verified.
What do the Miami-Dade and Miami series add?
Realtor.com publishes county series through the Federal Reserve Bank of St. Louis. The Miami-Dade median days on market was 83 in May and 87 in September, up 4.8% (Realtor.com, days on market). Active listings were 17,140 in May and 17,010 in September, down 0.8% (Realtor.com, active listings). The county median listing price moved from $595,000 to $589,000, down 1.0% (Realtor.com, median listing price). These percentages are this brief's arithmetic.
The count of homes with a price reduction was 3,312 in March and 2,924 in July (Realtor.com, price reduced count). The July count is 17.7% of the 16,534 active listings that month. A real estate firm's statistics page reports that in the city of Miami 39.8% of houses for sale had cut their asking price as of October 5, with a median cut of 4.6%, or $46,000, and that the median house sold for $700,000 in September (PB Prime Real Estate, Miami statistics). The two measures differ in area and in method, so they should not be compared closely.
Morningside's own list prices are far above both. The Zilbert page's median list price for houses, by this brief's arithmetic, is $4,000,000, which is 5.7 times the city's median house sale of $700,000. In the Zilbert table, 4 of the 12 homes and lots show a price cut and 2 show an increase, and both condominiums show small cuts. A reader can take from it that cuts are common but not universal.
These are county and city figures, not Morningside figures, and the series titles were checked on their series pages. Readers comparing markets can also read the Coral Ridge South brief and the Upper Eastside brief.
Source: Realtor.com series published by the Federal Reserve Bank of St. Louis and the firm's page as cited. The 4.8%, 0.8%, 1.0%, 17.7% and 5.7 times are this brief's arithmetic. The series names were checked against the series pages.
What should an owner ask, and what does a private sale change?
Ask how many sales sit behind any figure. Ask whether it is a median or an average, since the two can differ by a million dollars in a market like this. Ask whether it covers the historic neighborhood, a subdivision or a postal area, and ask for the date. Ask whether the home is a house, a lot or a condominium, since the Zilbert page lists all three at prices from $440,000 to $15,900,000.
A private sale changes how a home reaches a buyer. With Maison Off-Market there are no showings and no neighbors talking about a sale, the closing date can be flexible so that an owner has time to find a new home, there are no commission costs, there are no closing costs and there are no inspections or repairs. The Real Deal's report shows that off-market sales happen in Morningside, and says nothing about whether they bring a higher or lower price. This brief does not claim that a private sale always brings a higher price than a public listing.
Fee arithmetic shows why the commission point matters, without assuming any rate. Each 1% of a sale price is about $8,188 at $818,750, $20,000 at $2,000,000 and $29,786 at $2,978,550. At 3% those amounts are about $24,563, $60,000 and $89,357. At 5% they are about $40,938, $100,000 and $148,928. These are illustrations of what a percentage means on each of the figures in this brief, and they are not a statement of what any agent charges or what any sale would cost.
If you are weighing a sale of a Morningside home, one conversation costs nothing and obliges you to nothing. We ask about the home, the timing you would like and what you would need from a buyer, and we say plainly whether a private sale fits.
If you would like a private, no-obligation offer for a Morningside home, call 401-219-4207 or use the contact form on this site.
Methodology and limitations
Prices, sales counts, days on market and listing counts come from two brokerage pages with figures to August and September 2026, a market-data page for a single subdivision updated August 2026, Redfin's neighborhood page with data from May 2025, a trade news article of September 24, 2026 and a real estate firm's statistics page dated October 5, 2026. The sources cover different areas and periods, and most are commercial pages, so they are not independent.
Census figures come from the American Community Survey 2020-2024 five-year estimates for the postal area, through Census Reporter. County series are Realtor.com data published by the Federal Reserve Bank of St. Louis for Miami-Dade County, Florida, and the series titles were checked on the series pages. Percentages, gaps, ratios and fee amounts are this brief's own arithmetic and are labeled as such. Where a reading goes beyond what a page says, it is called an inference. No names of sellers, agent contact details or street addresses from the pages are reproduced.
Conclusion
The Morningside record shows an $818,750 median on two sales, an average of $2,861,565 on 23, an average of $2,978,550 on 20, a Redfin median of $2,000,000 that is more than a year old and a reported $24.1 million off-market sale of one waterfront home. Half of the occupied homes in the surrounding postal area are rented, and 42.2% of all units were built before 1960.
It does not fix a price for any one home. The choice between a public listing and a private sale comes down to whether an owner would rather meet showings, price cuts and a public clock, or sell quietly on a date that suits them. Maison Off-Market speaks only to sellers, and a conversation costs nothing.
Frequently Asked Questions
What is the median home price in Morningside, Miami?
It depends on the source and the sample. One page shows a median closing of $818,750 on two sales. Two brokerages show average selling prices of $2,861,565 and $2,978,550 on 23 and 20 sales. Redfin shows $2,000,000 on a page from 2025.
How long do Morningside homes take to sell?
BEX Realty reports 113 days on average for the past year. Subdivisions.com shows 105 days for its subdivision. Redfin shows a median of 138 days for May 2025.
Do Morningside homes sell off-market?
The Real Deal reported in September 2026 that a waterfront home sold in an off-market deal for a reported $24.1 million. The article says buyers agents have been approaching owners directly because there is little waterfront inventory.
Why are there so many different numbers?
The pages count different areas, different sales and different statistics. Two pages count 20 and 23 sales, another counts 2, and some use medians while others use averages.
What is the difference between a private sale and a public listing?
A private sale with Maison Off-Market has no showings, a flexible closing date, no commission costs, no closing costs and no inspections or repairs. A public listing exposes the home to a wider group of buyers. This brief does not claim either always gets a higher price.
Compare your options before committing. Request a written private offer for your property, with no obligation, then weigh it against your listing plan.
Sources
- BEX Realty, 2026. Morningside Homes for Sale in Miami, FL. https://www.bexrealty.com/real-estate/Miami/Morningside/.
- Zilbert, 2026. Morningside Homes for Sale, Miami. https://www.zilbert.com/fl/miami/morningside.
- Subdivisions.com, 2026. Morningside Real Estate Micro-Market Trends. https://subdivisions.com/miami-fl/morningside-1-properties-for-sale/market-trends.
- Redfin, 2025. Morningside Housing Market, Miami. https://www.redfin.com/neighborhood/56226/FL/Miami/Morningside/housing-market.
- The Real Deal, 2026. Name your price: a waterfront teardown in Morningside sells for $24M. https://therealdeal.com/miami/2026/09/24/david-simkins-flips-miami-home-for-morningside-record/.
- U.S. Census Bureau, 2026. American Community Survey 2020-2024 five-year estimates, the Morningside area (via Census Reporter). https://censusreporter.org/profiles/86000US33138-33138/.
- RE/MAX, 2026. Morningside and Bay Shore, Miami Housing Market Guide. https://www.remax.com/neighborhoods/morningside-bay-shore-real-estate-guide-g10_dhwfzmsm.
- Realtor.com, 2026. Housing Inventory: Median Days on Market in Miami-Dade County, FL. https://fred.stlouisfed.org/series/MEDDAYONMAR12086.
- Realtor.com, 2026. Housing Inventory: Active Listing Count in Miami-Dade County, FL. https://fred.stlouisfed.org/series/ACTLISCOU12086.
- Realtor.com, 2026. Housing Inventory: Median Listing Price in Miami-Dade County, FL. https://fred.stlouisfed.org/series/MEDLISPRI12086.
- Realtor.com, 2026. Housing Inventory: Price Reduced Count in Miami-Dade County, FL. https://fred.stlouisfed.org/series/PRIREDCOU12086.
- PB Prime Real Estate, 2026. Miami Real Estate Statistics 2026. https://www.pbprealestate.com/miami-real-estate-statistics/.
Related research

Seller Guide · October 6, 2026
How to Prepare Point Pleasant Beach Rental Records Before Selling
Separate rental approval, income history and booked stays before comparing sale terms.

Seller Guide · October 6, 2026
How to Prepare Rumson Flood and Waterfront Records Before Selling
Separate flood disclosure, elevation, repairs and waterfront rights before comparing sale terms.

Seller Guide · October 6, 2026
How to Prepare Sarasota Condo Inspection and Reserve Records Before Selling
Separate building condition, reserve funding and resale documents before comparing sale terms.