Market Brief · by Aidan Sowa · October 5, 2026
Is Coral Ridge South a Moderate Market or a Very Expensive One? Reading Dry Lot and Waterfront Medians and Sales Counts
Reading Dry Lot and Waterfront Medians and Sales Counts for Coral Ridge South, FL, with each source dated and its limits noted, for owners weighing a listing against a direct sale.
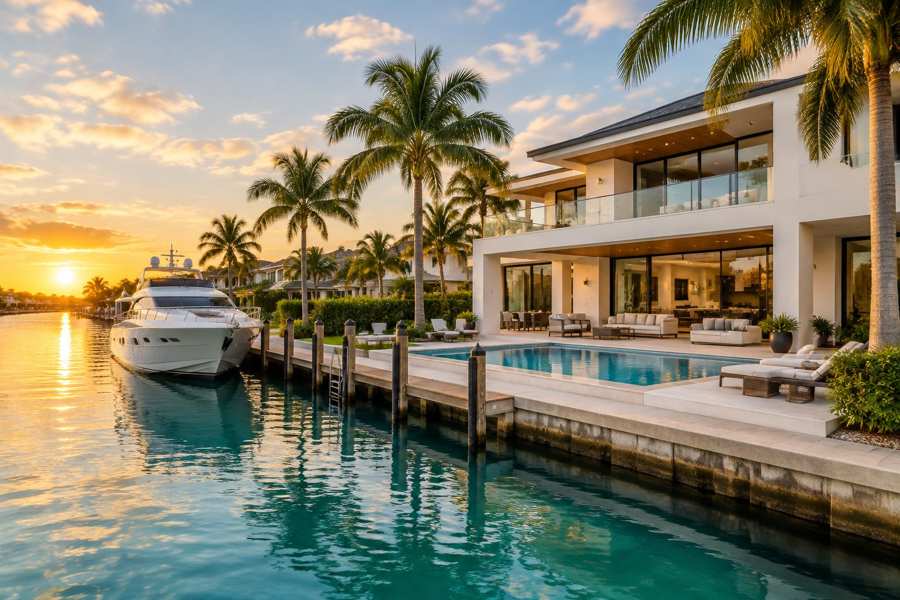
Is Coral Ridge South a $1,532,500 market or a $3,800,000 market? Both numbers describe sales in the Coral Ridge area of Fort Lauderdale in 2026. Realtor.com shows a median sold price of $1,532,500 for August. A local brokerage shows a median of $3,800,000 for waterfront homes sold in the first half of the year and $1,507,500 for homes on dry lots. A tracker of recorded closings shows $1,900,000 over twelve months. The waterfront figure is 2.5 times the dry lot figure, and both are called Coral Ridge.
The name needs a note. Coral Ridge South is the name used in this series for the part of the Coral Ridge area that shares a postal area with Wilton Manors. None of the public pages read for this brief gives Coral Ridge South its own statistics. They report Coral Ridge as a whole, and the Realtor.com page lists nearby places such as Coral Ridge North and South Coral Point as separate rows. So this brief uses the Coral Ridge figures and says so wherever it matters. A seller of a home south of the golf course should treat them as the nearest public record, not as a measure of one street.
Maison Off-Market buys luxury homes and estates directly from their owners and speaks only to sellers. We do not estimate what any home is worth, and nothing here is a valuation. Every figure is attributed, every calculation is labeled as this brief's arithmetic, and every inference is called an inference.
Key Findings
- Realtor.com's page, with indicators as of August 2026, showed a median listing price of $1,812,500 (up 1.27%), a median sold price of $1,532,500 (down 2.70%), $808 per square foot, 110 homes for sale (down 8.59%), a median of 77 days on market (down 24.56%) and a sale-to-list ratio of 93%. It called the market a buyer's market (Realtor.com, Coral Ridge market data).
- A tracker of recorded closings counted 24 sales in the twelve months to August 10, 2026, with a median sold price of $1,900,000 (down 20.0% on the prior year), $747 per square foot, 69 days to sell and sales at a median of 93.1% of the original asking price. Its history table runs from 2012 (Move With Momentum, Coral Ridge home values).
- A brokerage's mid-year report split sales into dry lots and waterfront homes. Year to date through June, 48 dry lot homes sold at a median of $1,507,500 and 14 waterfront homes sold at a median of $3,800,000. In mid-July it counted 25 waterfront listings at a median list price of $7,100,000 and 20 dry lot listings at $3,650,000 (Williams Group, first half of 2026).
- A local agent's article argued that the Coral Ridge median measures four different neighborhoods at once. It cited a July 2026 median sale price of about $1,474,497, up about 34%, and said Bayview Drive divides homes on deep canals with ocean access from homes without a dock (Tim Elmes, Coral Ridge median price).
- Homes.com's neighborhood guide showed an average value of $1,625,836 and $720 per square foot, and said the neighborhood spans three postal areas (Homes.com, Coral Ridge neighborhood guide).
- The Census shows a postal area with a median owner-occupied home value of $640,400, which is 42% of the Realtor.com sold median, and a median household income of $92,485 (Census Reporter, American Community Survey profile).
Why do dry lot and waterfront homes tell different stories?
The brokerage report is the clearest picture of the divide. For the second quarter of 2026 it listed 30 dry lot sales with a median of $1,507,500 and 8 waterfront sales with a median of $3,275,000. For the year to June it listed 48 dry lot sales and 14 waterfront sales. The year-to-date waterfront median was $3,800,000, which is 2.52 times the dry lot median of $1,507,500. That ratio is this brief's arithmetic.
The listing side is wider still. In mid-July the report counted 25 waterfront listings with a median list price of $7,100,000 and an average of 153 days on market, and 20 dry lot listings with a median of $3,650,000 and an average of 165 days. Compare each with the year's sold median and the asking prices are 1.87 times the waterfront sold median and 2.42 times the dry lot sold median. Those ratios compare listings with a different group of sales, so they are not a measure of discounts. They do show that the homes on the market now are priced far above the homes that sold earlier in the year, which is a pattern a seller will want to understand.
The local agent's article explains the divide in physical terms. East of Bayview Drive, it says, homes sit on deep, wide canals with no fixed bridges and direct ocean access. West of the drive, the homes have a Coral Ridge address near the golf course and the beach but no dock. The article estimates the east side's median sale near $2,400,000 as of late June, with 142 days on market. This brief gives that figure little weight, because the article does not name the data behind it.
For an owner, this means that the neighborhood median is the wrong comparison for almost any home. A waterfront home is compared with other waterfront homes, and a dry lot home with other dry lot homes. A median that blends both, such as Realtor.com's $1,532,500 and the tracker's $1,900,000, is a blend of two different markets with very different buyers.
Which page counts the sales correctly?
The brokerage report opens by saying that 38 homes sold during the first six months of 2026, compared with 16 during the same period in 2025, an increase of 137%. The report's own tables then show 8 waterfront and 30 dry lot sales for the second quarter, which add up to 38, and 14 waterfront and 48 dry lot sales for the year to date, which add up to 62. This brief infers that the 38 in the opening line is the second quarter count and not the half-year count. It is an inference, since the page does not say so.
The difference matters for the trend. If 62 homes sold in the first half of 2026 and the page's comparison number from 2025 is 16, the increase would be 287.5%, not 137%. The page's own percentages for the year-to-date table show dry lot sales up 167% and waterfront sales down 26%, so the 2025 base in that table is about 18 dry lot sales and about 19 waterfront sales. This brief cannot reconcile all of these from the page alone, and does not try to. The honest reading is that sales rose sharply for dry lots in 2026, and that the exact count depends on which line of the report you quote.
The tracker counts differently again: 24 recorded closings in the twelve months to August 10, 2026, and 19 in 2025. Those are far below the brokerage's 62 sales in six months. The tracker's own page describes its numbers as recorded closings, and it does not say which homes it includes. This brief infers that the two cover different sets of homes, for example a core neighborhood against a wider area, and cannot say which is right.
Three counts, 24 in twelve months, 38 in a quarter and 62 in six months, differ by a factor of more than two. A seller who reads one is reading one definition of Coral Ridge, and should ask which streets it covers.
What does 15 years of recorded prices show?
The tracker's history table runs from 2012. The median sold price was $584,200 on 21 sales in 2012 and $1,127,500 on 56 sales in 2021. It rose to $1,775,000 on 30 sales in 2022 and $2,425,000 on 13 sales in 2023, peaked at $2,792,173 on 23 sales in 2024 and was $2,375,000 on 19 sales in 2025. The latest twelve months show $1,900,000 on 24 sales.
Measured from the 2024 peak, the latest median is down 32.0%. Measured from 2012, it is 3.25 times higher. Both percentages are this brief's arithmetic. The page itself says the trailing twelve month median is down 20.0% from the prior twelve months, which were $2,380,000. All three statements are true and they answer different questions, which is one more reason to read the base year before the percentage.
The count of sales moves as much as the price. Annual sales ranged from 13 to 56, and the latest twelve months, at 24, are 43% of the 2021 level. The page warns that with about 25 sales a year a single closing can swing the median. This is the central fact about a high-priced neighborhood: a few large sales set the headline, and a 20% fall in the median can come from two or three sales that happened to be smaller.
The tracker also shows that sellers accepted a median of 93.1% of the original asking price in the latest window, against 86.6% in 2025 and 97.2% in 2022. The ratio is measured against the first asking price, so it includes every cut. Realtor.com's sale-to-list ratio of 93% for August, with homes selling 7.14% below the current asking price, is measured against the price after cuts, which makes the two figures hard to compare. They are close in value and different in meaning.
What does the Realtor.com community table show?
The Realtor.com page lists named areas with a count of homes for sale. Lauderdale Beach has 102 homes for sale and a median listing price of $702,000. Coral Ridge Galt has 52 at $1,712,250. Dolphin Isles has 27 at $436,750. Birch Park Finger Streets has 15 at $2,750,000, Beach Way Heights has 14 at $3,275,000 and Bal Harbour has 8 at $3,290,000. The table also lists Coral Ridge North with 9, Coral Shores and Livermore Estates with 8 each, Embassy Tower Condominium with 6, Laudergate and North Bal Harbour with 3 each and South Coral Point with 1.
These counts add up to 256 homes, which is 2.3 times the page's headline count of 110. Lauderdale Beach alone has 102, or 92.7% of the headline. This brief infers that the table includes areas outside the neighborhood boundary used for the headline, such as the beachfront condominium strip, and it cannot say more because the page does not give the boundaries. The highest median in the table, $3,290,000, is 7.5 times the lowest, $436,750. All of these figures are this brief's arithmetic.
A seller should read the table as a list of nearby places and not as a breakdown of the headline. The finger streets, which are the narrow canal lots, show a median of $2,750,000. Beach Way Heights shows $3,275,000. The beachfront condominiums show $702,000. A home in the golf and canal part of the neighborhood has little in common with a one-bedroom unit near the beach, and the table shows why one median cannot serve both.
Source: Realtor.com as cited. The 256, 2.3 times, 92.7% and 7.5 times are this brief's arithmetic. The reading of the boundary is this brief's inference. Commercial content; not independently verified.
What does the Census say, and why is it so different?
The Census profile for the postal area gives a median owner-occupied home value of $640,400, with a margin of error of $44,025. Realtor.com's sold median of $1,532,500 is 2.39 times that. The tracker's $1,900,000 is 2.97 times. The postal area includes Wilton Manors, which has a much lower median, and a large number of condominiums and older mid-century homes, so the Census value describes a different and wider group of homes than the Coral Ridge pages. That reading is an inference.
Median household income in the postal area is $92,485. The Realtor.com sold median is 16.6 times that income, and the Census home value is 6.9 times. Both ratios are this brief's arithmetic and they compare a neighborhood price with an area-wide income, so they are a rough guide only. They suggest that buyers at the Coral Ridge price level are not drawn from the households of the surrounding area, which fits the brokerage's description of a more intentional buyer drawn to the waterfront.
The area is largely older. The median year of construction is 1974, 65.0% of the postal area's 8,654 homes were built before 1980, and the 1950s is the largest decade, with 2,285 homes. The tracker's own neighborhood page gives a median build year of 1963 for the community, with homes built between 1946 and 2024. For an owner, that means many Coral Ridge homes were built or rebuilt long before current construction standards, and buyers often price a teardown or a rebuild. That is a general observation and not a measured one.
| Source and area | Figure | Date |
|---|---|---|
| Realtor.com: median sold | $1,532,500 | August 2026 |
| Local article: median sale, broader area | $1,474,497 | July 2026 |
| Brokerage: dry lot median sale | $1,507,500 (48 sales) | Year to June 2026 |
| Tracker: median sold | $1,900,000 (24 closings) | Twelve months to August 2026 |
| Brokerage: waterfront median sale | $3,800,000 (14 sales) | Year to June 2026 |
| Tracker: 2024 median sold | $2,792,173 (23 sales) | Calendar 2024 |
Source: the pages as cited. Commercial content; not independently verified.
What do the Broward County series add?
Realtor.com publishes county series through the Federal Reserve Bank of St. Louis, and Broward County covers Coral Ridge along with much cheaper markets. The county median days on market rose from 77 in April to 85 in August, up 10.4% (Realtor.com, days on market). Realtor.com's Coral Ridge median of 77 days in August is eight days faster than the county, though the neighborhood page gives a fall of 24.56% on the year, so the neighborhood sped up while the county slowed.
Active listings in the county fell from 15,476 in April to 14,270 in August, down 7.8% (Realtor.com, active listings). The county median listing price was $380,000 in both May and September (Realtor.com, median listing price), which is 21% of the neighborhood's median listing price of $1,812,500. The Coral Ridge median is 4.8 times the county's. All of these percentages and ratios are this brief's arithmetic.
The count of homes with a price reduction in the county was 3,810 in April and 3,372 in August (Realtor.com, price reduced count). That is 23.6% of active listings in August. The county series gives the background for a seller. It does not replace the neighborhood figures, because the neighborhood's price level and mix are not the county's. Readers comparing markets can also read the Wilton Manors brief and the Morningside brief.
Source: Realtor.com series published by the Federal Reserve Bank of St. Louis as cited. The 10.4%, 7.8%, 21%, 4.8 times and 23.6% are this brief's arithmetic. The series names were checked against the series pages.
What should an owner ask, and what does a private sale change?
Ask whether the home is waterfront or dry lot, east or west of the dividing street, and which of the several areas called Coral Ridge it falls in. Ask how many sales sit behind any figure, since 24 sales in a year is a small sample for a median. Ask whether the price is a sold price or a list price, and ask for the date, because the brokerage report, the tracker and the portal use different periods.
A private sale changes how a home reaches a buyer. With Maison Off-Market there are no showings and no neighbors talking about a sale, the closing date can be flexible so that an owner has time to find a new home, there are no commission costs, there are no closing costs and there are no inspections or repairs. For a waterfront estate, where the brokerage report shows listings sitting about 153 days, the first of those features is the one many owners notice. This brief does not claim that a private sale always brings a higher price than a public listing.
Fee arithmetic shows why the commission point matters, without assuming any rate. Each 1% of a sale price is $15,325 at $1,532,500, $19,000 at $1,900,000 and $38,000 at $3,800,000. At 3% those amounts are $45,975, $57,000 and $114,000. At 5% they are $76,625, $95,000 and $190,000. These are illustrations of what a percentage means on each of the figures in this brief, and they are not a statement of what any agent charges or what any sale would cost.
If you are weighing a sale of a home in Coral Ridge, one conversation costs nothing and obliges you to nothing. We ask about the home, the timing you would like and what you would need from a buyer, and we say plainly whether a private sale fits.
If you would like a private, no-obligation offer for a Coral Ridge South home, call 401-219-4207 or use the contact form on this site.
Methodology and limitations
Median prices, days on market, sale-to-list ratios and listing counts come from Realtor.com's neighborhood page with indicators as of August 2026, a tracker's recorded-closings history to August 10, 2026, a brokerage mid-year report for 2026, a local agent's article, and Homes.com's neighborhood guide. The sources cover different areas and periods, and most are commercial pages, so they are not independent. None gives Coral Ridge South its own statistics.
Census figures come from the American Community Survey 2020-2024 five-year estimates for the postal area, through Census Reporter. County series are Realtor.com data published by the Federal Reserve Bank of St. Louis for Broward County, Florida, and the series titles were checked on the series pages. Percentages, gaps, ratios and fee amounts are this brief's own arithmetic and are labeled as such. Where a reading goes beyond what a page says, it is called an inference. No agent contact details or street addresses from the pages are reproduced.
Conclusion
The Coral Ridge record shows a sold median of $1,532,500 on one page and $1,900,000 on another, a dry lot median of $1,507,500 and a waterfront median of $3,800,000, a tracker median that is 32% below its 2024 peak, and sales counts of 24, 38 and 62 that depend on whose definition of the area you use. The neighborhood table on Realtor.com sums to 2.3 times its headline.
It does not fix a price for any one home. The choice between a public listing and a private sale comes down to whether an owner would rather meet showings, price cuts and a public clock, or sell quietly on a date that suits them. Maison Off-Market speaks only to sellers, and a conversation costs nothing.
Frequently Asked Questions
What is the median home price in Coral Ridge?
It depends on the source and the type of home. Realtor.com shows a sold median of $1,532,500 for August 2026. A tracker shows $1,900,000 for twelve months. A brokerage shows $1,507,500 for dry lots and $3,800,000 for waterfront homes for the year to June.
How long do Coral Ridge homes take to sell?
Realtor.com shows a median of 77 days on market for August 2026. The tracker shows 69 days. A brokerage shows an average of 153 days for waterfront listings and 165 for dry lot listings in mid-July.
Is there separate data for Coral Ridge South?
Not on the pages read for this brief. They report Coral Ridge as a whole, and Realtor.com lists nearby places such as Coral Ridge North and South Coral Point as separate rows.
Why do the sales counts differ?
The tracker counted 24 closings in twelve months. A brokerage page says 38 homes sold in six months, but its own tables show 38 in the second quarter and 62 for the year to June. The pages cover different sets of homes.
What is the difference between a private sale and a public listing?
A private sale with Maison Off-Market has no showings, a flexible closing date, no commission costs, no closing costs and no inspections or repairs. A public listing exposes the home to a wider group of buyers. This brief does not claim either always gets a higher price.
Compare your options before committing. Request a written private offer for your property, with no obligation, then weigh it against your listing plan.
Sources
- Realtor.com, 2026. Coral Ridge, Fort Lauderdale Housing and Rental Market. https://www.realtor.com/local/market/florida/fort-lauderdale/coral-ridge.
- Move With Momentum, 2026. Coral Ridge Home Values, Fort Lauderdale. https://movewithmomentum.com/home-value/coral-ridge-fort-lauderdale.
- Williams Group, 2026. Coral Ridge Real Estate Market: A Strong First Half for 2026. https://www.williamsgroupftl.com/coral-ridge-real-estate-market-a-strong-first-half-for-2026/.
- Tim Elmes, 2026. Coral Ridge's Median Price Is Measuring Four Different Neighborhoods at Once. https://timelmes.com/blog/coral-ridges-median-price-is-measuring-four-different-neighborhoods-at-once.
- Homes.com, 2026. Coral Ridge Neighborhood Guide. https://www.homes.com/local-guide/fort-lauderdale-fl/coral-ridge-neighborhood/.
- U.S. Census Bureau, 2026. American Community Survey 2020-2024 five-year estimates, the Coral Ridge South area (via Census Reporter). https://censusreporter.org/profiles/86000US33305-33305/.
- Realtor.com, 2026. Housing Inventory: Median Days on Market in Broward County, FL. https://fred.stlouisfed.org/series/MEDDAYONMAR12011.
- Realtor.com, 2026. Housing Inventory: Active Listing Count in Broward County, FL. https://fred.stlouisfed.org/series/ACTLISCOU12011.
- Realtor.com, 2026. Housing Inventory: Median Listing Price in Broward County, FL. https://fred.stlouisfed.org/series/MEDLISPRI12011.
- Realtor.com, 2026. Housing Inventory: Price Reduced Count in Broward County, FL. https://fred.stlouisfed.org/series/PRIREDCOU12011.
Related research

Seller Guide · October 6, 2026
How to Prepare Point Pleasant Beach Rental Records Before Selling
Separate rental approval, income history and booked stays before comparing sale terms.

Seller Guide · October 6, 2026
How to Prepare Rumson Flood and Waterfront Records Before Selling
Separate flood disclosure, elevation, repairs and waterfront rights before comparing sale terms.

Seller Guide · October 6, 2026
How to Prepare Sarasota Condo Inspection and Reserve Records Before Selling
Separate building condition, reserve funding and resale documents before comparing sale terms.