Market Brief · by Aidan Sowa · October 5, 2026
Is an Edwards Home Sold to a Neighbor or to a Visitor Who Only Stays Part of the Year? Reading the Seasonal Homes, the Slow Months and the Price Swings
Reading the Seasonal Homes, the Slow Months and the Price Swings for Edwards, CO, with each source dated and its limits noted, for owners weighing a listing against a direct sale.
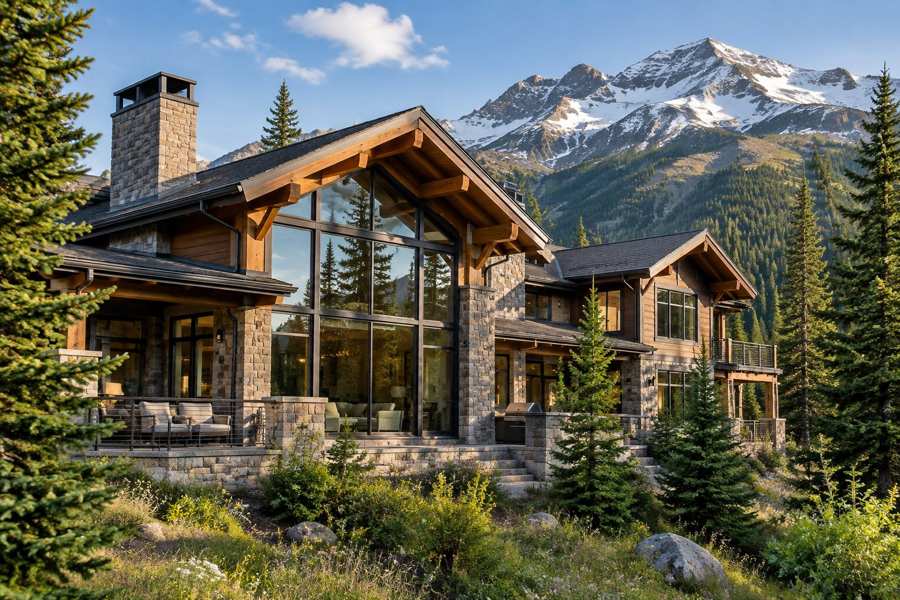
Is an Edwards home sold to a neighbor or to a visitor who only stays part of the year? The records say a good share of the homes belong to people who are not there all year. Redfin's page for the postal area that includes Edwards shows, for the three months ending August 2026, a median sale price of $2,199,048, up 32.9% in a year, and homes selling after 45 days on the market against 28 a year earlier. Realtor.com's page for the same area, for June 2026, shows a median sold price of $2,050,000, up 65.06%, and 156 active listings.
Those jumps are large, and they come from a small number of sales. Redfin counts 54 homes sold in August, and a few sales of very large houses can move a median by a third. The Census gives a slower picture: of 5,833 housing units, 1,336 are held for seasonal use, 22.9% of all homes, and the median owner value is $904,400, a figure that the Census itself marks with a margin of plus or minus $204,855.
Maison Off-Market speaks only to sellers, and this brief is for an owner in Edwards. It uses the name from the sheet, and the figures describe a postal area that is wider than the town. Every figure is dated and linked, the arithmetic is shown, and inferences are labeled. Where sources disagree, the text says so and leaves the choice to the reader.
Key Findings
- Redfin's page for the postal area gave figures for the three months ending August 2026: a median sale price of $2,199,048, up 32.9% from the same period a year before, $741 per square foot, down 10.3%, and a median of 45 days on market, 17 more than a year earlier. It reported 54 homes sold in August, and its text says 60 in the same month a year before, though the percent printed beside the count, down 10.8%, does not match that pair, so the count is used with care. The sale-to-list ratio was 96.9%, up 1.2 points, and 5.8% of homes sold above list, up 0.8 points. Redfin scored the area 49 out of 100, somewhat competitive, with the average home selling about 5% below list and going pending in around 47 days (Redfin, postal area housing market).
- Realtor.com's page, with key indicators as of June 2026, showed a median listing price of $2,890,000, down 5.25% in a year and down 17.67% in three years, a median sold price of $2,050,000, up 65.06% in a year and down 10.68% in three, $818 per square foot, down 5.21% and up 5.96%, 156 active listings, down 2.96% and up 21.30%, a median of 88 days on market, up 5.93% and up 34.78%, and 5 rental properties, down 75%. It called the market cool and balanced, with homes selling 3.43% below asking and a sale-to-list ratio of 97% (Realtor.com, postal area housing market). The neighborhood tables on that page were not used.
- Zillow's page for the postal area showed an average home value of $1,874,897, up 5.4% over the past year, updated on April 30, 2026 (Zillow, Edwards home values). The page is five months old, and the figure is an index of all homes, which moves slowly.
- In the Census postal area, 5,833 housing units were counted, 4,288 occupied, 2,756 by owners and 1,532 by renters, and 1,545 vacant. Of the vacant homes, 1,336 are for seasonal, recreational or occasional use. The median build year is 1996, the median owner value $904,400, plus or minus $204,855, the median household income $83,712, plus or minus $17,642, and the median rent $1,845, plus or minus $75. Of 10,965 people counted, 1,331 were 65 or older (U.S. Census Bureau, American Community Survey 2020-2024 five-year estimates, tables B01001, B19013, B25003, B25004, B25034, B25064 and B25077).
- Redfin's August median of $2,199,048 and Realtor.com's June median of $2,050,000 are close to each other, within a tenth, though they cover different months. Both are far above the Zillow index and more than twice the Census owner value. The gap is wide enough that an owner should not take any single figure as the value of a home in the area.
Which Edwards price figure should an owner trust?
No single one, and the gap between them is the point. Redfin's median of $2,199,048, up 32.9%, implies about $1,654,664 for the same months a year earlier. Realtor.com's sold median of $2,050,000, up 65.06%, implies about $1,241,973 a year earlier and, with a three-year fall of 10.68%, about $2,295,119 three years earlier. A rise of 65% in a year and a fall of 11% in three years can both be true only if the middle year was low, and that is an inference that rests on a small count of sales.
Zillow's April index of $1,874,897, up 5.4%, implies about $1,778,840 a year earlier. It is 14.7% below Redfin's August median and 8.5% below Realtor.com's June sold median, computed here. An index of all homes, including condominiums and smaller townhomes, will sit below a median of the homes that sold in a season when large houses sold, and that is also an inference.
Listing prices point the other way. Realtor.com's median listing price of $2,890,000, down 5.25%, implies about $3,050,132 a year earlier, and down 17.67% in three years it implies about $3,510,264. The median listing is 41.0% above the median sold price, computed here, so asking prices run well above what closed. Redfin's page says the average home sold about 5% below list, which is consistent with that.
Price per foot is a cleaner guide when the homes differ in size. Redfin shows $741, down 10.3%, which implies about $826 a year earlier. Realtor.com shows $818, down 5.21%, which implies about $863, and up 5.96% in three years, which implies about $772. Both pages show a fall over the year, while the two median prices show a rise. A rise in the median with a fall per foot means the homes that sold were larger, not that value rose, and that is an inference.
The Census value is the owners' own estimate of their homes, averaged over five years, and it covers every kind of home in the postal area, including 564 mobile homes, 9.7% of all units, and homes with limits on resale, which the table does not separate. The median of $904,400, plus or minus $204,855, is 22.7% uncertain on its own terms. Redfin's median is 2.4 times it, and Realtor.com's is 2.3 times. The Census is a guide to the whole stock, and the sale prices are a guide to the homes that traded.
A practical step follows from this. An owner who wants to know what a home might bring should gather the last six months of closed sales of homes of the same size and age, and set the highest and lowest side by side. The width of that range, more than any median, tells the owner how much a buyer's view of the home matters. A private buyer who has walked the house and priced it gives one firm figure inside that range, and the owner can compare it with what a listing might draw.
| Source | Figure | What it measures |
|---|---|---|
| Census Reporter | $904,400 | Median owner value, postal area |
| Zillow | $1,874,897, up 5.4% | Home value index, April 30, 2026 |
| Realtor.com | $2,050,000, up 65.06% | Median sold price, June 2026 |
| Redfin | $2,199,048, up 32.9% | Median sale price, three months to August 2026 |
| Realtor.com | $2,890,000, down 5.25% | Median listing price, June 2026 |
Sources as cited. Ratios and year-earlier values in this section are computed from the published figures and percentages.
How fast do Edwards homes sell, and how much do they come down?
Slower than a year ago. Redfin shows a median of 45 days on market, against 28 a year earlier, and a score of 49 out of 100. Realtor.com shows 88 days, up 5.93% in a year, which implies about 83 days a year earlier, and up 34.78% in three years, which implies about 65. The two clocks differ, since one counts to a sale and one counts the time a listing is active, and neither is wrong. Both say the pace has slowed.
Prices come down from asking. Redfin's sale-to-list ratio of 96.9% means a typical sale closed 3.1% under the final list price. Realtor.com's 3.43% below asking and 97% agree. At the median sold prices, 3.1% is about $68,170 on Redfin's figure and $63,550 on Realtor.com's, simple arithmetic and not a claim about any home. Only 5.8% of homes sold above list, so bidding contests are rare, and Redfin says some homes get multiple offers.
Supply is large for a place of this size. Realtor.com shows 156 active listings, down 2.96% in a year, which implies about 161, and up 21.30% in three years, which implies about 129. Redfin's 54 sales in August are one month, and 156 listings against 54 sales a month is about 2.9 months of sales, a rough guide that mixes a June count with an August count. Realtor.com's own text calls the market balanced.
Hot homes behave differently. Redfin says hot homes sold about 2% below list and went pending in around 21 days, and the average home sold about 5% below list in around 47 days. The difference is about 26 days and three points of price. A seller whose house is priced and presented to draw quick interest does better than one whose house sits, and the pages cannot say which kind of house an owner has.
Rentals are scarce. Realtor.com shows 5 rental properties, down 75%, which implies about 20 a year earlier, and the Census median rent is $1,845, plus or minus $75, with only 76 homes vacant for rent. Few rentals mean workers who need housing compete for homes, a pattern that is common in resort areas and that the pages do not measure. It is an inference.
Sources as cited. Year-earlier values and differences are computed from the published percentages.
Who lives in Edwards homes, and how many sit empty for part of the year?
Most occupied homes are owned. Of 4,288 occupied homes, 2,756 are owner-occupied, 64.3%, and 1,532 are rented, 35.7%. Of 5,833 units, 1,545 are vacant, 26.5%. Of those, 76 are for rent, 11 are for sale only, 35 are sold and not yet occupied, 1,336 are held for seasonal, recreational or occasional use, and 87 are vacant for other reasons. Seasonal homes are 86.5% of vacant homes and 22.9% of all homes.
That share is the main feature of the area. About one home in four or five is not anyone's main residence. Their owners may live elsewhere and come for the winter, the summer or a few weeks. Such an owner usually has a home in another place, a manager or a neighbor who checks the house, and a reason to sell that has little to do with the local market: a change of work, of health, or of how the family uses time. That is an inference from the Census category and not a finding from it.
Owners have been in place for a mix of periods. Of 2,756 owner households, 41 moved in during 2023 or later, 1.5%, 319 between 2020 and 2022, 11.6%, 1,080 between 2010 and 2019, 39.2%, 814 between 2000 and 2009, 29.5%, 424 in the 1990s, 15.4%, and 78 before 1990, 2.8%. Together 47.8% moved in before 2010. Renters are newer: of 1,532, 250 moved in 2020 to 2022, 16.3%, 1,187 between 2010 and 2019, 77.5%, and 95 between 2000 and 2009, 6.2%.
The age mix is broad. Of 10,965 people counted, 2,276, or 20.8%, are under 18, 781, or 7.1%, are 18 to 24, 1,641, or 15.0%, are 25 to 34, 1,707, or 15.6%, are 35 to 44, 3,229, or 29.4%, are 45 to 64 and 1,331, or 12.1%, are 65 or older. The margin on the total is plus or minus 1,062. This is the people who live there all year, and it does not describe the owners who do not.
Costs weigh on many. Of 1,974 owners with a mortgage and 1,918 with a computed figure, 729 spent 30% or more of income on housing, 38.0%, and 156 spent half or more, 8.1%. Of 782 owners without a mortgage, 766 with a computed figure, 164 spent 30% or more, 21.4%, and 131 spent half or more, 17.1%. Of 1,532 renters, 1,407 with a computed figure, 1,071 spent 30% or more, 76.1%, and 592 spent half or more, 42.1%. The renters are the most stretched.
A seasonal owner has choices that a full-time owner lacks. The house can sit unsold for a year with little cost to daily life, which means the owner can decline a low offer. It also means taxes, insurance, snow removal and upkeep run on while the house is empty, and those costs are the quiet reason many such owners sell. The Census does not measure those costs, and this paragraph is an inference about how second-home owners often weigh a sale.
Source: U.S. Census Bureau, American Community Survey 2020-2024 five-year estimates, tables B01001, B25003, B25004, B25038, B25070 and B25091, via Census Reporter. Shares are computed here.
How old are Edwards homes, and what kind of homes are they?
The stock is young. Of 5,833 units, 44, or 0.8%, were built before 1940, 22, or 0.4%, in the 1940s, 11, or 0.2%, in the 1950s, 46, or 0.8%, in the 1960s, 320, or 5.5%, in the 1970s, 957, or 16.4%, in the 1980s, 2,492, or 42.7%, in the 1990s, 1,539, or 26.4%, in the 2000s, 386, or 6.6%, in the 2010s and 16, or 0.3%, in 2020 or later. The median build year is 1996, and only 7.6% were built before 1980.
The 1990s and 2000s together produced 69.1% of the homes. Building slowed sharply after 2010, with 6.9% of the stock from the 2010s and later. Homes from the 1990s are now thirty years old, which is when roofs, decks, windows, boilers and water heaters begin to come due, and mountain weather is hard on all of them. That is an inference from the age of the stock and from the climate, not a finding from any source.
The types are mixed. Of 5,833 units, 1,862, or 31.9%, are detached, 1,287, or 22.1%, are attached, 76 are in two-unit buildings, 603 in buildings of three or four units, 735 in five to nine, 473 in ten to nineteen, 208 in twenty to forty-nine, 25 in fifty or more and 564, or 9.7%, are mobile homes. Attached homes and small buildings are 58.4% of the stock, so the typical median sale is not a typical home.
Owner homes are large. Of 2,756 owner households, none live in a home with no bedroom, 69 in a one-bedroom, 910 in a two-bedroom, 529 in a three-bedroom, 793 in a four-bedroom and 455 in one with five or more. Homes with four or more bedrooms are 45.3% of owner homes, and two-bedroom homes 33.0%. A mix of many small homes and a few very large ones is what pulls a median up and down when only a few sales are counted.
A buyer of a large mountain house looks at the roof, the drainage around the foundation, the heating system, the wood or stone exterior and the road and snow access. A seller who has not lived there for years may not know what a manager has repaired. Selling as is to a buyer who has priced the work avoids both the cost of repairs and the weeks of showings. A private sale to such a buyer is one route, and the owner can weigh it against a public listing. Readers comparing markets can also read the Steamboat Springs brief and the Platt Park brief.
Source: U.S. Census Bureau, American Community Survey 2020-2024 five-year estimates, tables B25004, B25024, B25034 and B25042, via Census Reporter. Shares are computed here.
What should an Edwards owner ask before choosing a listing or a private sale?
Five questions are worth asking. Is my price based on closed sales of homes like mine in the last few months, and not on a median that a few sales can move? What will a buyer's inspector find in a house of this age and in this climate? Do I want to show the house when I may not be there? What do the fees cost? And what date do I need to close?
Fees are simple arithmetic, and no rate is assumed here. Each 1% of a $450,000 sale is $4,500, of a $725,000 sale is $7,250 and of a $1,200,000 sale is $12,000. Three percent is $13,500, $21,750 and $36,000, and five percent is $22,500, $36,250 and $60,000. On Redfin's median of $2,199,048, 1% is $21,990, 3% is $65,971 and 5% is $109,952. On Realtor.com's sold median of $2,050,000, 1% is $20,500, 3% is $61,500 and 5% is $102,500.
A private sale has no showings and no neighbors talking about it, which is the first benefit. For a home that sits empty for part of the year, a sale that needs no stream of visitors is a plain advantage. The second benefit is a closing date that fits the seller, which helps an owner who lives elsewhere and needs to schedule a trip. The third and fourth are no commission costs and no closing costs, and the fifth is no inspection repairs.
In a market where homes sell about three percent below list and take longer than they did a year ago, an owner is right to compare a listing with a private offer. The comparison includes the weeks on market, the carrying costs while a home waits, and the cost of any repairs. Only the owner can supply the numbers for taxes, upkeep and plans.
Maison Off-Market buys luxury homes and estates directly from their owners and speaks only to sellers. It does not say that a private sale always beats a public listing. If you would like a private, no-obligation offer for a home in Edwards, call 401-219-4207 or use the contact form on this site.
Sources as cited. Fee illustrations are arithmetic only and assume no commission rate.
Methodology and limitations
Each page's date, title and place were read before use. The Redfin page carries figures for the three months ending August 2026, and its count of homes sold carries a printed percent that does not match its own text, so it is treated with care, and a line on the page that appears to be a price-drop figure repeats the sale-to-list ratio and was not used. The Realtor.com page carries key indicators as of June 2026, and its neighborhood tables were not used. The Zillow page was updated on April 30, 2026, five months ago. Only established data publishers and the Census are cited. Percent changes were taken as printed, and ratios, sums, fee figures and year-earlier values are this brief's arithmetic. Medians drawn from a few sales are volatile, and that is stated where it matters.
Conclusion
The record for Edwards is a median sale price near two million dollars in the summer, homes that take longer to sell than a year ago and close about three percent under list, a stock mostly built in the 1990s and 2000s, and about one home in four or five held for seasonal use. The useful number for an owner is a closed sale of a comparable home nearby in the last few months, and a private buyer can price the home as it stands and close on the owner's schedule.
Frequently Asked Questions
What is the median home price in Edwards?
Redfin showed a median sale price of $2,199,048 for the three months ending August 2026 and Realtor.com showed a median sold price of $2,050,000 for June 2026, for the postal area. The Census median owner value is $904,400.
How long do homes take to sell in Edwards?
Redfin showed a median of 45 days on market against 28 a year earlier, and Realtor.com showed 88 days for June 2026.
How many Edwards homes are used only part of the year?
The Census counts 1,336 of 5,833 housing units in the postal area, 22.9%, as held for seasonal, recreational or occasional use.
How old are Edwards homes?
The Census median build year is 1996, and 443 of 5,833 units, 7.6%, were built before 1980.
Can I sell my Edwards home privately?
Yes. Maison Off-Market buys luxury homes and estates directly from their owners with no showings, flexible closing dates, no commission costs, no closing costs and no inspections or repairs. Call 401-219-4207 or use the contact form.
Compare your options before committing. Request a written private offer for your property, with no obligation, then weigh it against your listing plan.
Sources
- Redfin, postal area housing market, 2026. 81632 Housing Market Trends. https://www.redfin.com/zipcode/81632/housing-market.
- Realtor.com, postal area housing market, 2026. 81632 Housing Market Data. https://www.realtor.com/local/market/colorado/zipcode-81632.
- Zillow, Edwards home values, 2026. Edwards, CO Housing Market. https://www.zillow.com/home-values/93827/edwards-co-81632/.
Related research

Seller Guide · October 6, 2026
How to Prepare Point Pleasant Beach Rental Records Before Selling
Separate rental approval, income history and booked stays before comparing sale terms.

Seller Guide · October 6, 2026
How to Prepare Rumson Flood and Waterfront Records Before Selling
Separate flood disclosure, elevation, repairs and waterfront rights before comparing sale terms.

Seller Guide · October 6, 2026
How to Prepare Sarasota Condo Inspection and Reserve Records Before Selling
Separate building condition, reserve funding and resale documents before comparing sale terms.