Market Brief · by Aidan Sowa · October 5, 2026
Is a Redwood City House Worth More Than the Census Can Count? Reading the Capped Census Value, the Bidding and the Stale Redfin Page
Reading the Capped Census Value, the Bidding and the Stale Redfin Page for Redwood City, CA, with each source dated and its limits noted, for owners weighing a listing against a direct sale.
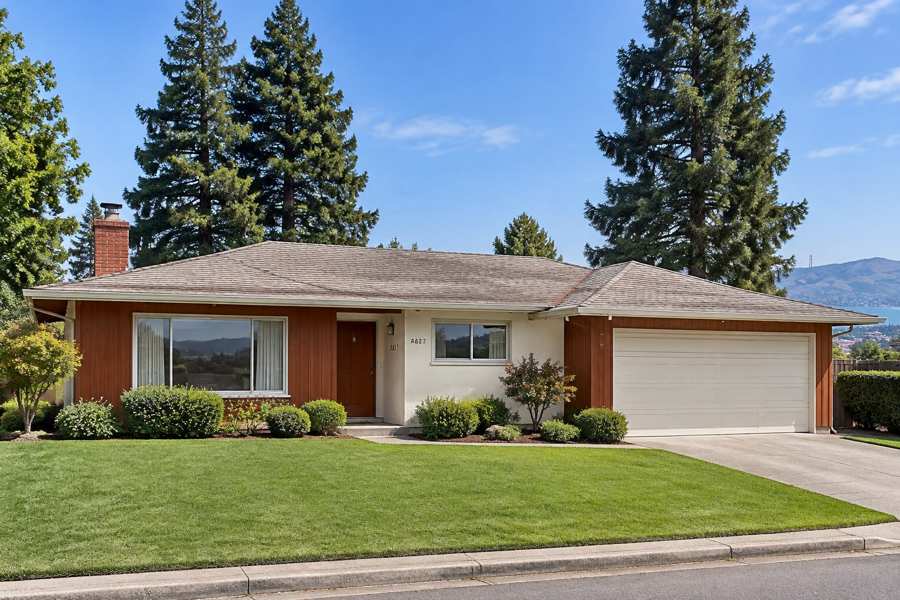
Is a Redwood City house worth more than the Census can count? In this postal area it is. The Census Bureau's median owner value for the postal area that includes Redwood City is shown as $2,000,001, which is not a measurement but a cap: the survey stops counting at $2,000,000, so the true median is at or above that figure and cannot be read from it. The market pages put the real level well above the cap, with Redfin showing a median sale price of $2,724,000 for January 2026 and Realtor.com showing $3,650,000 for June.
The two market pages are months apart and disagree by a wide margin. Redfin's page is eight months old, and it shows homes selling in 37 days, with three offers on average, 34.0% above list and a sale-to-list ratio of 99.8%. Realtor.com's key indicators as of June 2026 show 54 active listings, down 21.49% in a year, a median listing price of $3,500,000 and a ratio of 102%. Zillow's page for the city of Redwood City, updated on August 31, 2026, shows an average home value of $1,878,298, up 5.6%.
Maison Off-Market speaks only to sellers, and this brief is for an owner in Redwood City. It uses the town name from the sheet, and the figures describe a postal area, not the whole city. Every figure is dated and linked, every ratio is computed here from the published figures, and where a source is capped, stale or thin the brief says so. Nothing in it says that a private sale always beats a public listing.
Key Findings
- Redfin's page for the postal area gave monthly figures for January 2026, eight months before this brief: a median sale price of $2,724,000, up 14.7% from a year before, $1,430 per square foot, up 12.6%, 50 homes sold, the same as a year before, and 37 days on the market against 36. Homes got three offers on average, the sale-to-list ratio was 99.8%, down 0.71 points, and 34.0% sold above list, down 18.0 points (Redfin, Redwood City postal area housing market).
- Realtor.com's page, with key indicators as of June 2026, shows a median listing price of $3,500,000, up 16.68% in a year and 9.26% in three years, a median sold price of $3,650,000, up 9.61% and 57.91%, $1,269 per square foot, up 4.79% and 15.43%, 54 active listings, down 21.49% and up 9.20%, and a median of 36 days, unchanged in a year and down 23.81% in three years (Realtor.com, Redwood City postal area housing market).
- Zillow's page for the city of Redwood City shows an average home value of $1,878,298, up 5.6% over the past year, with homes going to pending in around 13 days, updated on August 31, 2026 (Zillow, Redwood City home values). It covers the whole city, which includes lower-priced areas, and is below both market medians for this postal area.
- In the Census postal area, 10,502 housing units were counted, 9,729 occupied, 7,072 by owners and 2,657 by renters, and 773 vacant. The median build year is 1958, the median household income is $233,262, plus or minus $19,322, and the median owner value is reported as $2,000,001, a cap with no margin of error. Of the 10,502 units, 7,862, or 74.9%, were built before 1980.
- The picture is a postal area of older, mostly detached houses, a high-priced market that has been fast and competitive, and fewer homes for sale than a year ago. A seller in a market like this has leverage, and also has the problem that the pages point to prices in a wide band, from about $2,700,000 to about $3,650,000. A private buyer who prices the house itself is a way for an owner to find where in that band the house sits.
What does a capped Census value tell a Redwood City owner?
Very little about the level, and one thing about the direction. The Census median owner value of $2,000,001 is a top code. The survey reports owner values in bands, and the top band is $2,000,000 or more, so when more than half of owners are in that band the median is set at the top of the scale. The true median is higher, and the cap carries no margin of error. It is 8.6 times the median household income of $233,262, plus or minus $19,322, and the real ratio is higher than that.
The cap is itself a fact: more than half of the owner households in the postal area say their home is worth $2,000,000 or more. That is consistent with the market pages. Redfin's median of $2,724,000 is 36.2% above $2,000,000, computed here, and Realtor.com's sold median of $3,650,000 is 82.5% above it. A reader who sees the cap and thinks homes are worth about $2,000,000 is reading a ceiling as a price.
The market pages differ. Redfin's January median of $2,724,000, up 14.7%, implies about $2,374,891 a year before, and its price per square foot of $1,430, up 12.6%, implies about $1270. Realtor.com's sold median of $3,650,000, up 9.61%, implies about $3,329,988 a year earlier, and up 57.91% in three years implies about $2,311,443. A rise of more than half in three years is possible but large, and in a month with few sales a median can jump with a few high prices.
Realtor.com's listing median of $3,500,000, up 16.68%, implies about $2,999,657 a year earlier and, up 9.26% in three years, about $3,203,368. The sold median is 4.3% above the listing median, which is unusual. It happens when the homes that sell in a month are higher-priced than the homes that are listed, and with 54 listings the sample is small. Realtor.com's price per square foot of $1,269 implies about $1211 a year earlier and $1099 three years earlier.
Zillow's city index of $1,878,298, up 5.6%, implies about $1,778,691 a year earlier. It is 31.0% below the Redfin median and 48.5% below the Realtor.com sold median. An index across a whole city, including condominiums and smaller homes, will run below the figures for a postal area of single-family houses. For an owner, the sensible reading is a wide band, and the useful number is a closed sale of a nearly identical house nearby in the last few months.
A second effect of the cap is on any reader who tries to compare this postal area with another. Places where the median stays under the cap can be compared on the Census value, and places above it cannot, because every one of them reads as the same number. A house in this area and a house in a far more expensive area would show the same Census median. That is why the market pages, with all their flaws, are the better guide to level here, and why a closed sale is better still.
| Source | Figure | What it measures |
|---|---|---|
| Zillow | $1,878,298, up 5.6% | Home value index, city of Redwood City, August 31, 2026 |
| Census Reporter | $2,000,001 (cap) | Median owner value, top-coded, postal area |
| Redfin | $2,724,000, up 14.7% | Median sale price, January 2026, eight months old |
| Realtor.com | $3,500,000, up 16.68% | Median listing price, June 2026 |
| Realtor.com | $3,650,000, up 9.61% | Median sold price, June 2026 |
Sources as cited. Ratios and year-earlier values in this section are computed from the published figures and percentages.
How fast does the market move, and how much bidding is there?
Redfin's competition score for the postal area is 90 out of 100, which it labels most competitive. Its page says most homes get multiple offers, often with waived contingencies, that the average home sells about 1% above list price and goes pending in around 27 days, and that hot homes sell about 9% above list and go pending in around 11 days. Homes received three offers on average. The score is Redfin's own measure and the page is from January, but the pattern is of strong bidding.
The share selling above list has fallen. Redfin shows 34.0% above list, down 18.0 points, which implies about 52.0% a year earlier, and a sale-to-list ratio of 99.8%, down 0.71 points. Even so, a third of homes selling above asking is a high figure by most standards. Realtor.com's ratio for June is 102%, which suggests that the typical home sold above asking in that month, and that the market has stayed firm since January.
The wait is short. Redfin shows 37 days against 36 a year before, and Realtor.com shows a median of 36 days, unchanged in a year, and down 23.81% in three years, which implies about 47 days three years earlier. Zillow's pending time for the city is about 13 days, which is a time to pending and not to closing. All three agree that homes sell in weeks, not months.
Supply is small. Realtor.com shows 54 active listings, down 21.49% in a year, which implies about 69 a year earlier, and up 9.20% in three years, which implies about 49. For a postal area of 9,729 occupied homes, 54 listings is 0.56% of the occupied count, computed here. Redfin counted 50 homes sold in January, the same as a year before, so sales are steady while the number available falls.
Rentals are thin. Realtor.com shows 13 rental properties, down 25% in a year, which implies about 17 a year earlier, and down 29.41% in three years, which implies about 18. The page's median rent of $3,522, up 21.45% in a year and down 40.81% in three years, rests on a handful of rentals and swings too widely to trust, so it is not used. The Census median gross rent for the area is $2,863, plus or minus $154.
Interest rates and the stock market shape a market of this kind more than local supply does. Many buyers here are paid in stock or bonuses, and a change in their wealth can change what they bid within a few weeks. The pages do not measure that, and the point is an inference about who buys. It does explain why a sold median can jump by more than half in three years and why a quiet quarter can follow a strong one, and it is one reason to price from the latest closed sales.
Sources as cited. Year-earlier values and differences are computed from the published percentages.
Who owns a Redwood City home, and what do they owe?
Owners are about three in four. Of 9,729 occupied homes, 7,072 are owner-occupied, 72.7%, and 2,657 are rented, 27.3%. Of 10,502 units, 773 are vacant, 7.4%: 126 are for rent, 43 are rented but not occupied, 90 are for sale only, 126 are sold but not occupied, 168 are held for seasonal use and 220 are vacant for other reasons. A vacancy of this size is low for a place with such high prices.
Tenure is long. Of 7,072 owner households, 67 moved in during 2023 or later, 0.9%, 776 between 2020 and 2022, 11.0%, 2,221 between 2010 and 2019, 31.4%, 1,705 between 2000 and 2009, 24.1%, 1,049 in the 1990s, 14.8%, and 1,254 before 1990, 17.7%. Those who arrived before 2000 are 32.6%. Owners with decades of tenure may hold a very large gain, and a very low property tax basis, which gives some a reason to stay and others a reason to think hard about timing.
Houses are mostly three or four bedrooms. Of 7,072 owner households, 135 live in a one-bedroom, 781 in a two-bedroom, 2,841 in a three-bedroom, 2,478 in a four-bedroom and 837 in one with five or more. Three-bedroom homes are 40.2% of owner homes and four or more 46.9%. The post-war houses built here were modest, and many have been enlarged, which is an inference from the build years and the bedroom counts.
Debt is common but not universal. Of 7,072 owners, 5,025 have a mortgage, 71.1%, and 2,047 do not, 28.9%. Among owners with a mortgage and a computed figure, 1,916 of 5,013 spent 30% or more of income on housing, 38.2%, and 695 spent half or more, 13.9%. Among owners without a mortgage, 378 of 2,019 spent 30% or more, 18.7%, and 147 spent half or more, 7.3%. Of 2,657 renters, 2,542 with a computed figure, 931 spent 30% or more, 36.6%, and 537 spent half or more, 21.1%.
The population of 25,759 has many families and many older residents. Of those counted, 5,550 are under 18, 21.5%, 1,355 are 18 to 24, 5.3%, 2,829 are 25 to 34, 11.0%, 3,450 are 35 to 44, 13.4%, 7,556 are 45 to 64, 29.3%, and 5,019 are 65 or older, 19.5%. The margin on the total is plus or minus 1,345. An owner at an age to move closer to family or to a place with lower costs is a likely source of listings, an inference.
Property tax rules matter to long-tenured owners in this state. An owner who bought decades ago pays tax on a much lower base than a buyer would, and selling resets that base for the buyer, not for the seller. Some owners weigh that when deciding whether to sell, and some consider gifting or other arrangements with advice from a tax professional. The brief does not give tax advice, and an owner should ask an adviser about the specific case before deciding.
Source: U.S. Census Bureau, American Community Survey 2020-2024 five-year estimates, tables B01001, B25003, B25004, B25038, B25042, B25070 and B25091, via Census Reporter. Shares are computed here.
How old are Redwood City homes, and what does that mean for a sale?
The stock is old and mostly detached. Of 10,502 units, 8,501 are detached, 80.9%, 388 are attached, 3.7%, 101 are in two-unit buildings, 237 in buildings of three or four, 371 in five to nine, 449 in ten to nineteen, 294 in twenty to forty-nine and 129 in fifty or more. Another 32 are mobile homes. A median across these homes is mostly a median of houses.
Of 10,502 units, 2,104, or 20.0%, were built before 1940, 1,360, or 12.9%, in the 1940s, 2,149, or 20.5%, in the 1950s, 1,144, or 10.9%, in the 1960s, 1,105, or 10.5%, in the 1970s, 966, or 9.2%, in the 1980s, 676, or 6.4%, in the 1990s, 588, or 5.6%, in the 2000s, 351, or 3.3%, in the 2010s and 59, or 0.6%, in 2020 or later. The median build year is 1958, and 74.9% were built before 1980.
The homes of the 1940s and 1950s alone are 33.4% of the total. Modest houses on regular lots, built for the first postwar families, are now worth millions mostly because of the land and the location, which is an inference from the gap between their age and their price. A buyer who sees the lot as the main value may plan to rebuild or to add on, and may weigh the condition of the existing house less than a buyer who plans to move in.
Older houses in the Bay Area raise their own questions. Buyers and their inspectors look at the foundation and the seismic bracing, the roof, the electric panel, old wiring, galvanized pipes, the sewer lateral, any unpermitted additions and the condition of the chimney. Many sellers order inspection reports before listing, to avoid surprises, and a buyer who waives contingencies in a bidding contest is taking those risks on.
A seller who has not ordered inspections and who would rather not prepare the house for sale has a choice. A private buyer who takes the house as it stands, with no showings, no staging and no repair requests, is a way to avoid the weeks of preparation that many sellers in this market go through, and the owner can weigh that against the price a long campaign might bring. Readers comparing markets can also read the Santa Barbara brief and the Santa Rosa brief.
Source: U.S. Census Bureau, American Community Survey 2020-2024 five-year estimates, tables B25024, B25034 and B25042, via Census Reporter. Shares are computed here.
What should a Redwood City owner ask before choosing a listing or a private sale?
Five questions are worth asking. Is my price based on closed sales of houses like mine in the last few months, and not on a median that is capped, stale or based on a few sales? What will a buyer's inspector find in a house of this age? Can I get ready to list, and how long will it take? What do the fees cost? And what date do I need to close?
Fees are simple arithmetic, and no rate is assumed here. Each 1% of a $1,200,000 sale is $12,000, of a $2,000,000 sale is $20,000 and of a $3,000,000 sale is $30,000. Three percent is $36,000, $60,000 and $90,000, and five percent is $60,000, $100,000 and $150,000. On the Redfin median of $2,724,000, 1% is $27,240, 3% is $81,720 and 5% is $136,200. On the Zillow city value of $1,878,298, 1% is $18,783, 3% is $56,349 and 5% is $93,915.
A private sale has no showings and no neighbors talking about it, which is the first benefit. The second benefit is a closing date that fits the seller, which helps a household that needs time to find a new home. The third and fourth are no commission costs and no closing costs, and the fifth is no inspection repairs.
In a fast, competitive market with few listings, an owner is right to compare a listing with a private offer. The comparison includes the preparation a listing needs, the weeks of showings, the chance that bids do not come, the cost of inspection credits and the owner's date. Only the owner can supply the numbers for taxes, upkeep and plans.
Maison Off-Market buys luxury homes and estates directly from their owners and speaks only to sellers. It does not say that a private sale always beats a public listing. If you would like a private, no-obligation offer for a home in Redwood City, call 401-219-4207 or use the contact form on this site.
Sources as cited. Fee illustrations are arithmetic only and assume no commission rate.
Methodology and limitations
Each page's date, title and place were read before use. The Redfin page shows monthly figures for January 2026, eight months old, and is used as a dated benchmark. The Realtor.com page carries key indicators as of June 2026 with changes over one year and three years; its median rent rests on a handful of rentals and was not used. The Zillow page covers the city, was updated on August 31, 2026, and no page for the postal area could be verified. The Census median owner value of $2,000,001 is a top code and is described as a cap. Only established data publishers and the Census are cited. Percent changes were taken as published, year-earlier values were computed by dividing by one plus or minus the change, and every ratio and sum was computed in code. Census Reporter figures are five-year averages and carry margins of error.
Conclusion
The record for Redwood City, as far as the pages allow, is a postal area of older, mostly detached houses where the Census value is capped at $2,000,001, where recent sales and listings sit in a band from about $2,700,000 to $3,650,000, where homes sell in weeks and a third sold above list in January, and where listings have fallen by about a fifth in a year. The useful number for an owner is a closed sale of a nearly identical house nearby in the last few months, and a private buyer can price the home as it stands and close on the owner's schedule.
Frequently Asked Questions
What is the median home price in Redwood City?
Redfin showed a median sale price of $2,724,000 for January 2026, an older figure. Realtor.com showed a median sold price of $3,650,000 and a median listing price of $3,500,000 for June 2026, for the postal area. Zillow showed $1,878,298 for the city in August 2026. The Census median owner value is capped at $2,000,001.
How fast do Redwood City homes sell?
Redfin showed 37 days for January 2026 and Realtor.com showed a median of 36 days for June 2026.
Why is the Census value $2,000,001?
The survey stops counting owner values at $2,000,000, so a median of $2,000,001 means that more than half of owners reported $2,000,000 or more and the true median is higher.
How many Redwood City homes are owner-occupied?
The Census counts 7,072 of 9,729 occupied homes in the postal area, 72.7%, as owner-occupied.
Can I sell my Redwood City home privately?
Yes. Maison Off-Market buys luxury homes and estates directly from their owners with no showings, flexible closing dates, no commission costs, no closing costs and no inspections or repairs. Call 401-219-4207 or use the contact form.
Compare your options before committing. Request a written private offer for your property, with no obligation, then weigh it against your listing plan.
Sources
- Realtor.com, postal area housing market, 2026. 94062 Housing Market Data. https://www.realtor.com/local/market/california/zipcode-94062.
- Redfin, postal area housing market, 2026. 94062 Housing Market Trends. https://www.redfin.com/zipcode/94062/housing-market.
- Zillow, Redwood City home values, 2026. Redwood City, CA Housing Market. https://www.zillow.com/home-values/20128/redwood-city-ca/.
Related research

Seller Guide · October 6, 2026
How to Prepare Point Pleasant Beach Rental Records Before Selling
Separate rental approval, income history and booked stays before comparing sale terms.

Seller Guide · October 6, 2026
How to Prepare Rumson Flood and Waterfront Records Before Selling
Separate flood disclosure, elevation, repairs and waterfront rights before comparing sale terms.

Seller Guide · October 6, 2026
How to Prepare Sarasota Condo Inspection and Reserve Records Before Selling
Separate building condition, reserve funding and resale documents before comparing sale terms.