Market Brief · by Aidan Sowa · October 5, 2026
Is a Newer Peoria House Easier to Sell Because Little Is Old Enough to Need Repairs? Reading the Young Stock, the Mortgage Holders and the Stale Pages
Reading the Young Stock, the Mortgage Holders and the Stale Pages for Peoria, AZ, with each source dated and its limits noted, for owners weighing a listing against a direct sale.
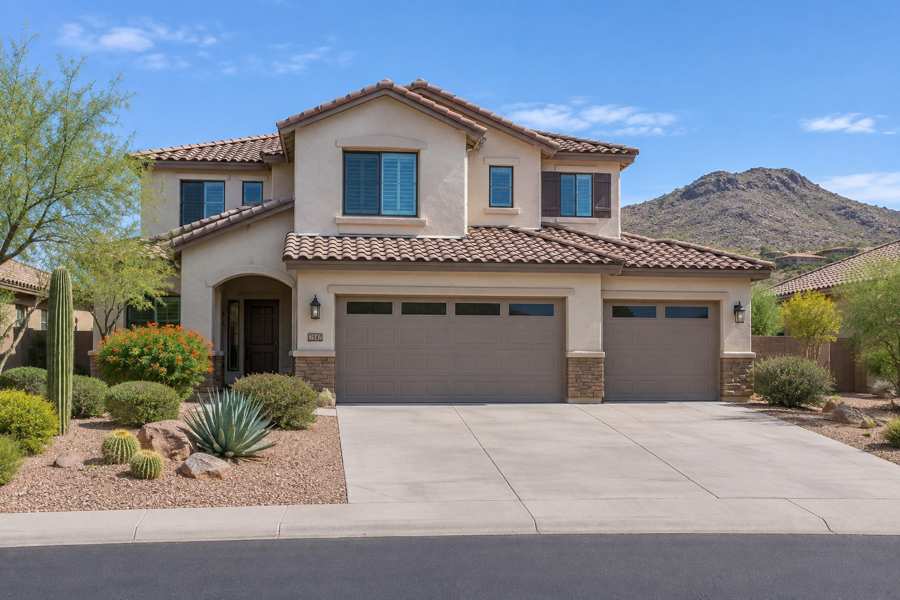
Is a newer Peoria house easier to sell because little is old enough to need repairs? The Census says very little here is old. Of 26,549 housing units in the postal area that includes Peoria, 451, or 1.7%, were built before 1980, and 23,601, or 88.9%, were built in 2000 or later. The pages that describe the market are mixed in age. Redfin's page still shows February 2025, and the Realtor.com page carries key indicators as of March 2026.
The freshest source is Zillow, whose page for the city of Peoria was updated on August 31, 2026 and shows an average home value of $480,596, down 0.8%. The postal area is a newer, higher-priced part of a larger city, and the Census median owner value of $661,400 is well above the city figure. The older pages show listings of 829 and a median listing price of $679,450.
Maison Off-Market speaks only to sellers, and this brief is for an owner in Peoria. It uses the town name from the sheet, and the figures describe a postal area. Every figure is dated and linked, the arithmetic is shown, and inferences are labeled. Where a page is old, the text says so and does not rely on it for the present.
Key Findings
- Redfin's page for the postal area gave monthly figures for February 2025, nineteen months before this brief: a median sale price of $658,995, up 3.1% from a year before, $277 per square foot, down 2.3%, 306 homes sold, up 41.0% from 217, and a median of 77 days on market, 19 more than a year earlier. The sale-to-list ratio was 98.3%, up 0.8 points, and 6.2% of homes sold above list, down 3.5 points. Redfin scored the area 53 out of 100, somewhat competitive, with homes receiving 1 offer on average, the average home selling about 2% below list and going pending in around 61 days, and hot homes selling near list in around 29 days (Redfin, postal area housing market). The page has not been updated since, and it is used only as a dated benchmark.
- Realtor.com's page, with key indicators as of March 2026, showed a median listing price of $679,450, down 2.92% in a year and up 1.41% in three years, $276 per square foot, down 2.82% and up 0.73%, 829 active listings, up 4.32% and up 57.29%, a median of 47 days on market, up 2.17% and up 11.90%, 201 rental properties, up 5.77% and up 61.76%, and a median rent of $2,500 a month, unchanged in a year and down 7.30% in three. The page also gave a sale-to-list ratio of 99%, with homes selling 1.29% below asking in February 2026, and called the market balanced (Realtor.com, postal area housing market). It shows no sold median. Its neighborhood table names communities and was not used.
- Zillow's page for the city of Peoria showed an average home value of $480,596, down 0.8% over the past year, with homes going to pending in around 41 days, updated on August 31, 2026 (Zillow, Peoria home values). The city is much larger than the postal area, and the page is the freshest in this brief.
- In the Census postal area, 26,549 housing units were counted, 25,364 occupied, 23,000 by owners and 2,364 by renters, and 1,185 vacant. The median build year is 2010, the median owner value $661,400, plus or minus $11,248, the median household income $145,546, plus or minus $5,185, and the median rent $2,355, plus or minus $157. Of 74,390 people counted, 21,488 were under 18 (U.S. Census Bureau, American Community Survey 2020-2024 five-year estimates, tables B01001, B19013, B25003, B25004, B25024, B25034, B25064 and B25077).
- The Zillow city value of $480,596 is far below the Census owner value of $661,400 and the Redfin and Realtor.com figures of about $659,000 and $679,000, and the reason is probably geography: the city includes older, smaller and cheaper homes, and the postal area is newer and larger. That is an inference from the age counts.
Which Peoria price figure should an owner trust?
Only one source is current, and it covers a bigger place. Zillow's August index of $480,596 for the city, down 0.8%, implies about $484,472 a year earlier. It says that values in the city are flat. Redfin's February 2025 median of $658,995, up 3.1%, implies about $639,180 a year before that, and is nineteen months old. Realtor.com's March listing median of $679,450, down 2.92%, implies about $699,887 a year earlier and, up 1.41% in three years, about $670,003 three years earlier.
The listing median is 3.1% above Redfin's old sale median, computed here, and the Census median owner value of $661,400, plus or minus $11,248, is between them: 0.4% above Redfin's median and 2.7% below Realtor.com's listing median. The three agree within a few percent, which suggests that values in the postal area are near $660,000 to $680,000 and have been flat. That is an inference, since the pages differ in date and kind.
Price per foot is a steadier guide. Redfin showed $277 in February 2025, down 2.3%, which implies about $284 a year earlier. Realtor.com shows $276 in March 2026, down 2.82%, which implies about $284 a year earlier, and up 0.73% in three years, which implies about $274. The two are within 0.4% of each other and show a year-over-year fall. A price per foot that is level across a year and a half suggests flat values, and that is an inference.
The Census value is an average over five years of owners' own estimates, and it is 4.5 times the median household income of $145,546. The Zillow city value is 3.3 times. The gap between $480,596 and $661,400, 37.6%, is the difference between the city and the postal area, and an owner should ask any buyer or adviser which of the two they are quoting.
An owner should look for closed sales of similar houses from the same builder and period, because newer subdivisions have many homes with the same plans and the best comparison is a sale of a nearly identical house nearby in the last few months, adjusted for lot, pool, view and upgrades.
A reader should also ask why a page can go stale. Data publishers refresh the pages they judge to be active, and a postal area that has few sales in a month, or that the publisher has stopped tracking, may be left as it was. A page that has not changed in a year and a half tells an owner little about this autumn. The right response is not to guess at what changed but to collect recent closed sales directly and to treat any older median as a rough marker of the level and nothing more.
| Source | Figure | What it measures |
|---|---|---|
| Zillow | $480,596, down 0.8% | Home value index, city of Peoria, August 31, 2026 |
| Redfin | $658,995, up 3.1% | Median sale price, February 2025, nineteen months old |
| Census Reporter | $661,400 | Median owner value, postal area |
| Realtor.com | $679,450, down 2.92% | Median listing price, March 2026 |
Sources as cited. Ratios and year-earlier values in this section are computed from the published figures and percentages.
How much supply is there in Peoria, and how fast do homes sell?
Supply has grown a great deal. Realtor.com shows 829 active listings, up 4.32% in a year, which implies about 795 a year earlier, and up 57.29% in three years, which implies about 527. For the month, listings rose 12.27%, which implies about 738 in the month before. Redfin counted 306 sales in February 2025, which is the only sales count available, so a ratio of listings to sales would mix dates and is not given.
Time on market is moderate. Realtor.com shows a median of 47 days, up 2.17% in a year, which implies about 46 days a year earlier, and up 11.90% in three years, which implies about 42. Redfin's February 2025 median was 77 days, 19 more than a year before, and the average home went pending in around 61 days, with hot homes in around 29 days. Zillow's August page says around 41 days to pending. The clocks differ, and all of them are far from a fast market.
Prices come down a little. Realtor.com's sale-to-list ratio of 99%, with homes selling 1.29% below asking in February 2026, means that most sales closed close to the list price. Redfin's older figure was 98.3%, and the average home sold about 2% below list. On the Realtor.com listing median, 1.29% is about $8,765 and on Redfin's old median 1.7% is about $11,203, simple arithmetic and not a claim about any home.
Few homes go over asking. Redfin showed 6.2% sold above list in February 2025, down 3.5 points, which implies about 9.7% a year earlier, and said homes received 1 offer on average. That page is old, and the share may have changed. Realtor.com calls the market balanced as of February 2026. A balanced market gives the seller no great edge and the buyer no great edge.
Rentals have grown. Realtor.com shows 201 rental properties, up 5.77% in a year, which implies about 190, and up 61.76% in three years, which implies about 124. The median rent of $2,500 is unchanged in a year and down 7.30% in three years, which implies about $2,697. The Census median rent is $2,355, plus or minus $157, so the listed rent is 6.2% above it, computed here, which is a small gap.
Builders matter in a market like this. When a large community is still being built or has recently sold out, new homes from the builder compete with resale homes for the same buyers, often with incentives that a resale seller cannot match, such as rate buydowns or closing credits. The pages do not measure those incentives, and that is an inference about how new-home sales work. A resale owner should know what the builder nearby is offering before setting a price.
Sources as cited. Year-earlier values and differences are computed from the published percentages.
Who owns a house in Peoria, and with what kind of loan?
Owners are the overwhelming majority. Of 25,364 occupied homes, 23,000 are owner-occupied, 90.7%, and 2,364 are rented, 9.3%. Of 26,549 units, 1,185 are vacant, 4.5%: 266 are for rent, 292 are for sale only, 521 are held for seasonal use and 106 are vacant for other reasons. Seasonal homes are 2.0% of all homes, and those for sale are 1.1%.
Owners are mostly recent. Of 23,000 owner households, 620 moved in during 2023 or later, 2.7%, 4,881 between 2020 and 2022, 21.2%, 13,606 between 2010 and 2019, 59.2%, 3,286 between 2000 and 2009, 14.3%, 526 in the 1990s, 2.3%, and 81 before 1990, 0.4%. So 83.1% moved in since 2010 began, and only 2.6% before 2000. Few owners have decades of tenure, which differs from older towns in this series.
Families are common. Of 74,390 people counted, 21,488, or 28.9%, are under 18, 3,751, or 5.0%, are 18 to 24, 5,703, or 7.7%, are 25 to 34, 12,009, or 16.1%, are 35 to 44, 20,059, or 27.0%, are 45 to 64 and 11,380, or 15.3%, are 65 or older. The margin on the total is plus or minus 2,576. Households with children are the usual buyers of larger newer houses, which is an inference.
Houses are large. Of 23,000 owner households, 14 live in a home with no bedroom, 63 in a one-bedroom, 2,224 in a two-bedroom, 7,999 in a three-bedroom, 8,729 in a four-bedroom and 3,971 in one with five or more. Homes with four or more bedrooms are 55.2% of owner homes and three-bedroom homes 34.8%. Most owners have a house of three or more bedrooms, and a family whose children have grown may weigh a smaller home.
Most owners carry a mortgage. Of 23,000 owners, 17,069 have one, 74.2%, and 5,931 do not, 25.8%. Among owners with a mortgage and a computed figure, 3,197 of 16,888 spent 30% or more of income on housing, 18.9%, and 1,285 spent half or more, 7.6%. Among owners without a mortgage, 693 of 5,858 spent 30% or more, 11.8%, and 185 spent half or more, 3.2%. Of 2,364 renters, 2,186 with a computed figure, 1,271 spent 30% or more, 58.1%, and 605 spent half or more, 27.7%.
With most owners holding a mortgage, many bought or refinanced within the last decade, and some at rates well below today's. An owner with a low rate faces a real cost in selling, since a new loan will cost more each month. That is one reason some owners stay put, and it can reduce the number of listings. It is also a reason an owner who must sell may prefer a buyer who pays cash and closes on a date of the owner's choosing.
Source: U.S. Census Bureau, American Community Survey 2020-2024 five-year estimates, tables B01001, B25003, B25004, B25038, B25042, B25070 and B25091, via Census Reporter. Shares are computed here.
How old are Peoria houses, and does newer mean fewer problems?
The stock is very young. Of 26,549 units, 16, or 0.06%, were built before 1940, 43, or 0.2%, in the 1940s, 40, or 0.2%, in the 1950s, 80, or 0.3%, in the 1960s, 272, or 1.0%, in the 1970s, 479, or 1.8%, in the 1980s, 2,018, or 7.6%, in the 1990s, 10,243, or 38.6%, in the 2000s, 11,141, or 42.0%, in the 2010s and 2,217, or 8.4%, in 2020 or later. The median build year is 2010, and only 1.7% were built before 1980.
The 2000s and 2010s together produced 80.5% of the homes. Houses from the 2000s are now about twenty years old, and that is when cooling systems, water heaters, roofs and exterior paint begin to need work, even in a house that was well built. Newer does not mean problem-free: it means the problems come later and arrive together. That is an inference from the age of the stock, not a finding from any source.
Nearly all homes are detached. Of 26,549 units, 25,414, or 95.7%, are detached, 492, or 1.9%, are attached, 149 are in two-unit buildings, 48 in buildings of five to nine, 69 in ten to nineteen, 19 in twenty to forty-nine and 342, or 1.3%, in fifty or more. There are no mobile homes in the count. A median across such homes is a median of houses, most from a few builders and a few plans.
Because many houses share plans, a buyer can compare nearly identical homes, and price differences come down to lot, pool, upgrades, orientation and condition. That helps a seller who has made upgrades, since a buyer can see what they are worth, and it hurts a seller who has not, since a nearby house with a pool or a better lot will draw the attention. An owner can find the nearest twin of the house and compare.
A buyer of a house of this age will want the cooling system, the roof, the water heater, the pool equipment if any, and the stucco and drainage checked. In a balanced market with moderate days on market, a seller may be asked for credits. Selling as is to a buyer who has priced those items avoids both the cost of repairs and the weeks of showings, and the owner can weigh a private sale against a public listing.
Heat shapes the wear. In a desert climate, roofs, pool equipment, outdoor lighting, irrigation lines and exterior paint age faster than in milder places. A buyer's inspector will look at the roof underlayment, which is often the first part to fail under tile, and at the age of each cooling unit. A seller who has the receipts for those items can show that the house has been kept up, and the receipts are worth gathering before any buyer asks. Readers comparing markets can also read the Tucson brief and the Arcadia brief.
Source: U.S. Census Bureau, American Community Survey 2020-2024 five-year estimates, tables B25004, B25024, B25034 and B25042, via Census Reporter. Shares are computed here.
What should a Peoria owner ask before choosing a listing or a private sale?
Five questions are worth asking. Is my price based on closed sales of nearly identical houses in the last few months, and not on a median from a page that is a year old? How long can I carry the home if it waits for six weeks or more? What will a buyer's inspector find in a house of this age? What do the fees cost? And what date do I need to close?
Fees are simple arithmetic, and no rate is assumed here. Each 1% of a $450,000 sale is $4,500, of a $725,000 sale is $7,250 and of a $1,200,000 sale is $12,000. Three percent is $13,500, $21,750 and $36,000, and five percent is $22,500, $36,250 and $60,000. On the Census median owner value of $661,400, 1% is $6,614, 3% is $19,842 and 5% is $33,070. On the Zillow city value of $480,596, 1% is $4,806, 3% is $14,418 and 5% is $24,030.
A private sale has no showings and no neighbors talking about it, which is the first benefit. The second benefit is a closing date that fits the seller, which helps a household that needs time to find a new home or to finish a school year. The third and fourth are no commission costs and no closing costs, and the fifth is no inspection repairs.
In a balanced market where many homes share the same plans and sell a little under list, an owner is right to compare a listing with a private offer. The comparison includes the weeks on market, the chance of cuts, the carrying costs while a home waits and the cost of repairs. Only the owner can supply the numbers for taxes, upkeep and plans.
Maison Off-Market buys luxury homes and estates directly from their owners and speaks only to sellers. It does not say that a private sale always beats a public listing. If you would like a private, no-obligation offer for a home in Peoria, call 401-219-4207 or use the contact form on this site.
Sources as cited. Fee illustrations are arithmetic only and assume no commission rate.
Methodology and limitations
Each page's date, title and place were read before use. The Redfin page shows monthly figures for February 2025, nineteen months old, and was re-fetched twice with the same result, so it is used only as a dated benchmark. The Realtor.com page carries key indicators as of March 2026 and a sale-to-list ratio for February 2026, shows no sold median, and its neighborhood table names communities and was not used. The Zillow page was updated on August 31, 2026 and covers the city, not the postal area. Only established data publishers and the Census are cited. Percent changes were taken as printed, and ratios, sums, fee figures and year-earlier values are this brief's arithmetic.
Conclusion
The record for Peoria, as far as the pages allow, is a postal area of newer detached houses valued near $660,000 to $680,000, flat over the past year or two, a supply of listings that has grown by more than half in three years, homes that take about six weeks to sell, and a Census that shows only 1.7% of homes built before 1980. The useful number for an owner is a closed sale of a nearly identical house nearby in the last few months, and a private buyer can price the home as it stands and close on the owner's schedule.
Frequently Asked Questions
What is the median home price in Peoria?
Redfin showed a median sale price of $658,995 for February 2025, an old figure, and Realtor.com showed a median listing price of $679,450 for March 2026, for the postal area. Zillow showed $480,596 for the city in August 2026. The Census median owner value is $661,400.
How many homes are for sale in Peoria?
Realtor.com showed 829 active listings for March 2026, up 4.32% in a year and up 57.29% in three years.
How old are Peoria homes?
The Census median build year is 2010, and 451 of 26,549 housing units, 1.7%, were built before 1980.
How many Peoria homes are owner-occupied?
The Census counts 23,000 of 25,364 occupied homes in the postal area, 90.7%, as owner-occupied.
Can I sell my Peoria home privately?
Yes. Maison Off-Market buys luxury homes and estates directly from their owners with no showings, flexible closing dates, no commission costs, no closing costs and no inspections or repairs. Call 401-219-4207 or use the contact form.
Compare your options before committing. Request a written private offer for your property, with no obligation, then weigh it against your listing plan.
Sources
- Realtor.com, postal area housing market, 2026. 85383 Housing Market Data. https://www.realtor.com/local/market/arizona/zipcode-85383.
- Redfin, postal area housing market, 2026. 85383 Housing Market Trends. https://www.redfin.com/zipcode/85383/housing-market.
- Zillow, Peoria home values, 2026. Peoria, AZ Housing Market. https://www.zillow.com/home-values/40298/peoria-az/.
Related research

Seller Guide · October 6, 2026
How to Prepare Point Pleasant Beach Rental Records Before Selling
Separate rental approval, income history and booked stays before comparing sale terms.

Seller Guide · October 6, 2026
How to Prepare Rumson Flood and Waterfront Records Before Selling
Separate flood disclosure, elevation, repairs and waterfront rights before comparing sale terms.

Seller Guide · October 6, 2026
How to Prepare Sarasota Condo Inspection and Reserve Records Before Selling
Separate building condition, reserve funding and resale documents before comparing sale terms.