Market Brief · by Aidan Sowa · October 5, 2026
Is a Large Share of La Quinta Empty? Reading the Vacancy Rate and the Sold Medians
Reading the Vacancy Rate and the Sold Medians for La Quinta, CA, with each source dated and its limits noted, for owners weighing a listing against a direct sale.
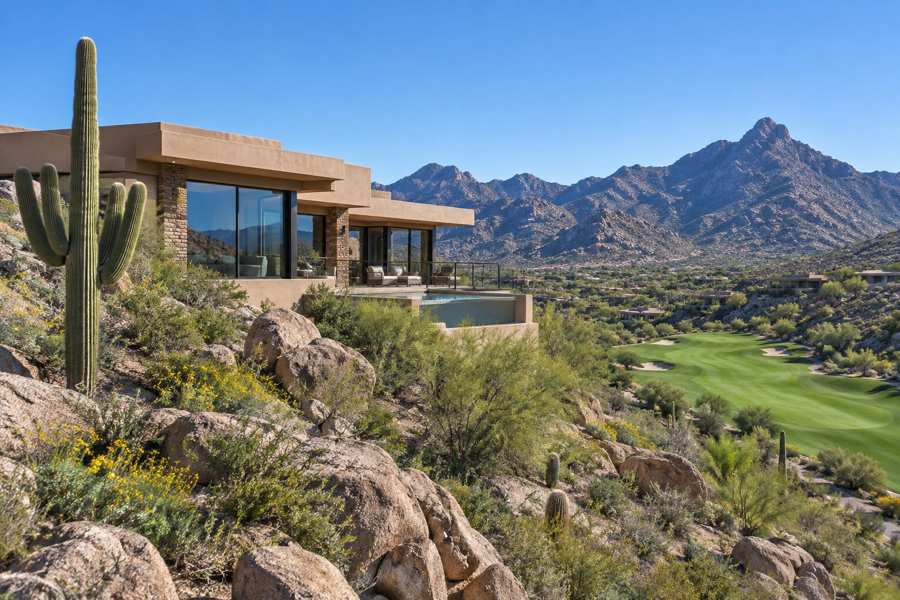
Is a third of La Quinta empty? The Census says so in a narrow, statistical sense. In the postal area that covers most of the city, 24,747 homes exist, 15,933 have someone living in them as a usual residence, and 8,814, or 35.6%, do not. The Census calls those homes vacant. This brief reads the figure as the footprint of a resort town in which many owners live elsewhere for part of the year, but that reading is an inference, since the Census figure alone does not say why a home is vacant.
The prices tell a related story of a market that is hard to summarize. Realtor.com shows a median sold price of $661,725 for August 2026. Redfin shows $864,530 for the three months to June. A market-data page that tracks closings shows $792,000 over six months, with the middle half of sales between $540,000 and $1,425,000. A local post quoting Homes.com shows $840,000 over twelve months. Inside the city the gap is wider. The same post gives a median of $535,000 for La Quinta Cove and $4,450,000 for Hideaway, a ratio of 8.3 to 1.
Maison Off-Market buys luxury homes and estates directly from their owners and speaks only to sellers. We do not estimate what any home is worth, and nothing here is a valuation. This brief sets the sources side by side, shows what each one counts and states what a percentage of a price is worth in dollars. Every figure is attributed, every calculation is this brief's own arithmetic and every inference is labeled as one.
Key Findings
- Realtor.com, with indicators as of August 2026, showed a median listing price of $763,000 (down 5.09% on the year), a median sold price of $661,725 (down 10.88%), $399 per square foot, 449 active listings (down 10.90%), a median of 75 days on market, 455 rental properties and a median rent of $6,000 (Realtor.com, La Quinta market data).
- Redfin showed a median sale price of $864,530 for the three months to June 2026 (up 9.7%), 78 days on market against 65 a year earlier, 300 homes sold in June against 354, a sale-to-list ratio of 96.0%, 8.9% of homes sold above list price and 33.8% with a price drop (Redfin, La Quinta housing market).
- A market-data page tracking closings in the city limits showed 565 closings in six months, a median of $792,000 and $375 per square foot, with the middle half between $540,000 and $1,425,000 and a median of 57 days from listing to contract (Resideline, La Quinta housing market).
- A local agent's September 2026 post quoted Homes.com for a twelve-month median sale price of $840,000 (up 5%), $800,000 for single-family homes, an average of 74 days on market and 3.7 months of supply, with neighborhood medians of $535,000 in La Quinta Cove, $1,100,000 in PGA West, $1,671,500 in Rancho La Quinta and $4,450,000 in Hideaway (Coachella Valley market update, September 2026).
- Zillow's index was $735,232, up 0.0% on the year, with homes going pending in around 57 days, as updated on August 31, 2026 (Zillow, La Quinta home values).
- The Census shows a postal area with 38,666 residents, a median household income of $99,277, a median owner-occupied home value of $661,600 and a vacancy rate of 35.6% (Census Reporter, American Community Survey profile).
What does a 35.6 percent vacancy rate mean?
The Census counts a home as occupied when someone lives in it as a usual residence. Of the 24,747 homes in the postal area, 15,933 meet that test and 8,814 do not. The vacancy rate is 8,814 divided by 24,747, or 35.6%. For comparison, the Oak Forest post in this series, for a Houston area with 13,831 homes, shows 9.5%, and the Shenandoah post, for a Miami area, shows 7.5%. La Quinta's figure is between 3.7 and 4.7 times higher than those two, which is this brief's arithmetic.
The figure does not mean that a third of the homes are for sale or unwanted. Only 449 homes are for sale on Realtor.com, which is 1.8% of all the homes, so vacancy is not driven by listings. The more likely reading, which is an inference and not something the Census table states, is that many of the homes belong to owners who use them for part of the year, such as golf and resort owners who live elsewhere. A rental count supports part of that. Realtor.com shows 455 rental properties, nearly as many as the 449 for sale, at a median rent of $6,000.
The tenure split shows the other side. Of the 15,933 occupied homes, 12,082 (75.8%) are owner-occupied and 3,851 (24.2%) are rented. Think about what that does to a sale. A seller in La Quinta is therefore selling into a market in which a large share of buyers may be second-home buyers, and a large share of sellers may be part-time residents. A public listing signals to the whole market that a part-time owner is selling, and an empty house is easy to notice. A private conversation does not. Owners who live in another state may also find showings hard to coordinate, which is a practical reason some prefer to avoid them.
The age of the stock fits the same picture. The median year built is 1999. The 2000s is the largest decade, with 9,015 homes, and the 1990s follows with 5,884, so the two decades together make up 60.2% of the postal area's homes. Only 14.1% of homes were built before 1980. This is a city built in the last few decades around golf and desert living, and it has little of the old housing found in the Houston and Miami areas covered elsewhere in this series.
Why are the sold medians $661,725, $792,000, $840,000 and $864,530?
Four of the sources give a sold median for La Quinta and they cover different periods. Realtor.com's $661,725 is for August. Redfin's $864,530 is for the three months to June. Resideline's $792,000 is for six months, and Homes.com's $840,000, as quoted by a local agent, is for twelve. The highest is 1.31 times the lowest. The Zillow index, $735,232, is not a sale price, since it is an index of estimated values.
The Realtor.com figure is the outlier, and it is also the one that moved most. The page shows it down 10.88% on the year and 18.31% over three years. A single month of sales is far more volatile than a three-month or twelve-month median, particularly in a market where, by Resideline's count, about 94 homes close in a typical month (565 closings over six months, this brief's arithmetic). Redfin's own counts show the problem: 300 homes sold in June against 354 a year earlier, a drop of 15.2%.
Counts do not agree either. Redfin's 300 sales in June sit far above the roughly 94 a month implied by Resideline's 565 in six months. A property data page shows 1,205 residential sales in twelve months in one place and 1,182 in another place on the same page, about 100 a month (Property Focus, La Quinta housing market). The sources must be covering different sets of homes, and none of them says which. June may also be a seasonal peak, but no page says so.
The pair of figures that match is a coincidence worth noting. The Census median value of an owner-occupied home, $661,600, is within $125 of Realtor.com's $661,725 sold median. The first is an owner's own estimate across a postal area for 2020 to 2024, and the second is a single month of 2026 sales. This brief treats the match as a coincidence and not as evidence that either figure is right.
| Source | Figure | Period |
|---|---|---|
| Realtor.com: median sold | $661,725 | August 2026 |
| Zillow: home value index | $735,232 | Updated August 31, 2026 |
| Resideline: median closing price | $792,000 (565 closings) | Six months to October 2026 |
| Homes.com via a local agent: median sale | $840,000 | Twelve months, September 2026 post |
| Redfin: median sale price | $864,530 (300 sold in June) | Three months to June 2026 |
Source: the pages as cited. The 1.31 times figure is this brief's arithmetic ($864,530 divided by $661,725). Commercial content; not independently verified.
How wide is the spread between La Quinta neighborhoods?
Resideline's middle half of sales ran from $540,000 to $1,425,000. The upper end is 2.64 times the lower, which is this brief's arithmetic. The page itself says this spread ranks among the widest of the California markets it tracks and says a citywide median should be treated as a weak anchor. That statement is the page's own, and it fits the numbers.
The neighborhood figures confirm it. The local agent's post, quoting Homes.com, gives a median sale price of $535,000 in La Quinta Cove, $1,100,000 in PGA West, $1,671,500 in Rancho La Quinta and $4,450,000 in Hideaway. Realtor.com's table gives median listing prices that run from $429,900 in Santa Rosa and $606,950 in Santa Carmelita at Vale la Quinta to $2,890,000 in Andalusia and $9,650,000 in the Country Club of the Desert. The last is 15.9 times the Santa Carmelita figure.
The same table shows where the listings are. Santa Carmelita has 73 homes for sale, PGA West 60, Coral Mountain 37 and the Country Club of the Desert 16. The first fifteen rows of the table add up to 278 homes, which is 61.9% of the 449 headline count. The page shows only some of the neighborhoods, so the sum is not an error, and it means that the rest of the listings are in areas the table does not name.
For a seller, the practical point is that the right comparison set is the neighborhood and often the street, and not the city. A buyer of a $9,650,000 country club home and a buyer of a $429,900 home in Santa Rosa are not in the same market, and a city median describes neither.
How long does a La Quinta sale take?
Redfin shows 78 days on market for the three months to June, and its competitiveness page says the average home sells about 4% below list and goes pending in around 84 days. Realtor.com shows a median of 75 days in August and a sale-to-list ratio of 97%, with homes selling 2.52% below the asking price. Resideline shows 57 days from listing to contract and 14 days from contract to closing. Zillow shows around 57 days to pending. The local agent's post quotes 74 days.
Those clocks are not alike. Redfin and Realtor.com count days on market, which in many systems runs until a home is under contract or sold, and the pages do not say which. Resideline separates the time to a contract from the time to close, which is a useful split: 57 days to find a buyer and 14 more to complete. The pages also differ on the mood of the market. Realtor.com's page calls it a cool market in one place and balanced in another, and Redfin rates it not very competitive.
Price drops are the other signal. Redfin shows 33.8% of homes with a price drop and 8.9% selling above the list price. That is about one home in three with a cut and about one in eleven above the ask, which is this brief's arithmetic. A seller who prices at the top of a spread as wide as this one has a real chance of needing a cut.
The seasonality of the city is a further caution. Resort and golf markets often move with the calendar, with owners visiting in the cooler months and leaving in the heat. That pattern is general knowledge about desert resort towns and not a finding from any of these pages. This brief does not have a source on it, so it will not guess, but a market in which a third of homes are vacant by Census count may behave differently from one in which every home is a primary residence.
What do the regional series and distress counts add?
Realtor.com publishes series for the Riverside-San Bernardino-Ontario area through the Federal Reserve Bank of St. Louis. They describe a region that includes La Quinta and many other places, and the city is not shown separately. The median days on market there rose from 54 in March to 61 in July, up 13.0% (Realtor.com, days on market). Active listings rose from 12,037 in March to 13,344 in July, up 10.9% (Realtor.com, active listings). The count of listings with a price reduction rose from 3,804 in April to 4,176 in August, up 9.8% (Realtor.com, price reduced count). The median listing price was $592,450 in July against $593,217 in March (Realtor.com, median listing price), almost flat.
The regional median listing price of $592,450 is 78% of the La Quinta median listing price of $763,000. That is this brief's arithmetic, and it says that the city's asking prices sit above the region's. The direction is the same in both, with more inventory, more reductions and longer waits this summer than in the spring.
The same property data page adds counts that are not about prices. It shows 42 properties in pre-foreclosure and 1,162 involuntary liens in the city, and says that 79.9% of homes have more than half their value in equity and that 9,112 are fully paid off. The page does not say how it defines these, and the numbers describe the whole stock, not the homes now for sale. Still, they point to a market in which most owners are not under financial pressure to sell, so a sale is usually a choice.
These are regional and commercial figures, not La Quinta figures. The series titles were checked on their series pages. A Movoto page that also appeared in the search shows figures from March 2025 and was last updated in April 2025, so it is too old to use here. Readers comparing markets can also read the Manhattan Beach brief and the Brentwood, Los Angeles brief.
Source: Realtor.com series published by the Federal Reserve Bank of St. Louis as cited, and a property data page. The 13.0%, 10.9%, 9.8% and 78% figures are this brief's arithmetic. The series names were checked against the series pages.
What should an owner ask, and what does a private sale change?
Ask which neighborhood a number covers and over how many months. Ask how many closings sit behind it, and whether it counts houses only or condominiums as well. A seller whose home is in a golf community should ask about that community, and a seller in the Cove should ask about the Cove. A citywide median should be treated as background.
A private sale changes how a home reaches a buyer. With Maison Off-Market there are no showings and no neighbors talking about a sale, the closing date can be flexible so that an owner has time to find a new home, there are no commission costs, there are no closing costs and there are no inspections or repairs. For a part-time owner who lives elsewhere, not having to host showings or arrange repairs from a distance may matter most. This brief does not claim that a private sale always brings a higher price than a public listing.
Fee arithmetic shows why the commission point matters, without assuming any rate. Each 1% of a sale price is $6,617.25 at $661,725, $7,920 at $792,000 and $8,650 at $865,000. At 3% those amounts are $19,851.75, $23,760 and $25,950. At 5% they are $33,086.25, $39,600 and $43,250. These are illustrations of what a percentage means on each of the figures in this brief, and they are not a statement of what any agent charges or what any sale would cost.
Timing is the other thing an owner controls. A public listing starts a clock that buyers can see, and the pages above show 57 to 84 days. A private sale lets the owner choose the closing date, which matters most to people who need to find the next home first.
Privacy deserves a word here. A public listing puts photographs, a price history and the dates of every price change in front of anyone with a phone. In a community where neighbors know which homes are used part of the year, an owner may prefer that a sale not become a topic of conversation. That is a preference and not a claim about price. If you are weighing a sale of a La Quinta home, one conversation costs nothing and obliges you to nothing. We ask about the home, the timing you would like and what you would need from a buyer, and we say plainly whether a private sale fits.
If you would like a private, no-obligation offer for a La Quinta home, call 401-219-4207 or use the contact form on this site.
Methodology and limitations
Prices, days on market, sale-to-list ratios and counts come from Realtor.com's city page with indicators as of August 2026, Redfin's city page for the three months to June 2026, a market-data page for closings tracked in the six months to October 2026, a local agent's September 2026 post that quotes Homes.com, Zillow's value index page updated August 31, 2026 and a property data page for October 2026. The sources cover different periods and home types, and most are commercial pages, so they are not independent of each other.
Census figures come from the American Community Survey 2020-2024 five-year estimates for the postal area, through Census Reporter. Regional series are Realtor.com data published by the Federal Reserve Bank of St. Louis for the Riverside-San Bernardino-Ontario area, and the series titles were checked on the series pages. Percentages, gaps, ratios and fee amounts are this brief's own arithmetic and are labeled as such. Where a reading goes beyond what a page says, it is called an inference. No agent names, contact details or street addresses from the pages are reproduced.
Conclusion
The La Quinta record shows a vacancy rate of 35.6%, sold medians from $661,725 to $864,530, a middle half of sales from $540,000 to $1,425,000, neighborhood medians from $535,000 to $4,450,000 and 57 to 84 days to sell. The numbers differ because the periods, the home types and the neighborhoods differ, and the city is a resort market with many part-time owners.
It does not fix a price for any one home. The choice between a public listing and a private sale comes down to whether an owner would rather meet showings, price drops and a public clock, or sell quietly on a date that suits them. Maison Off-Market speaks only to sellers, and a conversation costs nothing.
Frequently Asked Questions
What is the median home price in La Quinta, California?
It depends on the source and period. Realtor.com shows a median sold price of $661,725 for August 2026. A market-data page shows $792,000 over six months. Redfin shows $864,530 for the three months to June.
How many homes in La Quinta are vacant?
The Census counts 8,814 of 24,747 homes in the postal area as vacant, or 35.6%. The count does not say why each home is vacant.
How long do homes take to sell in La Quinta?
Realtor.com shows a median of 75 days on market in August 2026. Redfin shows 78 days to June. A market-data page shows 57 days from listing to contract and 14 more to close.
How much do La Quinta neighborhoods differ in price?
A local agent quoting Homes.com gives median sale prices of $535,000 in La Quinta Cove, $1,100,000 in PGA West, $1,671,500 in Rancho La Quinta and $4,450,000 in Hideaway.
What is the difference between a private sale and a public listing?
A private sale with Maison Off-Market has no showings, a flexible closing date, no commission costs, no closing costs and no inspections or repairs. A public listing exposes the home to a wider group of buyers. This brief does not claim either always gets a higher price.
Compare your options before committing. Request a written private offer for your property, with no obligation, then weigh it against your listing plan.
Sources
- Realtor.com, 2026. La Quinta, CA Housing Market and Rental Trends. https://www.realtor.com/local/market/california/riverside-county/la-quinta.
- Redfin, 2026. La Quinta Housing Market Trends. https://www.redfin.com/city/10297/CA/La-Quinta/housing-market.
- Resideline, 2026. La Quinta, CA Housing Market 2026: Median Price and Trends. https://resideline.com/blog/la-quinta-ca-housing-market.
- Coachella Valley market update, 2026. La Quinta CA Real Estate Market, September 2026. https://nicolerodillbeck-coachellavalley.sites.c21.homes/2026/09/21/la-quinta-ca-real-estate-market-september-2026.
- Zillow, 2026. La Quinta, CA Housing Market: 2026 Home Prices and Trends. https://www.zillow.com/home-values/18883/la-quinta-ca/.
- U.S. Census Bureau, 2026. American Community Survey 2020-2024 five-year estimates, the La Quinta area (via Census Reporter). https://censusreporter.org/profiles/86000US92253-92253/.
- Property Focus, 2026. La Quinta Housing Market Overview and Trends in 2026. https://www.propertyfocus.com/trends/city/ca/la-quinta.
- Realtor.com, 2026. Housing Inventory: Median Days on Market in Riverside-San Bernardino-Ontario, CA (CBSA). https://fred.stlouisfed.org/series/MEDDAYONMAR40140.
- Realtor.com, 2026. Housing Inventory: Active Listing Count in Riverside-San Bernardino-Ontario, CA (CBSA). https://fred.stlouisfed.org/series/ACTLISCOU40140.
- Realtor.com, 2026. Housing Inventory: Price Reduced Count in Riverside-San Bernardino-Ontario, CA (CBSA). https://fred.stlouisfed.org/series/PRIREDCOU40140.
- Realtor.com, 2026. Housing Inventory: Median Listing Price in Riverside-San Bernardino-Ontario, CA (CBSA). https://fred.stlouisfed.org/series/MEDLISPRI40140.
Related research

Seller Guide · October 6, 2026
How to Prepare Point Pleasant Beach Rental Records Before Selling
Separate rental approval, income history and booked stays before comparing sale terms.

Seller Guide · October 6, 2026
How to Prepare Rumson Flood and Waterfront Records Before Selling
Separate flood disclosure, elevation, repairs and waterfront rights before comparing sale terms.

Seller Guide · October 6, 2026
How to Prepare Sarasota Condo Inspection and Reserve Records Before Selling
Separate building condition, reserve funding and resale documents before comparing sale terms.