Market Brief · by Aidan Sowa · October 5, 2026
How Much of Blue Ridge Is a Second Home Market? Reading the Seasonal Homes, the Slow Waits and the Price Gap to Local Incomes
Reading the Seasonal Homes, the Slow Waits and the Price Gap to Local Incomes for Blue Ridge, GA, with each source dated and its limits noted, for owners weighing a listing against a direct sale.
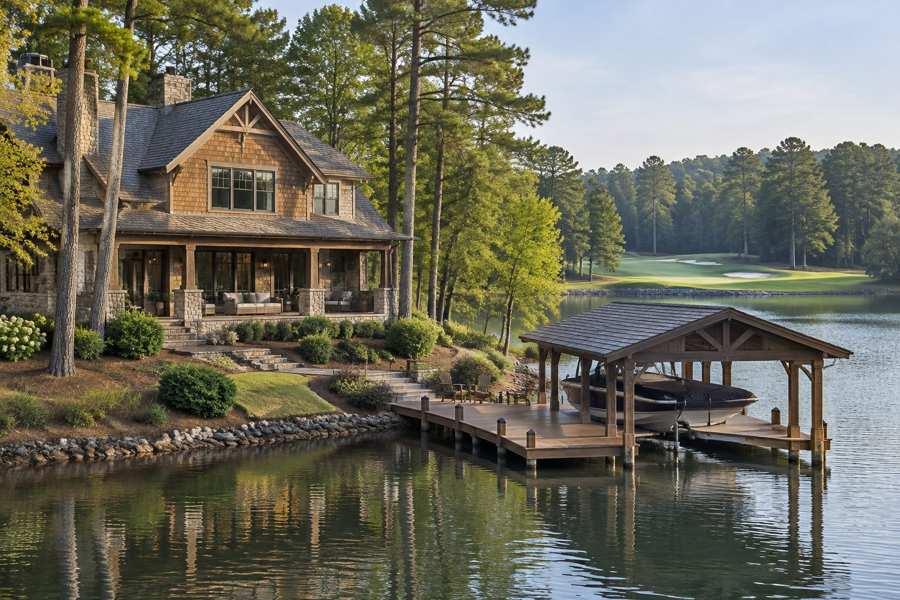
How much of Blue Ridge is a second home market? The Census gives a direct answer that no price page can. Of 9,046 housing units in the postal area that includes Blue Ridge, 2,866, or 31.7%, are held for seasonal, recreational or occasional use, and only 5,644 are occupied year-round. Redfin's page, covering the three months to August 2026, shows a median sale price of $649,719, up 11.3% in a year, with a median of 67 days on the market and multiple offers described as rare. Realtor.com's page for September 2026 shows a sold median of $625,000, up 17.92% in a year, and calls the area a buyer's market.
The Census median household income is $56,331, so the Redfin median is 11.5 times the income of the typical year-round household. That gap says that the prices on these pages are not set by local earnings alone, though the pages do not say who the buyers are. A seller in this market should read the figures with that in mind.
Maison Off-Market speaks only to sellers, and this brief is for an owner in Blue Ridge. Every figure is dated and linked, every ratio is computed here from the published figures, and where a source is dated, conflicting or from a small sample the brief says so. Nothing here says that a private sale always beats a public listing.
Key Findings
- Redfin's page, for the three months ending August 2026, shows a median sale price of $649,719, up 11.3% from a year before, $304 per square foot, down 11.1%, 125 homes sold in August against 104 a year before, up 19.7% on the page's own figure, and a median of 67 days on the market, with its text giving 68 a year before. The sale-to-list ratio was 95.9%, up 1.1 points, and 7.4% of homes sold above list, up 0.7 points (Redfin, Blue Ridge postal area housing market). The page rates the area not very competitive, with a score of 29 out of 100, says that multiple offers are rare, that the average home sells for about 4% below list and goes pending in around 82 days, and that hot homes sell for about 1% below list in around 26 days. It does not show a price-drop figure.
- Realtor.com's page, with key indicators as of September 2026 and changes shown against a month before and a year before, shows a median listing price of $699,000, up 2.19% and down 0.73%, a median sold price of $625,000, down 16.67% and up 17.92%, $328 per square foot, down 0.29% and 5.12%, 554 active listings, up 3.28% and 13.04%, a median of 84 days on the market, up 2.47% and down 10.75%, 14 rentals, down 16.67% and flat, and a median rent of $2,550, down 15% and up 10.87% (Realtor.com, Blue Ridge postal area housing market). Its sale-to-list ratio was 95%, with homes selling an average of 5.15% below the asking price, and it calls the area a buyer's market.
- Zillow's page for the postal area shows an average home value of $522,873, down 0.3% over the past year, with homes going to pending in around 42 days, updated on May 31, 2026 (Zillow, Blue Ridge postal area home values). It is the oldest of the three pages.
- In the Census postal area, 9,046 housing units were counted, 5,644 occupied, 3,947 by owners and 1,697 by renters, and 3,402 vacant, of which 2,866 are seasonal. The median build year is 1998, the median owner value is $358,500, plus or minus $37,285, the median gross rent is $842, plus or minus $123, and the median household income is $56,331, plus or minus $4,614.
- The picture is a buyer's market with long waits, a large share of homes that sit empty for part of the year, a median price far above local incomes, and a Redfin median whose rise comes with a fall in price per square foot. An owner reading only one page would reach a different conclusion from an owner reading the other.
Which Blue Ridge price figure should an owner trust?
None alone. Redfin's median of $649,719, up 11.3%, implies about $583,755 a year earlier, and its price per square foot of $304, down 11.1%, implies about $342. Realtor.com's sold median of $625,000, up 17.92% in a year, implies about $530,020 a year earlier, and down 16.67% in a month implies about $750,030 a month earlier. The Realtor.com sold median is 3.8% below the Redfin median, and the two cover different windows, a single recent month and a quarter that ends in August.
The Redfin figures pull in different directions. The median price is up 11.3% while the price per square foot is down 11.1%. That pattern fits a quarter in which larger homes sold, since a larger home can have a higher price and a lower price per foot. That is an inference, not a statement from the page, and the page does not show the sales behind the figures. Realtor.com's per-foot figure of $328 is 7.9% above Redfin's $304, down 5.12% in a year, which implies about $346 a year earlier, and down 0.29% in a month, which implies about $329.
The asking median is $699,000, down 0.73% in a year, implying about $704,140 a year earlier, and up 2.19% in a month, implying about $684,020. It is 11.8% above the Realtor.com sold median. The same page says that homes sold an average of 5.15% below the asking price, so a seller who lists near the asking median should expect to settle below it.
The Zillow figure of $522,873, down 0.3%, implies about $524,446 a year before it was calculated, and it is dated May 31, 2026. It is 19.5% below the Redfin median and 16.3% below the Realtor.com sold median. The Census median owner value of $358,500, plus or minus $37,285, is an average of owners' own estimates over five years, and the Redfin median is 81.2% above it. The Census value is 6.4 times the median household income of $56,331, plus or minus $4,614.
The best guide is closed sales of similar homes in the same part of the postal area in the last few months. In a market where a large share of homes serve second-home buyers, the sales that matter are the ones that match the home in type, size and setting, and a seller should ask for the days on the market, the final price against list and the number of price cuts for each.
| Source | Figure | What it measures |
|---|---|---|
| Census Reporter | $358,500 | Median owner value |
| Zillow | $522,873, down 0.3% | Home value index, May 31, 2026 |
| Realtor.com | $625,000, up 17.92% | Median sold price, September 2026 |
| Redfin | $649,719, up 11.3% | Median sale price, three months to August 2026 |
| Realtor.com | $699,000, down 0.73% | Median listing price, September 2026 |
Sources as cited. Ratios and earlier values in this section are computed from the published figures and percentages.
How long do Blue Ridge homes wait, and how far below asking do they sell?
The wait is long. Redfin shows a median of 67 days on the market, flat in a year, and says that the average home goes pending in around 82 days, while hot homes go in around 26 days. Realtor.com shows a median of 84 days, down 10.75% in a year, which implies about 94 days a year earlier, and up 2.47% in a month, which implies about 82 days a month earlier. Zillow's page says homes go to pending in around 42 days as of May 31. The three pages put the wait at between six weeks and three months.
Redfin describes the area as not very competitive, with a score of 29 out of 100. Its page says that multiple offers are rare, that the average home sells for about 4% below list and that hot homes sell for about 1% below list. Its sale-to-list ratio of 95.9% is close to Realtor.com's 95%, and the two agree that the typical home sells below the asking price.
Above-list sales are rare. Redfin shows that 7.4% of homes sold above list, up 0.7 points from a year before, which implies about 6.7% a year earlier, and a sale-to-list ratio that rose 1.1 points, which implies about 94.8% a year earlier. About one home in fourteen sold above asking. A seller who prices at the top of the range should expect a long wait or a cut, and a cut on a public listing is visible to every buyer and neighbor.
Supply is large. Realtor.com shows 554 active listings, up 3.28% in a month, which implies about 536 a month earlier, and up 13.04% in a year, which implies about 490 a year earlier. Redfin shows 125 homes sold in August, up 19.7% on the page's own figure, from 104. Listings that outnumber a month's sales many times over mean a long wait for a buyer, and the pages do not compute months of supply.
Rentals are few. Realtor.com shows 14 rental properties, down 16.67% in a month, which implies about 17 a month earlier, and flat in a year. The median rent of $2,550, down 15% in a month, implies about $3,000 a month earlier and, up 10.87% in a year, about $2,300 a year earlier. The count is so small that one lease can move the median, and the asking rent is 202.9% above the Census median gross rent of $842, plus or minus $123, which covers all renters.
Sources as cited. Earlier values and differences are computed from the published percentages.
Who lives in Blue Ridge year-round, and how many homes sit empty?
More than a third of the housing is vacant. Of 9,046 units, 5,644 are occupied, 62.4%, and 3,402 are vacant, 37.6%. The Census counts 2,866 vacant units as held for seasonal, recreational or occasional use, 31.7% of all units and 84.2% of the vacant ones. It counts 261 for rent, 23 sold and not yet occupied and 252 other vacant units, and none for sale only. A vacancy count in a survey is taken at one moment, and a second home can be counted as vacant or occupied depending on when it is visited.
Of the 5,644 occupied homes, 3,947 are owner-occupied, 69.9%, and 1,697 are renter-occupied, 30.1%. Owners have moved in at many times. Of 3,947 owner households, 154 moved in during 2023 or later, 3.9%, 587 between 2020 and 2022, 14.9%, 1,382 in the 2010s, 35.0%, 851 in the 2000s, 21.6%, 505 in the 1990s, 12.8%, and 468 before 1990, 11.9%. Owners who moved in since 2010 are 53.8%. Renters are newer still: of 1,697, 491 moved in during 2020 to 2022 and 1,031 in the 2010s.
The population is old. Of 11,791 people counted, 1,328 are under 18, 11.3%, 980 are 18 to 24, 8.3%, 1,074 are 25 to 34, 9.1%, 711 are 35 to 44, 6.0%, 3,520 are 45 to 64, 29.9%, and 4,178 are 65 or older, 35.4%. Owner homes are mid-sized. Of 3,947, 1,690 have three bedrooms, 42.8%, 1,144 have two, 29.0%, 518 have four, 13.1%, 445 have five or more, 11.3%, and 139 have one. Four or more bedrooms account for 24.4% of owner homes.
Many owners have no mortgage. Of 3,947 owners, 1,689 have a mortgage, 42.8%, and 2,258 do not, 57.2%. Among the 1,677 mortgage holders with a computed figure, 606 spent 30% or more of income on housing costs, 36.1%, and 311 spent 50% or more, 18.5%. Among the 2,258 owners without a mortgage, 346 spent 30% or more, 15.3%, and 150 spent 50% or more, 6.6%, mostly the cost of taxes, insurance and upkeep. These shares are taken against the income of year-round households, whose median is $56,331.
Renters carry a heavy burden. Of 1,697 renters, 1,537 with a computed figure, 688 spent 30% or more of income on rent, 44.8%, and 240 spent 50% or more, 15.6%. Renter homes are mostly two-bedroom: 1,061 of 1,697, 62.5%, have two bedrooms, 361 have three and 131 have none. A median asking rent of $2,550, over a year, is 54.3% of the median household income, though the asking rent rests on only 14 rentals.
Source: U.S. Census Bureau, American Community Survey 2020-2024 five-year estimates, tables B01001, B25003, B25004, B25038, B25042, B25070 and B25091, via Census Reporter. Shares are computed here.
How old is the Blue Ridge stock, and what kinds of homes are there?
Most of it was built from the 1990s to the 2000s. Of 9,046 units, 231, or 2.6%, were built before 1940, 261, or 2.9%, in the 1940s, 211, or 2.3%, in the 1950s, 223, or 2.5%, in the 1960s, 1,104, or 12.2%, in the 1970s, and 1,302, or 14.4%, in the 1980s. After that, 1,546, or 17.1%, were built in the 1990s, 2,743, or 30.3%, in the 2000s, 1,301, or 14.4%, in the 2010s and 124, or 1.4%, in 2020 or later. The 2000s alone account for 30.3%, and homes built before 1980 total 2,030, or 22.4%.
The mix of building types is mostly houses. Of 9,046 units, 7,314 are in detached homes, 80.9%, 157 are attached, 1.7%, 169 are in two-unit buildings, 329 in buildings of three or four units, 166 in buildings of 5 to 9, 114 in buildings of 10 to 19, 261 in buildings of 20 to 49 and 15 in buildings of 50 or more. The Census also counts 501 mobile homes, 5.5%, and 20 boats, recreational vehicles or vans. A median across all types blends houses with mobile homes and small multi-unit buildings.
Homes of the 1990s and 2000s are the core of the stock. Homes of that age can have roofs, decks, heating and cooling systems and water heaters that are near the end of their life, and a buyer's inspector may list several items. A home that sits empty for part of the year can also need extra checks of its systems, though that depends on the home. These are general points about homes of this age and use, not figures from the sources, and each home is different.
For a seller of a second home, a long listing carries its own costs. Carrying costs continue while the home is on the market, showings can be hard to arrange for an owner who lives elsewhere, and a buyer's inspection can bring repair requests that the owner must manage from a distance. These are practical points about owning a home from afar, not figures from the pages.
A seller who would rather not have an inspector's list negotiated on a public listing can choose a private sale, in which a buyer buys the home as it stands. That is the fifth benefit of Maison Off-Market, avoiding inspections and repairs, and it is not a claim that a private sale always yields a higher price. Readers comparing markets can also read the Eatonton brief and the Alpharetta brief.
Source: U.S. Census Bureau, American Community Survey 2020-2024 five-year estimates, tables B25024, B25034 and B25042, via Census Reporter. Shares are computed here.
What should a Blue Ridge owner ask before choosing a listing or a private sale?
Five questions are worth asking. Is my price based on closed sales of homes like mine in the last few months, and not on one median? How many months might a listing take, and how many price cuts are likely along the way? What will inspections and repairs cost me on a home of this age? Who will see the home during showings, and who will hear about the sale? And what date do I need to close, given where I plan to live next?
Fees are simple arithmetic, and no rate is assumed here. Each 1% of a $450,000 sale is $4,500, of a $725,000 sale is $7,250, and of a $1,200,000 sale is $12,000. At 3%, those sales cost $13,500, $21,750 and $36,000, and at 5% they cost $22,500, $36,250 and $60,000. At the Redfin median of $649,719, 1% is $6,497 and 5% is $32,486. Maison Off-Market does not charge commissions or closing costs.
A private sale has no showings and no neighbors talking about it, which is the first benefit. The second benefit is a closing date the owner can set, which gives time to find a new home. The third is no commission costs, the fourth is no closing costs and the fifth is avoiding inspections and repairs. In a postal area where homes wait about two to three months and sell below the asking price, a closing date the owner controls and a sale without showings are worth weighing against a long listing.
In a slow market, an owner is right to compare a listing with a private offer. The comparison includes the commission, the closing costs, the repairs a buyer may ask for, the months of carrying costs while the home is listed, the price cuts that may come, and the privacy given up. A fair comparison puts all of those items on the same page, and the listing result should be a realistic one, not the best case.
Maison Off-Market buys luxury homes and estates directly from their owners and speaks only to sellers. It does not say that every private sale beats a listing. An owner who wants to see what a direct purchase would look like, with no public listing and no showings, can use the contact form below and ask for an offer before deciding.
Sources as cited. Fee illustrations are arithmetic only and assume no commission rate.
Methodology and limitations
Each page's date, title and place were read before use. The Redfin page covers the three months ending August 2026 and the Realtor.com page is dated September 2026, so the two cover different windows. The Zillow page is for the postal area and is dated May 31, 2026, which makes it the oldest of the three. The Redfin page shows 67 days on the market with no change in one place and 68 days a year earlier in its text, and the brief reports both. The Redfin median rises while its price per square foot falls, and the brief reads that as a possible change in the mix of homes sold, which is an inference. The Census figures are five-year survey estimates with margins of error, and the vacancy and tenure counts are survey counts, not a count of every home. Earlier values are computed from published percentages and are approximate. No figure here is a forecast.
Conclusion
The record for this part of Blue Ridge, as far as the pages allow, is a buyer's market with waits of two to three months, a large share of homes held for seasonal use, prices far above local incomes, and a Redfin median that rises while its price per foot falls. For an owner, the practical step is to ask for the closed sales of comparable homes, compare the cost of a long listing with a direct offer, and decide how much of the showing, inspection and timing risk to carry.
Frequently Asked Questions
What is the median home price in this part of Blue Ridge?
Redfin showed a median sale price of $649,719 for the three months to August 2026, up 11.3%. Realtor.com showed a median sold price of $625,000 for September 2026, up 17.92%, and a median listing price of $699,000. The Census median owner value is $358,500.
How long do Blue Ridge homes take to sell?
Redfin showed a median of 67 days for the three months to August 2026. Realtor.com showed a median of 84 days for September 2026, and Zillow showed homes going to pending in around 42 days as of May 31.
Do Blue Ridge homes sell above asking?
Rarely. Redfin showed a sale-to-list ratio of 95.9% and 7.4% of homes sold above list. Realtor.com showed a ratio of 95% for September.
How many Blue Ridge homes are seasonal?
The Census counts 2,866 of 9,046 housing units in the postal area, 31.7%, as held for seasonal, recreational or occasional use.
Can I sell my Blue Ridge home privately?
Yes. Maison Off-Market buys luxury homes and estates directly from their owners with no showings, flexible closing dates, no commission costs, no closing costs and no inspections or repairs. It does not say a private sale always beats a listing.
Compare your options before committing. Request a written private offer for your property, with no obligation, then weigh it against your listing plan.
Sources
- Redfin, postal area housing market, 2026. Housing Market Trends. https://www.redfin.com/zipcode/30513/housing-market.
- Realtor.com, postal area housing market, 2026. Housing Market Data. https://www.realtor.com/local/market/georgia/zipcode-30513.
- Zillow, postal area home values, 2026. Housing Market: 2026 Home Prices and Trends. https://www.zillow.com/home-values/71163/blue-ridge-ga-30513/.
Related research

Seller Guide · October 6, 2026
How to Prepare Point Pleasant Beach Rental Records Before Selling
Separate rental approval, income history and booked stays before comparing sale terms.

Seller Guide · October 6, 2026
How to Prepare Rumson Flood and Waterfront Records Before Selling
Separate flood disclosure, elevation, repairs and waterfront rights before comparing sale terms.

Seller Guide · October 6, 2026
How to Prepare Sarasota Condo Inspection and Reserve Records Before Selling
Separate building condition, reserve funding and resale documents before comparing sale terms.