Trend Analysis · by Aidan Sowa · October 5, 2026
Why Are Alpharetta Listings Piling Up? Reading the Build Years, the Inventory Counts and the Price per Square Foot
Reading the Build Years, the Inventory Counts and the Price per Square Foot for Alpharetta, GA, with each source dated and its limits noted, for owners weighing a listing against a direct sale.
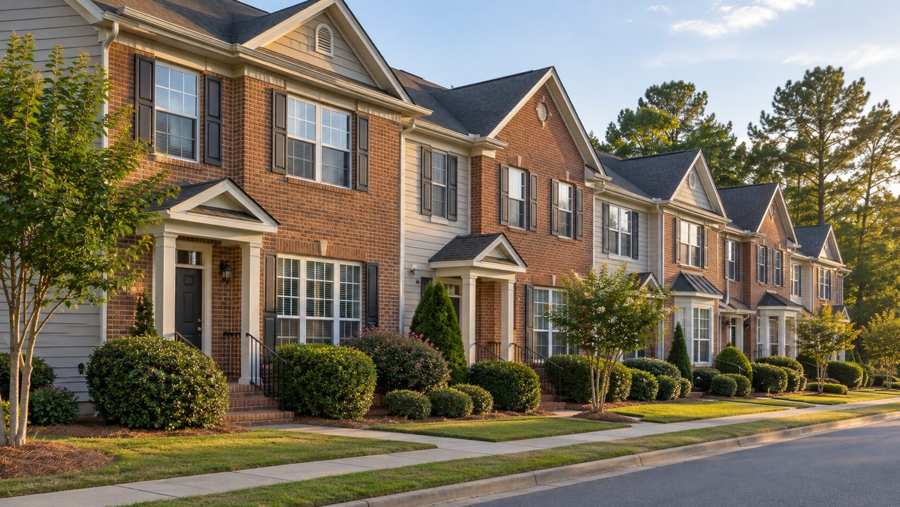
Owners of older townhomes in Alpharetta are selling into a different housing stock than owners in most of the country. Only 1,218 of the area's 9,131 housing units (13.3%) were built before 1980, and the median home dates from 1999 (U.S. Census Bureau, 2020-2024). Another 2,748 units, 30.1% of the total, have been built since 2010. An older townhome here is often a 1980s or 1990s one, and it sits among a large supply of newer homes.
The supply is growing across the region. Metropolitan Atlanta had 29,735 active listings in September 2026, which is 4.3% more than a year earlier and 89.5% more than three years earlier (Realtor.com, 2026). This report reads the age tables against the inventory and price series to show what a seller of an older townhome is competing against, and where the evidence ends.
Key Findings
- The Alpharetta study area has 9,131 housing units. 1,218 (13.3%) predate 1980, 3,456 (37.8%) were built in the 1980s and 1990s, and 2,748 (30.1%) since 2010.
- The median owner-estimated home value is $640,500, plus or minus $30,054. That is 54% above the metro area's median list price of $415,000 (U.S. Census Bureau, 2020-2024; Realtor.com, list price, 2026).
- Active listings in metro Atlanta reached 29,735 in September 2026, up from 15,693 three years earlier and 11,693 five years earlier.
- Median days on market were 60 in September 2026, the same as a year before. The September reading three years earlier was 43 (Realtor.com, days on market, 2026).
- The median list price per square foot was $194 in September 2026, against $195 a year earlier and $179 five years earlier (Realtor.com, price per square foot, 2026).
How new is the housing around the Alpharetta area?
The Census sorts housing units by decade built. In this part of Alpharetta the largest group is units built since 2010, at 2,748. The 2000s follow with 1,709, then the 1980s with 1,919 and the 1990s with 1,537. Everything built before 1980 adds up to 1,218 units, and homes from before 1960 number only 199.
For a seller, the useful reading is relative. A townhome finished in 1988 is older than roughly two thirds of the units in the area, though by national standards it is not old. Buyers who tour it will also tour homes built in the last fifteen years, and those homes set the baseline for finishes, layout and systems.
Source: U.S. Census Bureau, American Community Survey 2020-2024 five-year estimates, tables B25034 and B25077, the postal-code area studied in Alpharetta.
Is the area more expensive than the metro area around it?
Yes, by a wide margin. The area's median owner-estimated value is $640,500, with a margin of error of $30,054, or 4.7%. The metro area's median list price in September 2026 was $415,000. The ratio is 1.54 (U.S. Census Bureau, 2020-2024; Realtor.com, list price, 2026).
The two numbers measure different things, since one is an owner estimate and the other is an asking price, and the metro figure covers a very large area. Still, the gap is wide enough that a seller should not use metro-wide price news to value a home in this part of Alpharetta. Citywide headlines about Atlanta prices describe a market in which this area is a high-priced corner.
How fast has the supply of homes for sale grown?
The Atlanta metro area had 11,693 active listings in September 2021, 15,693 in September 2023, 28,511 in September 2025 and 29,735 in September 2026. The September 2026 count is the highest of the last five years, and the lowest reading in that span was 7,799 in February 2022 (Realtor.com, active listings, 2026; Realtor.com, new listings, 2026).
The growth did not come from a flood of new listings. New listings in September 2026 numbered 8,562, below the 8,808 of a year earlier and well below the 12,510 peak of June 2022. Supply built up because homes stayed on the market longer, not because more arrived. That distinction matters to a seller: the competition is mostly the unsold homes already there.
Source: Realtor.com via FRED, Housing Inventory: Active Listing Count and New Listing Count in Atlanta-Sandy Springs-Roswell, GA (CBSA).
How many of those listings are cutting their price?
In September 2026, 10,700 of the 29,735 active listings in metro Atlanta carried a price reduction. That is 36.0%. A year earlier the share was 38.5% (10,988 of 28,511), and three years earlier it was 39.8% (6,244 of 15,693) (Realtor.com, price cuts, 2026).
The share has drifted down about four points in three years, which suggests sellers are pricing somewhat closer to what buyers will pay. It has not fallen far. More than a third of sellers still lower their asking price after they list. A seller of an older townhome should assume a reduction is part of the likely path, and should decide in advance how many weeks to wait before taking one.
Source: Realtor.com via FRED, Housing Inventory: Price Reduced Count in Atlanta-Sandy Springs-Roswell, GA (CBSA).
Is it often said that Atlanta prices are falling?
Not in the figure most sellers care about. The median list price per square foot was $194 in September 2026. A year earlier it was $195, and three years earlier $196. Its highest reading of the last five years was $201, in April 2024, and its lowest was $181, in October 2021. Over five years it is up 8.4% from $179 (Realtor.com, price per square foot, 2026; Realtor.com, days on market, 2026).
That is a flat market, not a falling one. Inventory has nearly doubled in three years and the price per square foot has stayed within a band of about $20. The pressure shows up elsewhere: in time on the market, which was 60 days in September 2026 and has peaked at 71 days in 2026 (January), and in the price cuts counted above. For a seller, a flat price per square foot means the cost of an older, smaller or dated home is paid in time and in negotiation rather than in a lower headline price.
Source: Realtor.com via FRED, Housing Inventory: Median Listing Price per Square Feet and Median Days on Market in Atlanta-Sandy Springs-Roswell, GA (CBSA).
What is happening to local jobs?
The Bureau of Labor Statistics put the seasonally adjusted unemployment rate for the Atlanta-Sandy Springs-Roswell area at 3.2% in August 2026, against 3.3% a year earlier and 3.6% five years earlier. The 2021 high within the last five years was 3.6% and the low was 2.9%, in May 2022 (BLS, unemployment rate, 2026).
Low unemployment is why a long listing is not a sign of weak demand for housing. It supports household income, and it keeps buyers in the market. It also means that the buyers a seller does meet are probably financing the purchase and comparing it carefully, since the broader inventory gives them many alternatives.
Source: U.S. Bureau of Labor Statistics via FRED, Unemployment Rate in Atlanta-Sandy Springs-Roswell, GA (MSA), smoothed seasonally adjusted.
Who lives in Alpharetta's homes?
Of 9,131 housing units, 8,681 are occupied and 450 (4.9%) are vacant. Owners hold 5,348 of the occupied homes (61.6%) and renters 3,333 (38.4%). That share of renters is large for a suburb known for single-family neighborhoods, and it reflects the apartment and townhome communities in the area.
For a townhome seller, the renter share matters in two ways. Renters are a pool of possible first-time buyers who know the area and may want to stay. And townhome buyers who plan to rent the unit out, instead of living in it, will price it by the rent it could earn rather than by the finishes. The two kinds of buyer value the same unit differently, and a seller can decide which to aim for.
How far has the metro list price moved since 2022?
The median list price in metro Atlanta peaked at $449,663 in June 2022. It stood at $429,000 in September 2023 and at $415,000 in both September 2025 and September 2026. That is a fall of 7.7% from the peak, with no change in the last year.
The path is a plateau after a drop, not a slide. Sellers who list at a number remembered from 2022 are pricing about 8% above where the metro market has settled. The Alpharetta area sits well above the metro median, as shown earlier, but the direction of the metro series is still a fair guide to how buyers have been responding to asking prices.
Source: Realtor.com via FRED, Housing Inventory: Median Listing Price in Atlanta-Sandy Springs-Roswell, GA (CBSA).
How has each September compared since 2021?
Table 1 lines up the September reading of the main Realtor.com series for metro Atlanta over six years. The most striking row is the active listing count, which rose from 11,693 in 2021 to 29,735 in 2026. The median days on market rose from 42 to 60, a 43% increase. The price per square foot, by contrast, moved from $179 to $194 over the same years and has stayed between $194 and $198 since 2023 (Realtor.com, active listings, 2026; Realtor.com, price cuts, 2026).
The share of listings with a price cut tells a more nuanced story. It was 33.5% in 2021, jumped to 54.4% in September 2022 when interest rates rose quickly, and settled back to between 36% and 40% in each of the following four years. The 2026 reading, at 36.0%, is the lowest since 2021. Sellers are cutting less often than in the 2022 rate shock, but more than a third of listings still reduce their asking price.
| September | Median list price | Active listings | With price cut | Median days on market | Price per sq ft |
|---|---|---|---|---|---|
| 2021 | $397,975 | 11,693 | 3,922 (33.5%) | 42 | $179 |
| 2022 | $420,000 | 17,163 | 9,342 (54.4%) | 41 | $193 |
| 2023 | $429,000 | 15,693 | 6,244 (39.8%) | 43 | $196 |
| 2024 | $414,823 | 23,869 | 8,764 (36.7%) | 50 | $198 |
| 2025 | $415,000 | 28,511 | 10,988 (38.5%) | 60 | $195 |
| 2026 | $415,000 | 29,735 | 10,700 (36.0%) | 60 | $194 |
What does the calendar do to a metro Atlanta listing?
Over the thirteen months to September 2026 the median days on market read 60, 60, 61, 70 and 71 from September to January, then 56, 51, 49 and 50 from February to May, and 52, 56, 59 and 60 from June to September. The fastest month was April, at 49 days. The slowest was January, at 71 (Realtor.com, days on market, 2026; Realtor.com, active listings, 2026).
The range is 22 days, which suggests that the swing in this market comes less from the season and more from the overall supply. Active listings dipped to 23,422 in January and climbed to 29,735 by September, which is 27.0% more. Because the supply rises through the year, a seller who lists in the spring meets faster buyers but also a growing field of competitors.
For the owner of an older townhome, the sensible reading is that there is no month in which the market is easy. The spring is better than the winter by three weeks, and the supply by autumn is at its highest. A seller who can list in April and has priced to the neighbors' comparable sales gives the house the best odds the calendar offers.
What is the labor market doing month by month?
The smoothed unemployment rate for the area was 3.3% in August 2025 and 3.4% in September. It rose to 3.5% by November and stayed there through March 2026, then eased to 3.4% in April and May, 3.3% in June and 3.2% in July and August. The whole range is only 0.3 points.
A range this narrow means that jobs are not the variable that is making the market slow. Households are working, and the buyers who exist can qualify. What they are doing is shopping, with an inventory 89.5% larger than three years ago and a mortgage market that makes monthly payments the binding limit. The slower market is a consequence of choice and affordability, not of lost income.
For a seller, the point is that demand is not missing. A well-priced home in this part of Alpharetta meets steady employment, a pool of renters who can become buyers, and a large supply of alternatives. The result is a market that rewards accurate pricing and punishes optimistic pricing.
What does a sale cost in carrying expense?
Take a hypothetical townhome with a monthly cost of $3,200 covering mortgage, property tax, insurance and homeowners association dues. At the metro median of 60 days on market, an owner pays about $6,400 for the listing period. At the spring median of 49 days the figure is about $5,200, and at the January median of 71 days it is about $7,500. These are the author's round numbers and should be replaced with the owner's actual costs.
To these add the days between accepting an offer and closing, and any time spent preparing the home. The point is not the exact amount but the proportion. A single price cut of 3% on a $415,000 home is $12,450, about twice the carrying cost of the median listing period. In a market where 36.0% of listings cut their price, an owner should treat the price as the main cost and the calendar as the secondary one.
A townhome with an HOA is exposed in another way. Dues continue until closing, and a special assessment announced during a listing can change a buyer's math. Owners of older complexes can check the association's reserve study and recent minutes before listing, since a buyer's agent will.
What should an owner check before putting an older townhome on the market?
The Census table shows that 3,456 of the 9,131 units in this part of Alpharetta (37.8%) were built in the 1980s and 1990s. Townhomes of that age share a set of items that buyers and their inspectors look at first: roofs and siding at the end of their service life, original water heaters and HVAC units, and an association that may be nearing a major capital project. None of these shows up in a statistic, but each shows up in an offer.
The first check is the association. A buyer will ask for the budget, the reserve study, the minutes of the last year and any pending assessment. A seller who has read them first will not be surprised by the questions. The second check is the exterior, since the roof and siding are often the association's job and the unit owner's only influence is through the vote. The third is the interior systems that belong to the owner, such as the water heater and the air conditioning, which a buyer will treat as a negotiating item if they are close to the end of their life.
Last, the owner can price the work. If a replacement system costs less than the discount a buyer will ask for, it is cheaper to replace it. If it costs more, a credit at closing is a better route. The point of the exercise is not to renovate the unit to compete with new construction, which has 2,748 units in the area, but to remove the objections that cost more than they should.
Where does the break-even sit for a metro Atlanta seller?
A seller can set a floor before the first showing. Start with the metro median list price of $415,000. A 3% cut is $12,450 and a 5% cut is $20,750. Add the carrying cost of the listing period. At the hypothetical $3,200 per month used above, the 60-day median costs about $6,400, and a slow listing of 90 days costs about $9,600 (Realtor.com, list price, 2026; Realtor.com, price cuts, 2026).
On those assumptions a seller who cuts 3% and sells in 60 days gives up about $18,850 against the first asking price. One who cuts 5% and waits 90 days gives up about $30,350. In a market where 36.0% of listings cut their price and the median is 60 days, the first outcome is typical and the second is plausible. These sums are the reference for any private offer, which should be measured against the realistic listing outcome and not against the asking price on the day of listing.
The calculation changes with the home. A townhome with a high HOA payment loses more with each month of delay. A home that is cheaper per square foot than its neighbors gains less from an update. The seller can adjust each input, and the answer will move, but the method does not change. Readers comparing markets can also read the Marietta brief and the Greensboro brief.
What should the owner of an older townhome do with these numbers?
Three practical readings follow. First, price against nearby homes of similar age, not against the newest listings in the area, because buyers will treat them as different products. Second, expect the clock: the metro median is 60 days, and a seller whose home needs updating should plan for more than that. Third, count the cost of waiting, which is the carrying cost of the mortgage, taxes, insurance and the HOA dues common to townhomes, for each additional week.
None of this requires a view on where prices go next. The figures only say that the market is crowded, flat and slow, which rewards a seller who knows how long they can wait and what the home would sell for if they chose not to.
Methodology and limitations
Build-year, tenure and value data come from the American Community Survey 2020-2024 five-year file for the postal-code area that covers part of Alpharetta. These are estimates with sampling error, and the areas only approximate postal delivery areas.
Listing, price-cut, days-on-market and price-per-square-foot series come from Realtor.com for the Atlanta-Sandy Springs-Roswell metropolitan area, which is far larger than this area. They are asking prices on active listings, not sale prices. Unemployment is a metropolitan figure from the Bureau of Labor Statistics. No public series reports townhome-only data for one small area, so this report cannot say how townhomes fare against detached homes.
Conclusion
The evidence points to a crowded, flat market in which an older townhome in this part of Alpharetta is older than most homes nearby but not old in absolute terms. Inventory has nearly doubled in three years, prices per square foot have stayed in a narrow band, and more than a third of listings take a price cut.
A seller's real choices are about time and condition. The numbers cannot decide them, but they make the trade-offs measurable.
Before listing, an owner can do three things with this evidence. Write down the number of weeks they can carry the home. Pull the asking prices of the five most similar nearby homes, by age and size. And decide in advance the price at which they would rather sell privately and skip the listing period altogether. Each of these is a fact the owner controls, and none depends on a forecast.
Frequently Asked Questions
Is a townhome built in 1990 old in Alpharetta?
Relative to this area it is older than roughly two thirds of homes; by national standards it is middle-aged. Only 13.3% of homes in the area predate 1980.
Why is the area estimate so much higher than the metro list price?
The first is a median owner estimate for this part of Alpharetta. The second is a median asking price across all of metro Atlanta, a much larger and cheaper area.
Do these figures cover townhomes only?
No. The Census and Realtor.com series used here include all housing types, and the report says so rather than guessing at townhome results.
How current are the numbers?
Listing series run through September 2026, unemployment through August 2026, and the Census estimates cover 2020-2024.
Compare your options before committing. Request a written private offer for your property, with no obligation, then weigh it against your listing plan.
Sources
- U.S. Census Bureau, 2026. American Community Survey 2020-2024 five-year estimates, the Alpharetta area (via Census Reporter). https://censusreporter.org/profiles/86000US30009-30009/.
- Realtor.com, 2026. Housing Inventory: Active Listing Count in Atlanta-Sandy Springs-Roswell, GA (CBSA). https://fred.stlouisfed.org/series/ACTLISCOU12060.
- Realtor.com, 2026. Housing Inventory: Median Listing Price in Atlanta-Sandy Springs-Roswell, GA (CBSA). https://fred.stlouisfed.org/series/MEDLISPRI12060.
- Realtor.com, 2026. Housing Inventory: Median Days on Market in Atlanta-Sandy Springs-Roswell, GA (CBSA). https://fred.stlouisfed.org/series/MEDDAYONMAR12060.
- Realtor.com, 2026. Housing Inventory: Median Listing Price per Square Feet in Atlanta-Sandy Springs-Roswell, GA (CBSA). https://fred.stlouisfed.org/series/MEDLISPRIPERSQUFEE12060.
- Realtor.com, 2026. Housing Inventory: New Listing Count in Atlanta-Sandy Springs-Roswell, GA (CBSA). https://fred.stlouisfed.org/series/NEWLISCOU12060.
- Realtor.com, 2026. Housing Inventory: Price Reduced Count in Atlanta-Sandy Springs-Roswell, GA (CBSA). https://fred.stlouisfed.org/series/PRIREDCOU12060.
- U.S. Bureau of Labor Statistics, 2026. Unemployment Rate in Atlanta-Sandy Springs-Roswell, GA (MSA). https://fred.stlouisfed.org/series/ATLA013UR.
Related research

Seller Guide · October 6, 2026
How to Prepare Point Pleasant Beach Rental Records Before Selling
Separate rental approval, income history and booked stays before comparing sale terms.

Seller Guide · October 6, 2026
How to Prepare Rumson Flood and Waterfront Records Before Selling
Separate flood disclosure, elevation, repairs and waterfront rights before comparing sale terms.

Seller Guide · October 6, 2026
How to Prepare Sarasota Condo Inspection and Reserve Records Before Selling
Separate building condition, reserve funding and resale documents before comparing sale terms.