Market Brief · by Aidan Sowa · October 5, 2026
Does a South Naples Home Take Longer to Sell When Most Neighbors Are Only Here for the Winter? Reading the Seasonal Homes, the Slower Sales and the Thin Rent Data
Reading the Seasonal Homes, the Slower Sales and the Thin Rent Data for South Naples, FL, with each source dated and its limits noted, for owners weighing a listing against a direct sale.
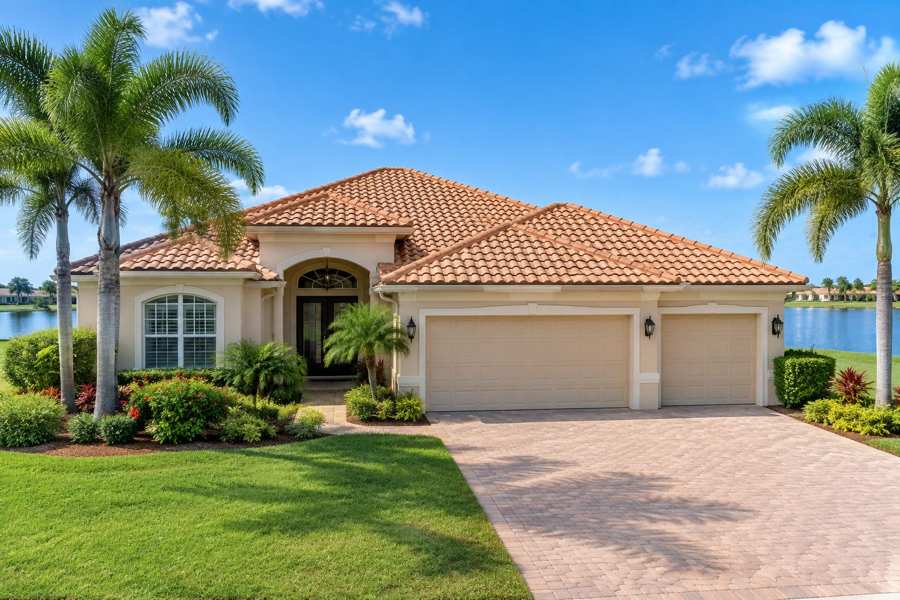
Does a South Naples home take longer to sell when most neighbors are only here for the winter? The Census count points that way. Of 17,484 housing units in the postal area that includes South Naples, 6,663, or 38.1%, were vacant on the survey date, and 5,730 of those, 32.8% of all units, were held for seasonal or occasional use. Only 10,821 homes were occupied year-round. A buyer who comes for the winter shops in a different season from a buyer who lives here, and that shapes how fast a house sells.
The market pages describe a slow, cool market. Realtor.com's key indicators as of September 2026 show 755 active listings, a median of 100 days on the market, a median listing price of $629,476 and homes selling 5.31% below asking. Redfin's page for the same area stops at March 2026, six months old, with a median sale price of $619,000 and 86 days on the market. Zillow's page for the city of Naples, updated on August 31, 2026, shows an average home value of $544,120, down 2.4%.
Maison Off-Market speaks only to sellers, and this brief is for an owner in South Naples. It uses the name from the sheet without the named community in it, and the figures describe a postal area. Every figure is dated and linked, every ratio is computed here from the published figures, and where a source looks implausible the brief says so and leaves it out. Nothing in it says that a private sale always beats a public listing.
Key Findings
- Redfin's page for the postal area gave monthly figures for March 2026, six months before this brief: a median sale price of $619,000, down 0.96% from a year before, $303 per square foot, down 7.6%, 224 homes sold against 169, up 32.5%, and 86 days on the market against 78. Its sale-to-list ratio was 95.2%, up 0.3 points, and 3.6% of homes sold above list (Redfin, South Naples postal area housing market).
- Realtor.com's page, with key indicators as of September 2026, shows a median listing price of $629,476, down 0.08% in a month and 3.23% in a year, a median sold price of $562,500, down 11.42% in a month and 13.46% in a year, $323 per square foot, 755 active listings, down 4.54% in a month and 13.16% in a year, and a median of 100 days, up 8% in a month and down 4.85% in a year (Realtor.com, South Naples postal area housing market).
- Zillow's page for the city of Naples shows an average home value of $544,120, down 2.4% over the past year, with homes going to pending in around 87 days, updated on August 31, 2026 (Zillow, Naples home values). No Zillow page for this postal area could be verified, so the city figure is used and labeled as a city figure.
- In the Census postal area, 17,484 housing units were counted, 10,821 occupied, 9,169 by owners and 1,652 by renters. The median build year is 2006, the median owner value is $538,000, plus or minus $48,599, and the median household income is $89,334, plus or minus $15,240. Mobile homes are 2,907 of the units, 16.6%.
- Taken together the pages show falling asking prices, falling sold prices and a long wait, in a place where a third of the homes are held for part of the year. An owner who lists should plan for three months or more and for an offer below asking, and an owner who sells privately to a buyer who closes on a chosen date does not have to plan for either.
Which South Naples price figure should an owner trust?
The two most recent sources point to a market a little above $560,000 and a little below $630,000, depending on whether sold or asking prices are used. Realtor.com's sold median of $562,500 is down 13.46% in a year, which implies about $649,988 a year earlier, and down 11.42% in a month, which implies about $635,019 the month before. A fall of eleven percent in a single month is large enough that it may reflect the mix of homes that closed and not a change in value.
The asking median is steadier. Realtor.com's $629,476 is down 0.08% in a month and down 3.23% in a year, which implies about $650,487 a year earlier. It is 11.9% above the sold median, computed here, which is the gap between what sellers ask and what buyers pay. Homes sold 5.31% below the asking price on average, and Redfin's older page shows a ratio of 95.2%, so the discount looks consistent across the two sources.
Redfin's March figure of $619,000, down 0.96%, implies about $625,000 a year before that. It is 10.0% above Realtor.com's September sold median, but it is six months older and measures a different period, so it is not evidence that prices fell by that amount. Redfin's price per square foot of $303, down 7.6%, implies about $328 a year earlier, and Realtor.com's listing figure of $323, down 2.92%, implies about $333. Both say that prices per foot are softer than a year ago.
The Zillow city value of $544,120, down 2.4%, implies about $557,500 a year earlier. It covers the city and not this postal area, and it is 3.3% below the Realtor.com sold median. The Census median owner value of $538,000, plus or minus $48,599, is an average over five years of owners' own estimates, and it is 6.0 times the median household income of $89,334, plus or minus $15,240. All of these figures are within about 17.0% of one another, which is a narrower spread than in many places in this series.
The best guide is closed sales of homes like the owner's, in the same part of the postal area, in the last few months. A median across single-family homes, condominiums, villas and mobile homes mixes too many kinds of home. An owner who has a short list of comparable sales can read the pages as background and price from the sales.
A seasonal calendar also affects which figure is current. A median of homes sold in the winter reflects buyers who came in person and often paid more for a view or a location. A median for the summer reflects buyers who are fewer and more price-conscious. The pages do not split their figures by season, so an owner comparing a March figure to a September one is comparing two parts of the cycle as well as two dates, an inference about how the market works here.
| Source | Figure | What it measures |
|---|---|---|
| Census Reporter | $538,000 | Median owner value, postal area |
| Zillow | $544,120, down 2.4% | Home value index, city of Naples, August 31, 2026 |
| Realtor.com | $562,500, down 13.46% | Median sold price, postal area, September 2026 |
| Redfin | $619,000, down 0.96% | Median sale price, March 2026, six months old |
| Realtor.com | $629,476, down 3.23% | Median listing price, September 2026 |
Sources as cited. Ratios and year-earlier values in this section are computed from the published figures and percentages.
How much is for sale in South Naples, and why are sales so slow?
Supply is shrinking but is still large. Realtor.com shows 755 active listings, down 4.54% in a month, which implies about 791 the month before, and down 13.16% in a year, which implies about 869 a year earlier. For a postal area with 10,821 occupied homes, 755 listings is 7.0% of the occupied count, computed here, a number that would be high in most places and says that many second homes and investment homes are on the market.
Sales are slow. Realtor.com shows a median of 100 days, up 8% in a month, which implies about 93 days the month before, and down 4.85% in a year, which implies about 105 days a year earlier. Redfin's March figure of 86 days against 78 is 8 days more. Redfin calls the area not very competitive, with a score of 17 out of 100, and says multiple offers are rare, that the average home sells about 5% below list and goes pending in around 94 days.
Redfin's page also says that hot homes can sell for about 2% below list and go pending in around 36 days, and that 3.6% of homes sold above list, up 0.6 points. So even the fast homes sell at a small discount, and only a sliver sell over asking. A seller who prices at asking and expects an offer near it is working from a market that has not existed here for some time, and the pages show the room buyers take.
Redfin counted 224 homes sold in March against 169 a year earlier, up 32.5%, which fits the winter season, when buyers are in town, and the page covers a month when many are. That strong month is also a reminder that a postal area with many seasonal owners has a calendar. Sales cluster when the owners are here, which is an inference about the setting, and a listing that comes on in the summer meets fewer of them.
Rentals show the strain. Realtor.com shows 271 rental properties, down 1.43% in a month and down 12.93% in a year, which implies about 311 a year earlier. The page's median rent of $6,500 is up 29.35% in a year, which is not plausible for a postal area with a Census median rent of $2,089, and it likely reflects a small number of high-priced seasonal rentals. It is not used. The page's list of neighborhoods names communities and was also not used.
Carrying costs make the wait harder. A home that sits for three months or more has taxes, insurance, utilities, lawn and pool care, and in many places association dues, and an empty house in a humid climate needs regular checks for mold, leaks and storm damage. For a seller who lives elsewhere, those costs run while the house is unseen. That is a reason some owners favor a quick private sale, even at a price a little below what a long listing might bring.
Sources as cited. Year-earlier values and differences are computed from the published percentages.
Who owns a home in South Naples, and are many of them here all year?
Most occupied homes are owned. Of 10,821 occupied homes, 9,169 are owner-occupied, 84.7%, and 1,652 are rented, 15.3%. Of the 6,663 vacant homes, 347 are for rent, 191 are for sale only, 60 are sold but not occupied, 5,730 are held for seasonal or occasional use and 335 are vacant for other reasons. Seasonal homes are 32.8% of all units and 86.0% of the vacant ones.
Owners are recent arrivals. Of 9,169 owner households, 338 moved in during 2023 or later, 3.7%, 2,024 between 2020 and 2022, 22.1%, 5,038 between 2010 and 2019, 54.9%, 1,453 between 2000 and 2009, 15.8%, 124 in the 1990s, 1.4%, and 192 before 1990, 2.1%. Those who arrived since 2010 began are 80.7%. The area is new, and so are most of its owners, which means few have a long tenure to fall back on.
Owners are older and many are retired. Of 23,559 people counted, 2,475 are under 18, 10.5%, 1,119 are 18 to 24, 4.7%, 1,396 are 25 to 34, 5.9%, 1,418 are 35 to 44, 6.0%, 5,485 are 45 to 64, 23.3%, and 11,666 are 65 or older, 49.5%. The margin on the total is plus or minus 1,616. An owner of that age may be weighing a move closer to family or into care, an inference from the age mix.
Many owners have no loan. Of 9,169 owners, 4,130 have a mortgage, 45.0%, and 5,039 do not, 55.0%. Among owners with a mortgage, 1,835 of 4,130 spent 30% or more of income on housing, 44.4%, and 1,239 spent half or more, 30.0%. Among owners without a mortgage and a computed figure, 711 of 4,914 spent 30% or more, 14.5%, and 344 spent half or more, 7.0%. Of 1,652 renters, 1,562 with a computed figure, 1,052 spent 30% or more, 67.3%, and 550 spent half or more, 35.2%.
Income is reported for households that live here, and seasonal owners are not counted in the occupied homes. That means the median household income of $89,334 describes the full-time residents and says little about the buyer who owns a second home. The survey does not capture that buyer, and the price a home brings depends on the part-time owners as much as the local ones, an inference worth keeping in mind when reading any median.
Estates and inheritances are another source of sales in a community of older owners. A family that inherits a home in Florida while living in another state often wants a clean sale without repeated trips for showings and repairs, and the timing is set by the estate and not by the market. That is an inference from the age mix and the share of seasonal homes, not a figure from any source, but it describes a kind of seller who may value a private buyer.
Source: U.S. Census Bureau, American Community Survey 2020-2024 five-year estimates, tables B01001, B25003, B25004, B25038, B25070 and B25091, via Census Reporter. Shares are computed here.
What kinds of homes stand in South Naples, and how old are they?
The stock is varied. Of 17,484 units, 7,198 are detached, 41.2%, 1,768 are attached, 10.1%, 302 are in two-unit buildings, 1,117 in buildings of three or four, 1,275 in five to nine, 1,433 in ten to nineteen, 690 in twenty to forty-nine and 712 in fifty or more. Another 2,907, 16.6%, are mobile homes, and 82 are boats or recreational vehicles. A single median covers houses, villas, condominiums and mobile homes.
The stock is young. Of 17,484 units, 57, or 0.3%, were built in the 1950s, 395, or 2.3%, in the 1960s, 888, or 5.1%, in the 1970s, 1,332, or 7.6%, in the 1980s, 2,314, or 13.2%, in the 1990s, 6,051, or 34.6%, in the 2000s, 4,648, or 26.6%, in the 2010s and 1,799, or 10.3%, in 2020 or later. None were built before 1950. The median build year is 2006, and only 7.7% were built before 1980.
The 2000s produced the largest share, 34.6%, and those homes are now about twenty years old. In Florida that is the age at which tile roofs need underlayment work, air conditioning systems have been replaced once or are due, and impact windows and screen enclosures need attention. Insurance matters as well: a buyer will ask what the roof's age does to the cost of cover, which an owner should find out before listing, since the answer can move an offer.
Bedrooms are mostly three. Of 9,169 owner households, 48 live in a home with no bedroom, 361 in a one-bedroom, 3,094 in a two-bedroom, 4,620 in a three-bedroom, 964 in a four-bedroom and 82 in one with five or more. Three-bedroom homes are 50.4% of owner homes and two-bedroom homes 33.7%. Few homes are large, which suggests that most of the stock is aimed at couples and retirees, an inference.
Water and storms are part of every sale in this part of Florida. A buyer will look at the flood zone, past claims, the elevation of the house and the condition of the roof and shutters. A seller who has the documents ready, including permits for any work, a recent roof or wind-mitigation report and records of repairs, can answer quickly, and a private buyer who accepts the home as it stands avoids the delay of repair negotiations. Readers comparing markets can also read the Edgewater brief and the Palma Ceia brief.
Source: U.S. Census Bureau, American Community Survey 2020-2024 five-year estimates, tables B25024, B25034 and B25042, via Census Reporter. Shares are computed here.
What should a South Naples owner ask before choosing a listing or a private sale?
Five questions are worth asking. Is my price based on closed sales of homes like mine in the last few months, and not on a median across all home types? Can I carry the home, with taxes, insurance and any association dues, for three months or more? What will a buyer's inspector and insurer say about the roof? What do the fees cost? And what date do I need to close?
Fees are simple arithmetic, and no rate is assumed here. Each 1% of a $450,000 sale is $4,500, of a $725,000 sale is $7,250 and of a $1,200,000 sale is $12,000. Three percent is $13,500, $21,750 and $36,000, and five percent is $22,500, $36,250 and $60,000. On the Realtor.com sold median of $562,500, 1% is $5,625, 3% is $16,875 and 5% is $28,125. On the Redfin median of $619,000, 1% is $6,190, 3% is $18,570 and 5% is $30,950.
A private sale has no showings and no neighbors talking about it, which is the first benefit. The second benefit is a closing date that fits the seller, which helps a household that needs time to find a new home or that spends part of the year elsewhere. The third and fourth are no commission costs and no closing costs, and the fifth is no inspection repairs.
In a market with a long wait and prices below asking, an owner is right to compare a listing with a private offer. The comparison includes the months on market, the discount a buyer will take, the carrying cost of a home that waits, the cost of repairs and the owner's date. Only the owner can supply the numbers for taxes, insurance, dues and plans.
Maison Off-Market buys luxury homes and estates directly from their owners and speaks only to sellers. It does not say that a private sale always beats a public listing. If you would like a private, no-obligation offer for a home in South Naples, call 401-219-4207 or use the contact form on this site.
Sources as cited. Fee illustrations are arithmetic only and assume no commission rate.
Methodology and limitations
Each page's date, title and place were read before use. The Redfin page shows monthly figures for March 2026, six months old, and is used as a dated benchmark. The Realtor.com page carries key indicators as of September 2026 with changes over a month and over a year; its median rent, up 29.35% in a year, is implausible beside the Census rent and was not used, and its neighborhood table, which names communities, was not used. The Zillow page covers the city of Naples, was updated on August 31, 2026, and no page for the postal area could be verified. Only established data publishers and the Census are cited. Percent changes were taken as published, year-earlier values were computed by dividing by one plus or minus the change, and every ratio and sum was computed in code. Census Reporter figures are five-year averages and carry margins of error; the median owner value is plus or minus $48,599.
Conclusion
The record for South Naples, as far as the pages allow, is a postal area of young homes, a third of them held for part of the year, with prices of about $560,000 to $630,000 depending on the measure, a wait of three months or more, discounts of about five percent and listings that have fallen by about an eighth in a year. The useful number for an owner is a closed sale of a similar home in the last few months, and a private buyer can price the home as it stands and close on the owner's schedule.
Frequently Asked Questions
What is the median home price in South Naples?
Realtor.com showed a median sold price of $562,500 and a median listing price of $629,476 for September 2026, for the postal area. Redfin showed $619,000 for March 2026, an older figure. Zillow showed $544,120 for the city of Naples in August 2026, and the Census median owner value is $538,000.
How long do South Naples homes take to sell?
Realtor.com showed a median of 100 days for September 2026 and Redfin showed 86 days for March 2026.
How many South Naples homes are seasonal?
The Census counts 5,730 of 17,484 housing units in the postal area, 32.8%, as held for seasonal or occasional use.
How many South Naples homes are owner-occupied?
The Census counts 9,169 of 10,821 occupied homes in the postal area, 84.7%, as owner-occupied.
Can I sell my South Naples home privately?
Yes. Maison Off-Market buys luxury homes and estates directly from their owners with no showings, flexible closing dates, no commission costs, no closing costs and no inspections or repairs. Call 401-219-4207 or use the contact form.
Compare your options before committing. Request a written private offer for your property, with no obligation, then weigh it against your listing plan.
Sources
- Realtor.com, postal area housing market, 2026. 34114 Housing Market Data. https://www.realtor.com/local/market/florida/zipcode-34114.
- Redfin, postal area housing market, 2026. 34114 Housing Market Trends. https://www.redfin.com/zipcode/34114/housing-market.
- Zillow, Naples home values, 2026. Naples, FL Housing Market. https://www.zillow.com/home-values/19533/naples-fl/.
Related research

Seller Guide · October 6, 2026
How to Prepare Point Pleasant Beach Rental Records Before Selling
Separate rental approval, income history and booked stays before comparing sale terms.

Seller Guide · October 6, 2026
How to Prepare Rumson Flood and Waterfront Records Before Selling
Separate flood disclosure, elevation, repairs and waterfront rights before comparing sale terms.

Seller Guide · October 6, 2026
How to Prepare Sarasota Condo Inspection and Reserve Records Before Selling
Separate building condition, reserve funding and resale documents before comparing sale terms.