Market Brief · by Aidan Sowa · October 5, 2026
Why Is the Realtor.com Median Listing in the Cactus Corridor So Far Above Closed Sales? Reading a Small May Sample and a Median Sold Price
Reading a Small May Sample and a Median Sold Price for Cactus Corridor, AZ, with each source dated and its limits noted, for owners weighing a listing against a direct sale.
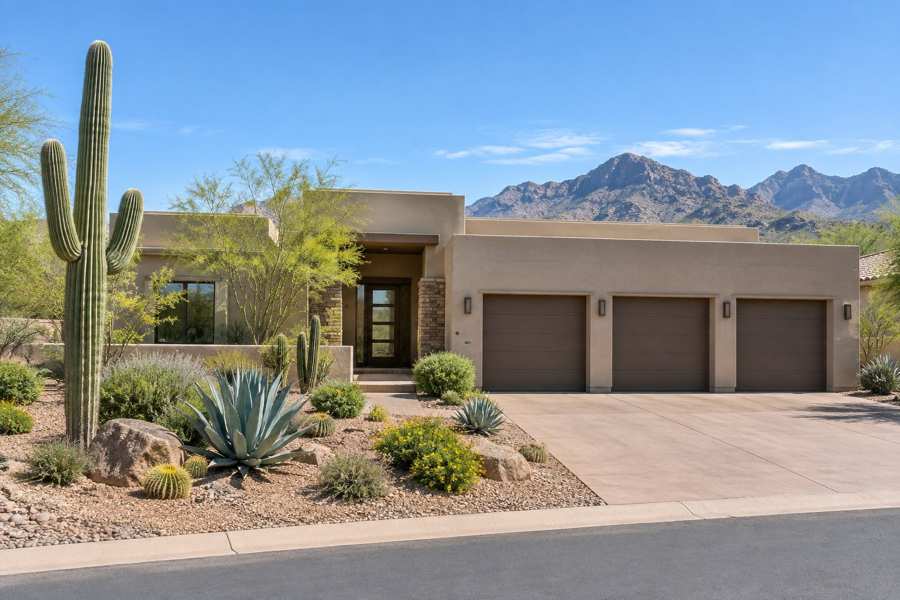
Why is the Realtor.com median listing in the Cactus Corridor $3,895,000 when closed sales across the corridor's two postal areas have a median of $570,000? The first figure comes from a neighborhood page with key indicators as of May 2026, based on 24 homes for sale. The second comes from a Scottsdale brokerage's count of 129 closings in the first half of 2026. The gap is a factor of nearly seven, and both numbers are from real data. They describe different groups of homes.
The Realtor.com page also shows a median sold price of $2,195,000, down 13.5% on the year, and a median of 58 days on market. The brokerage reports 41 days. The same brokerage reported averages of about $1.04 million and $1.57 million for the two postal areas in December. A seller who asks what the Cactus Corridor is worth can be given any answer from about $515,000 to more than $3.8 million, depending on which page is open and which homes it counts.
This brief sets the sources side by side, shows where they conflict, adds Census facts about the postal area and a Scottsdale citywide report, and explains plainly what a private sale changes and what it does not. It does not estimate what any particular house is worth, and it does not treat a median on 24 homes as a price.
Key Findings
- Realtor.com reported, with key indicators as of May 2026, a median listing price of $3,895,000 for the Cactus Corridor (up 6.73% on the year and 14.59% on three years), a median sold price of $2,195,000 (down 13.50% and up 41.61%) and $812 per square foot (up 16.17% and 41.96%) (Realtor.com, Cactus Corridor housing market).
- The same page reported 24 homes for sale (up 8.70%), a median of 58 days on market (down 6.45%), 6 rental properties and a sale-to-list ratio of 97%, with homes selling an average of 3.22% below asking, and called it a seller's market.
- A Scottsdale brokerage's mid-year report counted 129 closed homes in the two postal areas from January to June 2026, totaling $132,023,540, with a median sold price of $570,000, a median of 41 days on market and 98.1% of list price. A year earlier it counted 118 closings at a median of $590,000 and 46 days (Donaldson, Cactus Corridor mid-year report).
- The same brokerage's December 2025 snapshot gave an average sold price of $1,573,979 in one postal area and $1,037,665 in the other, with 94.3% and 93.8% of original list price, 65.9 and 70.4 days, and 3.92 and 3.28 months of supply (Donaldson, December 2025 update).
- The Scottsdale REALTORS report for August 2026 gave a citywide median sold price of $882,500, a median of 70 days, 4.02 months of inventory and a sold-to-list ratio of 96.3% (Scottsdale REALTORS, August 2026 market report).
- In the Phoenix area, median days on market was 60 in May 2026 and 62 in September, and new listings fell from 8,670 in March to 5,854 in July (Realtor.com, days on market; Realtor.com, new listings).
How can the median listing be $1,700,000 above the median sale?
The difference is $3,895,000 less $2,195,000, which is $1,700,000. The sold median is 56.4% of the listing median. Both medians come from the same page and the same month, and neither is a discount or a premium on any house. Working back from the stated changes, the listing median was about $3.65 million a year ago and the sold median about $2.54 million, so the gap was about $1.1 million then and has widened.
The listing median is taken from 24 homes, and 24 homes in a place where a house can list for several million dollars means that one or two very large estates move the number. The sold median is taken from whatever closed in the period, which the page does not say, and a few sales can move it as well. The price per square foot says something about the type of home: $812 a foot on a $3,895,000 listing implies about 4,800 square feet, a median divided by a median and only a rough guide. That is a house much larger than the typical home in the surrounding postal areas, whose median owner-estimated value is $698,200, and it is the likely cause of the gap. That is this brief's inference.
The page says the market is a seller's market and also says homes sold an average of 3.22% below asking. Both can be true if a few buyers are chasing the best homes and the rest are negotiating. A sale-to-list ratio of 97% is a modest discount. On a $2,195,000 sale it is about $71,000, and on a $570,000 sale about $18,000, so the ratio says little about the dollars that an owner should plan for.
For an owner, the useful reading is that the page describes the top tier of the corridor, not its middle. An owner who looks at $3,895,000 and expects it will probably be disappointed. An owner who looks at $570,000 and a larger house on a bigger lot may leave money. The price of any one house depends on its size, lot, view and condition, and the nearest ten sales will say more than any median.
| Source and period | Measure | Value |
|---|---|---|
| Realtor.com, May | Median listing price | $3,895,000 (up 6.73%) |
| Realtor.com, May | Median sold price | $2,195,000 (down 13.50%) |
| Realtor.com, May | Homes for sale | 24 (up 8.70%) |
| Brokerage, January to June | Median sold price | $570,000 (129 closings) |
| Brokerage, January to June | Days on market | 41 (46 a year earlier) |
| Brokerage, December 2025 | Average sold price | $1,573,979 and $1,037,665 |
| Scottsdale REALTORS, August | Median sold price, citywide | $882,500 |
Source: Realtor.com, a Scottsdale brokerage and Scottsdale REALTORS as cited. The $1,700,000, the 56.4%, the implied earlier medians of about $3.65 million and $2.54 million, the gap of about $1.1 million, the size of about 4,800 square feet and the dollar amounts at 3.22% are this brief's arithmetic from stated figures. The reading of the mix of homes is this brief's inference. Commercial content; not independently verified.
Which homes does the Realtor.com page actually count?
The neighborhood table lists 14 named subdivisions and a large parent row. Central Scottsdale appears with 492 homes for sale, a median listing price of $1,192,500, $447 a square foot and a median of 58 days. The rows for the Cactus Corridor's own neighborhoods are much smaller: Mary Katherine Estates, Powderhorn Ranch and Valley Ranchos have 2 homes each, and Cactus Villas, McDowell Ranchos, Preston Hills, Scottsdale Foothills and Tierra de los Arcos have 1 each. Six more named rows have none. The named rows add up to 11 of the 24 homes.
That leaves 13 homes that the table does not place. The page does not say where they are. Its Central Scottsdale days on market of 58 match the Cactus Corridor figure of 58 exactly, which suggests that the neighborhood figure may be taken from the larger area, though the page does not say so. This brief treats that as a possibility and not a finding.
The page's date matters too. Its indicators are as of May 2026 and its charts run through April, so they are months older than the brokerage reports from July and the Scottsdale report for August. The Realtor.com Phoenix area series shows that median days on market was 60 in May and rose to 67 in July and August, and that new listings fell from 8,670 in March to 7,444 in May and 5,854 in July. A page from May cannot describe a September market.
Of the 24 homes, 11 sit in eight named subdivisions, fewer than two homes each on average. A seller in one of those subdivisions is selling into a market of one or two comparable homes at a time. In such a place the median is nearly useless, and what counts is the last few closed sales on the same street or in the same development, with their lot sizes and dates.
Source: Realtor.com and the Federal Reserve Bank of St. Louis as cited. The sums of 11 and 13, the count of 14 rows and the percentage changes are this brief's arithmetic. The suggestion that the days figure comes from the larger area is this brief's hypothesis and is not confirmed. Commercial content; not independently verified.
What do 129 closings and a median of $570,000 say?
The brokerage's mid-year report is about closed sales in two postal areas for the six months from January 1 to June 30, 2026. It counts 129 closings and $132,023,540 in volume, which is an average of about $1,023,000, or 1.8 times the $570,000 median. A gap of that size means a tail of expensive homes lifts the average, and it is the same pattern the Realtor.com page shows at its own, higher scale.
Compared with the first half of 2025, the brokerage reports closings up 9.3% from 118, volume up 9.7% from $120,301,667, the median sold price down 3.4% from $590,000 and days on market down from 46 to 41. It says the lower median reflects the mix of sales, with more homes closing between $500,000 and $700,000, and not softer values. That is the brokerage's reading of its own data and is not checked here. It is plausible, since volume rose while the median fell.
The two postal areas differ. The report says 38 homes closed in one at a median of $677,000, in 46 days, at $377 a square foot and 97.67% of list. In the other, 91 homes closed at a median of $515,000, in 38 days, at $366 a foot and 98.24%. The brokerage's headline for the pair is that they are two different markets, one with the higher price and the slower pace.
The brokerage's numbers and the other sources do not line up neatly. Resideline counted 371 closings in six months in the second postal area, 4.1 times the brokerage's 91, and a median of $737,000 against $515,000. The brokerage does not say how it defines the Cactus Corridor and may be counting a subset of each postal area. This brief cannot say. For an owner, the point is to ask what each number counts, because 'Cactus Corridor' has no official boundary.
Source: a Scottsdale brokerage and Resideline as cited. The average of about $1,023,000, the 1.8 times and the 4.1 times are this brief's arithmetic. The brokerage's explanation of the lower median is its own commentary. The possibility of a subset is this brief's hypothesis. Commercial content; not independently verified.
Does the December snapshot agree with the mid-year report?
Not in any simple way. The brokerage's snapshot for December 2025 reported 140 active listings in one postal area, with an average list price of $1,948,765 and an average sold price of $1,573,979, and 187 in the other, with an average list price of $1,336,464 and an average sold price of $1,037,665. Its sale-to-original-list ratios were 94.3% and 93.8%, and its months of supply 3.92 and 3.28.
Seven months later the same brokerage reported that active inventory 'currently sits at 36 homes across both zip codes.' The first count adds to 327 and the second is 36, which is a factor of 9. The Realtor.com Airpark page shows 193 homes for sale in one of the postal areas and 128 in the other, or 321 together, in September. This brief cannot say why the mid-year count is so low. The brokerage may have switched from all listings to a narrower group, and its note about leanness may refer to that group.
The prices also differ in kind. A December average of $1,037,665 against a mid-year median of $515,000 is a gap of 2.0 times in the same postal area, and averages and medians are different measures. The December ratios of 94.3% and 93.8% are measured against the original list price, which counts price cuts. The mid-year figure of 98.1% is described only as a share of list price, and the report does not say which price it uses, so the two should not be set against each other.
For an owner the lesson is not to compare numbers from different reports. A ratio against the original price, an average price, a median price and a count of active homes all come from different definitions. The trend within one report is more reliable than any comparison between two.
Source: a Scottsdale brokerage and Realtor.com as cited. The sums of 327 and 321, the factor of 9 and the 2.0 times are this brief's arithmetic. The explanations of the changes are this brief's hypotheses. Commercial content; not independently verified.
How does the corridor compare with Scottsdale and the Census?
Scottsdale REALTORS reported a citywide median sold price of $882,500 for August 2026, up 3.68% on the month, with 419 homes sold, 2,185 active listings, a median list price of active homes of $899,900, a sold-to-list ratio of 96.3%, 70 days and 4.02 months of inventory. The Realtor.com median listing of $3,895,000 for the corridor is 4.3 times the citywide active median, and its sold median of $2,195,000 is 2.5 times the citywide sold median. The brokerage's $570,000 is 35.4% below the city figure. The corridor is therefore either far above or well below Scottsdale as a whole, depending on the source.
The Census profile for one of the two postal areas helps explain the lower figures (Census Reporter, postal area profile). Its median home value is $698,200, which is 58% above the Phoenix area's $440,900. Its median household income is $97,177, 10% above the area's $88,301, and its per capita income is $71,468, 1.6 times the $45,239 for the area. The mean travel time to work is 19.5 minutes against 26.4. Foreign-born residents are 12.4%, veterans 5%, and 97.7% of adults have finished high school.
The median value of $698,200 is far closer to the brokerage's $570,000 and Resideline's $737,000 than to the $2,195,000 on the Realtor.com page. The survey covers all owner-occupied homes in the postal area and not only those for sale, and the people in them estimate the values themselves, so it describes the typical home. The corridor's multimillion-dollar estates are a small part of it. That is this brief's reading.
The housing is young. The median year built is 1993, 8,763 of the 21,048 units were built in the 1990s and 5,627 in the 1980s, and only 9.8% were built before 1980. An owner of a home from that period has a house that is roughly 25 to 45 years old, old enough that kitchens, roofs and air-conditioning systems are likely to be due. That is a general point and not a finding about any house. Buyers in this price range often ask for the age of the major systems, and a seller who has the dates and receipts ready has an easier conversation. In a private sale those questions still come up, but they are asked once, in private, and not in front of a stream of visitors. Readers comparing markets can also read the Scottsdale Airpark brief and the Fountain Hills brief.
Source: Scottsdale REALTORS, the U.S. Census Bureau (American Community Survey 2020-2024, through Census Reporter), Realtor.com and Resideline as cited. The ratios, percentages and sums are this brief's arithmetic. The postal area is not the same as the corridor. Readings are this brief's inference.
What should an owner do with all of this, and what does a private sale change?
Three steps will help. First, ask for the ten closest closed sales by size, lot, age and street, with their dates, and set the medians aside. Second, ask what each source is counting: which postal area, which months and which types of home. Third, write down what a public sale would cost in fees, repairs and time. The fee arithmetic is simple. At $570,000, each 1% is $5,700, so 3% is $17,100 and 5% is $28,500. At $2,195,000, 1% is $21,950, 3% is $65,850 and 5% is $109,750. These show what each percentage point is worth and are not a prediction of what any seller would pay.
The dollars climb with the price, and so does the exposure. A house that lists for several million dollars is photographed, toured and discussed, and those who tour it include neighbors and curious people as well as buyers. A private sale with Maison Off-Market changes that. There are no showings and no neighbors talking about you selling. The closing date can be flexible, so there is time to find a new home. There are no commission costs, no closing costs, and no inspections or repairs.
Take the brokerage's own ratio as a worked example. A sale at 98.1% of list on a $570,000 house means about $10,830 below the asking price, a small sum against the 3% to 5% fee amounts above. A seller who prices correctly from the start loses little to negotiation, and a seller who overprices loses the early weeks, when interest is highest and a public listing is newest.
The brokerage's advice for sellers is that correctly priced homes are closing near asking and that overpricing and waiting does not pay, which agrees with the sale-to-list ratios of 97% to 98.1%. A private sale does not change what a house is worth. It changes how long the sale takes, who learns of it and what is left to negotiate. This brief does not claim that a private sale always yields more than a public one.
If you would like a private, no-obligation offer for a Cactus Corridor home, call 401-219-4207 or use the contact form on this site.
Source: Maison Off-Market and the sources above as cited. The fee figures are this brief's arithmetic and not claims about any sale.
Methodology and limitations
Prices, price per square foot, days on market, listing and rental counts, the sale-to-list ratio and the neighborhood tables come from a national listing site page with key indicators as of May 2026 and charts through April. Closed sales, volume, days on market and the sale-to-list ratio come from two reports by a Scottsdale brokerage dated July 29, 2026 and January 28, 2026, and the citywide figures come from the Scottsdale REALTORS report for August 2026. The sources cover different periods and sets of homes and are not independent.
Census figures come from the American Community Survey 2020-2024 five-year estimates for one postal area, through Census Reporter, with comparisons stated on that page. Regional series are Realtor.com data published by the Federal Reserve Bank of St. Louis for the Phoenix area, and the series name was checked on the series page. Percentages, gaps, ratios and fee amounts are this brief's own arithmetic and are labeled as such. Where a reading goes beyond what a page says, it is called an inference. Commercial pages are not independently verified.
Conclusion
The Cactus Corridor record shows a Realtor.com median listing of $3,895,000 and sold median of $2,195,000 on 24 homes, a brokerage median of $570,000 on 129 closings, days on market of 41 to 58 and a count of active homes that ranges from 36 to 321 depending on the page. It describes a place with no official boundary and several markets in it.
It does not fix a price for any one home. The choice between a public listing and a private sale comes down to whether an owner would rather meet showings, inspections and public attention, or sell quietly on a date that suits them. Maison Off-Market speaks only to sellers, and a conversation costs nothing.
Frequently Asked Questions
What is the median home price in the Cactus Corridor?
It depends on the source. Realtor.com reports a median sold price of $2,195,000 and a median listing price of $3,895,000 for May 2026. A Scottsdale brokerage reports a median sold price of $570,000 for 129 closings in the first half of 2026.
How long do Cactus Corridor homes take to sell?
Realtor.com reports a median of 58 days on market for May 2026. The brokerage reports 41 days for the first half of the year, against 46 a year earlier.
Do Cactus Corridor homes sell above asking?
Not on average in these sources. Realtor.com reports a sale-to-list ratio of 97% and homes selling 3.22% below asking. The brokerage reports 98.1% of list price.
Where is the Cactus Corridor?
It has no official boundary. The brokerage uses two postal areas, and Realtor.com shows a neighborhood page with named subdivisions and a larger parent area.
What is the difference between a private sale and a public listing?
A private sale with Maison Off-Market has no showings, a flexible closing date, no commission costs, no closing costs and no inspections or repairs. A public listing exposes the home to a wider group of buyers. This brief does not claim either always gets a higher price.
Compare your options before committing. Request a written private offer for your property, with no obligation, then weigh it against your listing plan.
Sources
- Realtor.com, 2026. Cactus Corridor in Scottsdale, AZ Housing and Rental Market. https://www.realtor.com/local/market/arizona/scottsdale/cactus-corridor.
- Donaldson, A., 2026. Cactus Corridor Mid-Year Market Report. https://ashleeandassociates.com/blog/cactus-corridor-real-estate-market-report/.
- Donaldson, A., 2026. Cactus Corridor Real Estate Market Update. https://ashleeandassociates.com/blog/cactus-corridor-scottsdale-market-85259-85260/.
- Scottsdale REALTORS, 2026. Scottsdale Residential Market Report, August 2026. https://www.scottsdalerealtors.org/wp-content/uploads/2026/09/Scottsdale_Residential_Market_Report_Aug-2026.pdf.
- Realtor.com, 2026. Housing Inventory: Median Days on Market in Phoenix-Mesa-Scottsdale, AZ (CBSA). https://fred.stlouisfed.org/series/MEDDAYONMAR38060.
- Realtor.com, 2026. Housing Inventory: New Listing Count in Phoenix-Mesa-Scottsdale, AZ (CBSA). https://fred.stlouisfed.org/series/NEWLISCOU38060.
- U.S. Census Bureau, 2026. American Community Survey 2020-2024 five-year estimates, the Cactus Corridor area (via Census Reporter). https://censusreporter.org/profiles/86000US85260-85260/.
Related research

Seller Guide · October 6, 2026
How to Prepare Point Pleasant Beach Rental Records Before Selling
Separate rental approval, income history and booked stays before comparing sale terms.

Seller Guide · October 6, 2026
How to Prepare Rumson Flood and Waterfront Records Before Selling
Separate flood disclosure, elevation, repairs and waterfront rights before comparing sale terms.

Seller Guide · October 6, 2026
How to Prepare Sarasota Condo Inspection and Reserve Records Before Selling
Separate building condition, reserve funding and resale documents before comparing sale terms.