Market Brief · by Aidan Sowa · October 5, 2026
Why Is the Milton Listing Median Far Above the Sold Median? Reading Several Medians and a Postal-Area Listing Count
Reading Several Medians and a Postal-Area Listing Count for Milton, GA, with each source dated and its limits noted, for owners weighing a listing against a direct sale.
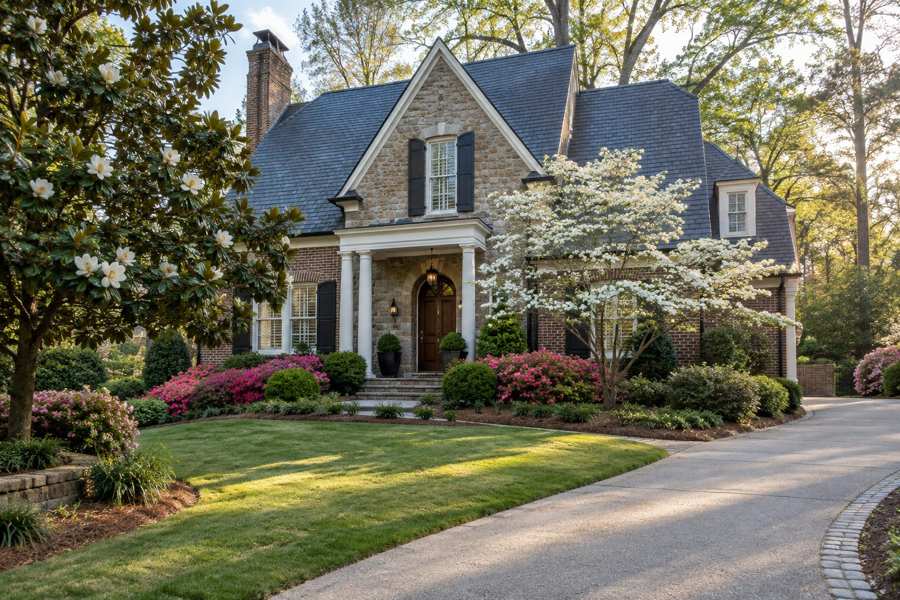
Why is the Milton listing median $1,750,000 when the sold median is $1,112,500? Realtor.com's September 2026 page for Milton, Georgia shows both figures, and the first is 1.6 times the second, a ratio this brief computes. Redfin's page shows a median sale price of $1,300,000 for the three months to August. A local brokerage page shows $940,000. The Realtor.com page for the postal area that includes Milton shows a listing median of $1,197,500 and a sold median of $965,000. A seller who wants a number has five of them, between $940,000 and $1,750,000.
The differences come from what each figure counts. An asking median is pulled up by a few very large listings, and Milton has some: the estate homes of The Manor Golf and Country Club show a median listing price of $2,422,500 on Realtor.com, while Avensong shows $449,500. A sold median is made of what closed, and in a month with few sales one or two closings move it. The Realtor.com page says its city sold median fell 18.35% from the month before.
Maison Off-Market buys luxury homes and estates directly from their owners and speaks only to sellers. We do not appraise homes, and nothing here is a valuation. This brief sets the published figures side by side, notes where pages are stale or conflict, adds a Census cut on the age of the homes and how long owners have stayed, and shows what a percentage of a price is worth in dollars. Every calculation is this brief's own arithmetic and every inference is labeled as one.
Key Findings
- Realtor.com showed for the city of Milton, as of September 2026, a median listing price of $1,750,000 (up 7.51% on the year), a median sold price of $1,112,500 (up 6.97% on the year and down 18.35% on the month), $313 per square foot, 295 active listings, 53 days on market, a sale-to-list ratio of 98% and a median rent of $2,043 (Realtor.com, Milton market data).
- Realtor.com showed for the postal area that includes Milton a median listing price of $1,197,500, a median sold price of $965,000 (up 9.04% on the year), $277 per square foot, 159 active listings and 53 days on market (Realtor.com, Milton postal area market data).
- Redfin showed a median sale price of $1.3 million for the three months to August 2026, up 8.0%, 44 days on market against 49 a year earlier, 3 offers on average, 182 homes sold in August against 165, a sale-to-list ratio of 96.9%, 13.6% of homes sold above list and 35.7% with price drops (Redfin, Milton housing market).
- A local brokerage page dated September 1, 2026 showed a median home price of $940,000, 192 active homes, 4.6 months of supply, 54 days on market and a list-to-sale ratio of 96.6%, and called the market balanced (Local brokerage blog, Milton housing market update). Zillow's page showed a typical value of $951,308 but was dated April 30, 2026 (Zillow, Milton home values).
- The Census describes a postal area of 68,707 people where 84.3% of homes were built since 1990, the median year built is 2002, 74.1% of occupied homes are owner-occupied and 50.0% of owners moved in in the 2010s.
Is Milton a buyer's market, a seller's market or a balanced one?
Realtor.com calls Milton balanced. Its September page says that homes sold for 2.09% below the asking price on average, a sale-to-list ratio of 98%, and that the Hotness Index shows a warm market in which homes sell in a median of 53 days. The postal area page uses the same words and the same 98%. The brokerage's September 1 page also calls the market balanced and bases the label on 4.6 months of supply.
Redfin's August data describe a market that is less hot than the label suggests. It calls the market somewhat competitive, with 3 offers on average, but its sale-to-list ratio is 96.9%, down 0.15 points on the year, and only 13.6% of homes sold above list, down 1.6 points. At the same time 35.7% had price drops, up 0.6 points. So there were 2.6 homes with price cuts for every home that sold above list, a ratio this brief computes. The 1.1-point gap between Redfin's 96.9% and Realtor.com's 98% shows that the two pages measure sale-to-list differently or in different months.
The brokerage's page has internal contradictions. Its header gives a year-over-year gain of 3.0% for the median price of $940,000, and a later paragraph says the gain is 3.2%. A table gives 4.6 months of supply and the text says 4.4 months. A paragraph says the median is $945,000 today. The page's address ends in july-2026 while its heading says September 2026. These do not change the picture, and they show how loosely the figures are checked.
The inference from the pages together is that Milton is a market with plenty of choice and moderate negotiation, where prices have risen by 7% to 8% over the year on two pages and 3.0% on a third. Redfin's sold median rose 8.0% and Realtor.com's rose 6.97%, so the three agree on the sign and roughly on the size.
| Measure | Value | One-year change | Month-on-month change |
|---|---|---|---|
| Median listing price | $1,750,000 | 7.51% | -5.71% |
| Median sold price | $1,112,500 | 6.97% | -18.35% |
| Price per square foot | $313 | 0.10% | 5.15% |
| Active listings | 295 | -3.80% | -6.75% |
| Median days on market | 53 | 0.95% | 2.91% |
| Rental properties | 135 | 218.87% | -11.52% |
| Median rent | $2,043 | -27.04% | -2.67% |
Source: Realtor.com Economic Research, as shown on the page. Commercial content; not independently verified.
Which Milton price is the real one?
Seven published figures run from $940,000 to $1,750,000. The brokerage's $940,000 is a median home price for a trailing 30 days. The postal area's sold median of $965,000 and the city's $1,112,500 are Realtor.com figures for September. Redfin's $1.3 million is a three-month window to August. Realtor.com's listing medians are $1,197,500 for the postal area and $1,750,000 for the city. Zillow's $951,308 is a typical value but from a page dated April 30. The highest is 1.9 times the lowest.
The listing median of $1,750,000 is 57.3% above the sold median of $1,112,500, and the postal area's $1,197,500 is 24.1% above its $965,000, ratios this brief computes. Asking prices run above sold prices in every market, and the gap here is large. The most likely reason is the mix: the list contains estate homes that sell rarely, and the sold list contains the many ordinary homes that sell often. This is an inference and the pages do not say it.
The Redfin median of $1.3 million is 16.9% above Realtor.com's city sold median of $1,112,500, and the brokerage's $940,000 is 15.5% below it. A figure that depends on a month, a window and a source can move by 17% without any change in the market. The Realtor.com sold median also fell 18.35% from the month before, which is the kind of swing a median makes when few homes close.
The Census owner value in the postal area is $657,700, with a margin of error of $26,186, or 4.0%. It sits 31.8% below the postal area sold median of $965,000 and 49.4% below Redfin's $1.3 million. The Census postal area has 68,707 people and covers more than the city, so its value reflects condominiums and townhouses as well as estates. This is an inference from the size of the area, and the Census does not draw the city line.
The dollars matter more than the labels. One percent of $940,000 is $9,400, one percent of $1,112,500 is $11,125 and one percent of $1,300,000 is $13,000. A seller who reads the wrong page for the home's segment can be off by tens of thousands of dollars.
| Source | Figure | What it measures |
|---|---|---|
| Local brokerage | $940,000 | Median home price, trailing 30 days to September 1 |
| Zillow | $951,308 | Typical home value, page dated April 30 |
| Realtor.com | $965,000 | Median sold price, postal area, September |
| Realtor.com | $1,112,500 | Median sold price, city, September |
| Realtor.com | $1,197,500 | Median listing price, postal area |
| Redfin | $1,300,000 | Median sale price, three months to August |
| Realtor.com | $1,750,000 | Median listing price, city |
Sources as cited. The measures, areas and periods differ and the figures are not directly comparable. Commercial content; not independently verified.
How uneven are the Milton neighborhoods?
The Realtor.com neighborhood table names four places with a listing median. The Manor Golf and Country Club shows $2,422,500 and $332 per square foot, Crooked Creek $1,200,000 and $224, Avensong $449,500 and $317, and Deerfield Green shows only a rent of $2,850. The highest listing median is 5.4 times the lowest, a ratio this brief computes, while the highest price per square foot is only 1.5 times the lowest. So the large differences in price follow the size of the homes and the lots more than the price per square foot. That is an inference from the table.
The counts of homes for sale are small. The Manor shows 19, Brookshade, Crooked Creek, Orchards of Windward and Park at Windward Village show 4 each, Avensong, Providence at Atlanta National and Taylor Glen show 3 each, and a number of places show 2. The Manor's 19 is 43% of the 44 homes shown in the first eight named places, so one community has a large share of the visible supply in this table. Crooked Creek's count of 4 is down 63.64% on the year and Orchards of Windward's 4 is up 400%, which shows how a count of four can swing.
The same page's table by postal area shows that the figures change from one area to the next. The postal area that includes Milton shows a median listing price of $1,197,500 and $277 per square foot. A neighboring postal area shows $880,000 and $307, another $824,000 and $256, and another $754,950 and $254. The table shows how the postal area that includes Milton compares: its median listing price is 1.4 times that of the next one on the list, a ratio this brief computes.
The brokerage's page describes The Manor as gated estate homes on acre-plus lots with prices from $1.2 million to $3.5 million and says that homes above $1.5 million face a thinner pool of buyers. The page says homes in the upper price tiers sit 60 to 90 days or more. These are the brokerage's statements. The practical point is that a Milton median blends estate homes with ordinary ones, and the right comparison for a particular home is the same lot size, the same school zone and the same build year. None of the pages supply that.
Source: Realtor.com and the brokerage page, as cited above. Ratios are this brief's arithmetic. Commercial content; not independently verified.
How long does a Milton sale take, and how much supply is there?
The clocks run from 44 to 54 days. Redfin shows 44 days on market for the three months to August, against 49 a year earlier, an improvement of 10%. Realtor.com shows 53 days for the city and the postal area, up 0.95% and 1.92% on the year. The brokerage shows 54 days. Zillow's April page shows around 30 days to pending, but it is five months old and the page does not say what it measures.
The counts of homes differ with the provider. Realtor.com shows 295 active listings for the city, down 3.80% on the year and down 6.75% on the month, and 159 for the postal area. The brokerage shows 192 and 62 new listings in 30 days, with 39 homes sold in the same period. So the brokerage's count of active homes is 4.9 times its monthly sales, a ratio this brief computes, and consistent with its 4.6 months of supply. Redfin counted 182 homes sold in August against 165 a year earlier, an increase of 10.3%. The sales counts of 39 and 182 cannot describe the same boundary or window.
The rental figures add a different signal. Realtor.com shows 135 rental properties in the city, up 218.87% on the year, and a median rent of $2,043, down 27.04%. A large rise in the number of rentals and a large fall in the median rent point to more lower-priced rentals entering the count. This is an inference, and the page does not explain the movement.
Price cuts are common. Redfin shows that 35.7% of homes had price drops in August. On a $1,112,500 sale a 3.1% shortfall to list, the difference from the 96.9% ratio, would be about $34,500, and on $1,300,000 it would be about $40,300. These are illustrations of what a ratio means in dollars, and not predictions of any sale.
| Source | Figure | What it measures |
|---|---|---|
| Redfin | 44 days | Median days on market, three months to August |
| Realtor.com | 53 days | Median days on market, city and postal area, September |
| Local brokerage | 54 days | Average days on market, trailing 30 days |
| Realtor.com | 295 | Active listings, city |
| Realtor.com | 159 | Active listings, postal area |
| Local brokerage | 192 | Active homes, September 1 |
| Redfin | 182 | Homes sold, August |
Sources as cited. Commercial content; not independently verified.
What does the Census say about the homes and the owners?
The Census describes a postal area of 68,707 people and 25,219 homes with a median household income of $156,100 and a median rent of $2,029. Only 1,612 homes (6.4%) were built before 1980. By decade, 1,004 (4.0%) date from the 1970s, 2,358 (9.4%) from the 1980s, 7,305 (29.0%) from the 1990s, 7,581 (30.1%) from the 2000s, 5,858 (23.2%) from the 2010s and 505 (2.0%) since 2020. Homes built since 1990 number 21,249, or 84.3%, and the median year built is 2002.
The stock matters because most of it is young. A buyer of a 1990s or 2000s home asks about the roof, the heating and cooling systems, the age of the kitchen and the home owners association, more than the structure. The Milton name also covers larger estates and older homes on acreage that the postal area's counts bury. The Census does not separate them.
Of 24,672 occupied homes, 18,277 (74.1%) are owner-occupied and 6,395 (25.9%) are rented, and 547 homes (2.2%) are vacant. The vacant homes include 173 for sale only, 105 for rent, 100 sold but not occupied, 90 held for seasonal or occasional use and 79 in other categories. Seasonal use is 0.4% of all homes, so Milton is lived in all year.
The Census also asks when owners moved in. Of the 18,277 owners, 9,137 (50.0%) moved in in the 2010s, 3,666 (20.1%) in the 2000s, 3,045 (16.7%) in 2020 to 2022, 1,693 (9.3%) in the 1990s, 464 (2.5%) in 1989 or earlier and 272 (1.5%) in 2023 or later. Owners who moved in since 2020 number 3,317, or 18.1%. Owners who moved in before 2010 number 5,823, or 31.9%, and many bought before the rise of the last decade.
The Census median owner-occupied value is $657,700. It sits well below every price on the market pages. Five-year estimates lag, the area is larger than the city and owners may undervalue their homes, and the figure does not mean that homes in Milton are worth less than the pages say. Readers comparing markets can also read the St. Simons Island brief and the Marietta brief.
Source: Census Reporter, American Community Survey 2020-2024 five-year estimates, tables B25034, B25038, B25004, B25077, B25003, B25002 and B19013. Percentages and ratios are this brief's arithmetic.
What should an owner ask, and what does a private sale change?
Ask which Milton a figure covers: the city, the postal area or a community such as The Manor. Ask which period and how many sales are behind it. Ask whether a price is a listing price, a sold price or an estimate. A seller who has the answers can read a page, and a seller who does not will find that five pages give prices that run from $940,000 to $1,750,000.
A private sale changes how a home reaches a buyer. With Maison Off-Market there are no showings and no neighbors talking about a sale, the closing date can be flexible so that an owner has time to find a new home, there are no commission costs, there are no closing costs and there are no inspections or repairs. For an owner of an estate on acreage, no showings also means no strangers walking the grounds. This brief does not claim that a private sale always brings a higher price than a public listing.
Fee arithmetic shows what the commission point means in dollars, without assuming any rate. Each 1% of a sale price is $9,650 at $965,000, $11,125 at $1,112,500 and $13,000 at $1,300,000. At 3% those amounts are $28,950, $33,375 and $39,000. At 5% they are $48,250, $55,625 and $65,000. These are illustrations of what a percentage means on the figures in this brief, and they are not a statement of what any agent charges or what any sale would cost.
Timing is the other thing an owner controls. A public listing starts a clock, and the pages above show 44 to 54 days, with the brokerage noting 60 to 90 days or more in the upper price tiers. A private sale lets the owner choose the closing date, which matters most to people who need to find the next home first or who want to close after a school year.
Privacy is often the first thing owners raise. A public listing puts photographs, a price and every price change in front of anyone, and Redfin shows that 35.7% of homes had price drops, a fact neighbors can read. A private sale keeps those details out of view. That is a matter of preference and not a claim about price.
If you are weighing a sale of a Milton home, one conversation costs nothing and obliges you to nothing. We ask about the home, the timing you would like and what you would need from a buyer, and we say plainly whether a private sale fits.
If you would like a private, no-obligation offer for a Milton home, call 401-219-4207 or use the contact form on this site.
Methodology and limitations
Prices, days on market, counts and ratios come from two Realtor.com pages with indicators as of September 2026, a Redfin page with data to August 2026, a local brokerage page dated September 1, 2026 that cites Redfin and other sources, and a Zillow page that was last updated April 30, 2026 and is therefore stale. The pages cover different places and periods and are commercial, so they are not independent of each other. The brokerage page contradicts itself on its year-over-year gain, its months of supply and its median, and its address says July while its heading says September; all are flagged above. A search result titled as a Milton real estate report belonged to a different Milton and was not used. The Census figures are five-year estimates for a postal area that is larger than the city.
Conclusion
The Milton record shows a listing median of $1,750,000 beside a sold median of $1,112,500, a Redfin median of $1,300,000, a brokerage median of $940,000, a balanced label on two pages, waits from 44 to 54 days and a stock where 84.3% of homes were built since 1990. The pages differ because they count different homes in different windows, and because the city mixes estates with ordinary homes.
Frequently Asked Questions
What is the median home price in Milton, Georgia?
Pages differ. Realtor.com showed a median sold price of $1,112,500 for the city in September 2026, Redfin showed $1.3 million for the three months to August, and a local brokerage showed $940,000.
Is Milton, Georgia a buyer's market?
Realtor.com calls it balanced with homes selling 2.09% below the asking price. Redfin calls it somewhat competitive, with 13.6% of homes sold above list and 35.7% with price drops.
How long do homes take to sell in Milton?
Redfin shows 44 days on market for the three months to August, Realtor.com shows 53 days and a brokerage shows 54 days.
How much is 1% of a Milton home price?
It is $11,125 at $1,112,500 and $13,000 at $1,300,000. At 3% those amounts are $33,375 and $39,000. This is arithmetic and not an agent's rate.
Can I sell my Milton home privately?
Yes. Maison Off-Market buys luxury homes and estates directly from their owners with no showings, flexible closing dates, no commission costs, no closing costs and no inspections or repairs. Call 401-219-4207 or use the contact form.
Compare your options before committing. Request a written private offer for your property, with no obligation, then weigh it against your listing plan.
Sources
- Realtor.com, 2026. Milton, GA Housing Market and Rental Trends. https://www.realtor.com/local/market/georgia/fulton-county/milton.
- Realtor.com, 2026. Milton Postal Area Housing Market and Rental Trends. https://www.realtor.com/local/market/georgia/zipcode-30004.
- Redfin, 2026. Milton, GA Housing Market. https://www.redfin.com/city/33985/GA/Milton/housing-market.
- Local brokerage blog, 2026. Milton Housing Market Update. https://tomwillsellga.com/milton-housing-market-update-july-2026/.
- Zillow, 2026. Milton, GA Home Values. https://www.zillow.com/home-values/395772/milton-ga/.
Related research

Seller Guide · October 6, 2026
How to Prepare Point Pleasant Beach Rental Records Before Selling
Separate rental approval, income history and booked stays before comparing sale terms.

Seller Guide · October 6, 2026
How to Prepare Rumson Flood and Waterfront Records Before Selling
Separate flood disclosure, elevation, repairs and waterfront rights before comparing sale terms.

Seller Guide · October 6, 2026
How to Prepare Sarasota Condo Inspection and Reserve Records Before Selling
Separate building condition, reserve funding and resale documents before comparing sale terms.