Market Brief · by Aidan Sowa · October 5, 2026
Why Does Dover Shores Show Such Different Medians? Reading the Water Streets, the Pier Permit and the Census Move-In Years
Reading the Water Streets, the Pier Permit and the Census Move-In Years for Dover Shores, CA, with each source dated and its limits noted, for owners weighing a listing against a direct sale.
Why does Dover Shores have no stable median price? A local brokerage's analysis of 20 recent closings reports a median of $5,762,500, with prices from $2,950,000 to $18,000,000. A team's page for the neighborhood shows $5,967,424 from 56 sales. Redfin's page shows $6.7 million for the three months ending April 2026. A broker's blog collected three snapshots of active listings in July and August 2026 with median list prices of $7,322,500, $7,650,000 and $9.8 million, drawn from between six and ten homes. The highest of these figures is 70.1% above the lowest, a ratio computed here, and the blog's own point is that the sample is too small to mean much.
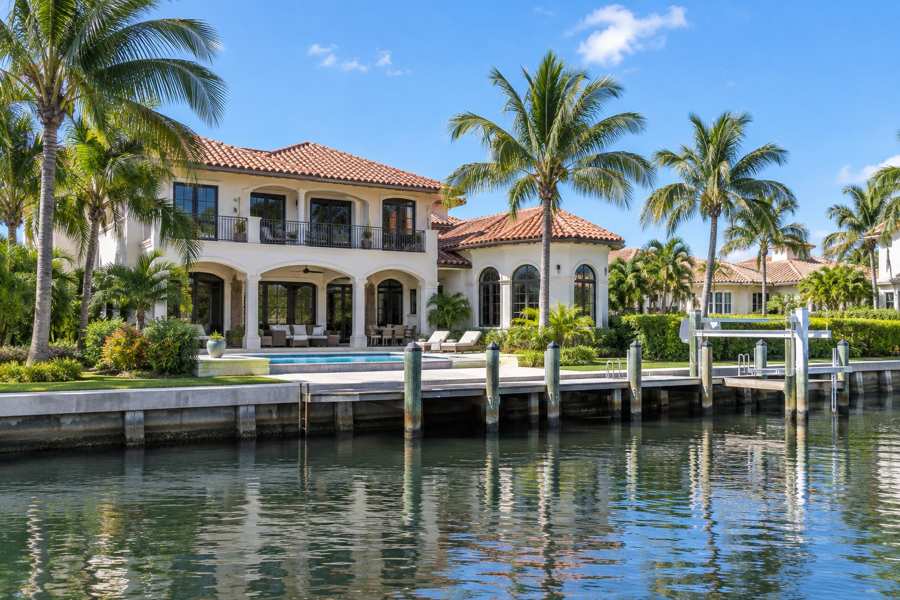
The pages that explain the differences point to the water. The analysis says the water streets carry an 88% price premium and sell 40% faster than the interior, and a broker's blog says frontage, dock rights and the bay-facing lot, not the size of the house, do most of the work in the price. One page says a 1,903 square foot house on a 6,000 square foot lot sold for $6,750,000 in February 2026, and another says a 6,601 square foot house sold for $16.5 million in January. This brief reports those as the pages' claims. A single median blends interior homes and bay-front estates, and says little about either.
Maison Off-Market speaks only to sellers. In the Census postal area that includes Dover Shores, 49.2% of the 15,533 occupied homes are owned, and of the 7,636 owner households, 51.1% moved in since 2010 and 15.4% have been in their homes since 1989 or earlier. This brief takes the move-in-year, household and income cuts. The last section sets out what a private sale changes for an owner.
Key Findings
- A local brokerage's analysis of recent Dover Shores sales said 20 closings ran from $2,950,000 to $18,000,000 with a median of $5,762,500, $1,588 per square foot and a median of 31 days on the market, that water streets carried an 88% price premium and sold 40% faster, and that six homes were active in mid-September 2026 at $4,995,000 to $9,800,000 (Local brokerage analysis, Dover Shores).
- Redfin's page for the neighborhood showed a median sale price of $6.7 million for the three months ending April 2026, up 15.3% over a year, and $1,950 per square foot, down 17.3%. Its latest single sale was $9.1 million, 1.1% under list after 147 days, and the page counted 1 home sold (Redfin, Dover Shores housing market).
- A broker's September 3, 2026 blog said neighborhood medians quoted by portals ranged from $7,322,500 to $9.8 million on samples of six to ten active listings, that the neighborhood has about 310 single-family homes, and that a state review of Newport Harbor in December 2025 found residential pier rents below market (Broker blog, Dover Shores median price).
- A business newspaper reported on February 9, 2026 that a 6,600 square foot Dover Shores estate with 148 feet of harbor frontage sold for $16.5 million, about $2,500 per square foot and about 17% below its first asking price of nearly $20 million, after 298 days on the market (Local business newspaper, Dover Shores sale).
- The Census postal area that includes Dover Shores has 17,061 housing units, 7,636 owner households, 7,897 renter households, a median household income of $159,564 and a median owner value reported as $2,000,001, the top category the Census publishes.
Why do the Dover Shores medians differ so much?
The pages differ in what they count and in how few homes they count. The analysis uses 20 closings over about two years. A team's page for the neighborhood shows a median of $5,967,424, 46 days and $1,538 per square foot from 56 sales, with no date (Brokerage team page, Dover Shores). The two sales counts, 20 and 56, cannot describe the same window and area, and the pages do not say how they differ. Redfin's $6.7 million rests on a three-month window in which the page counts one home sold. The first two figures are 3.6% apart, computed here, which looks like agreement but comes from different samples.
The listing medians are even less stable. The broker's blog collects a national listing site's $7,650,000 for July from six or seven homes, another site's $7,322,500 for July 29 from ten homes, and a boutique brokerage's $9.8 million for August 13 from seven homes, with active prices from $5.5 million to just under $13 million. It says a swap of two or three listings moves the median by millions and that this is sample size, not volatility. The analysis says six homes were active in mid-September, at $4,995,000 to $9,800,000. A median of six numbers is the average of the middle two, and this brief does not treat any of these as the price of Dover Shores.
The sold figures conflict on days as well. The analysis gives a median of 31 days, with closings from 0 to 173 days, and says no recent sale showed a large gap between listing days and cumulative days. The business newspaper says the $16.5 million sale took 298 days on the market. If that sale is among the analysis's 20, the two cannot both be right. If it is not, the sample misses the slowest and largest sale, and the pages do not say which. Redfin shows 147 days for its single latest sale. The range from 31 to 147 and 298 is a range of samples and not of homes.
Redfin's figures conflict inside the page. The headline median of $6.7 million is up 15.3%, but the page's latest sale price of $9.1 million is down 49.4% and its price per square foot is down 17.3%. A median that rises while the price per foot falls is possible when larger homes sell, but with one sale in the window it is more likely a sign of a thin sample. This brief therefore reports Redfin's figures as printed and does not draw a trend from them. The analysis's $1,588 per square foot median and Redfin's $1,950 differ by 22.8%, computed here.
Do the water streets make Dover Shores two markets?
The analysis says so, and puts numbers on it. It reports that the water streets carry an 88% price premium and a 39% premium per square foot over the interior, and that waterfront homes sell 40% faster. It contrasts that with the Balboa Peninsula, where it says oceanfront carried a 75% premium but took 66% longer to sell. Its explanation, which is an inference from one broker's analysis, is that a Back Bay waterfront home at $8 million is a primary residence with a dock, while an oceanfront home is often a second home, a smaller and slower pool of buyers. Its price per square foot ran from $1,232 to $3,547, a spread of 2.9 times, computed here.
The broker's blog describes the same split with examples. In January 2026, it says, a 6,601 square foot house on a 9,776 square foot lot sold for $16.5 million, and a house on a larger lot of 12,834 square feet with roughly 40% less living space sold for $5,675,000. In February, a 1,903 square foot house on a 6,000 square foot lot sold for $6,750,000. That is $3,547 per square foot, computed here, and matches the top of the analysis's range. The blog says the highest prices cluster on streets with direct bay frontage and private docks, while similar houses a few streets inland sell for a fraction of the price.
A local brokerage blog on bayfront values adds that Dover Shores has about 310 homes and that the private beaches are not limited to bayfront owners (Local brokerage blog, Dover Shores bayfront values). It says the association's policy lets every homeowner use all three private beaches, and that dues have run well under $150 a month. The analysis gives the dues as billed once a year at $1,383 to $2,100, which is $115 to $175 a month, computed here, and says two in five listings report $0. The two pages agree that the amount is modest and the listing field is unreliable.
The pier permit is the least visible cost. The broker's blog says the land under the docks is public tideland held in trust by the state and managed by the city, that a buyer receives a pier permit and not a deed to the water, and that the permit, with a term of up to ten years, has to be transferred at close with a fee. It says a December 2025 state review found that residential pier holders pay about 58 cents per square foot per month, that some owners sublease slips for as much as $12,000 a month, and that the city plans appraisals in 2026 and a council vote in 2027. The blog says no rate change takes effect before that vote. These are the blog's statements and were not checked against the city's own pages.
How fast do Dover Shores homes sell, and what is for sale?
The clocks run from 31 days to 298. The analysis gives a median of 31 days across 20 closings, two at zero days, five within ten days and four over a hundred. The team's page gives 46 days on average from 56 sales. Redfin gives 147 days for its single sale, and the business newspaper gives 298 for the $16.5 million estate. A median of 31 with four sales over 100 days is a split market, in the analysis's words, where correctly priced homes move in about a month and the rest sit. The analysis cites listings active for 463, 167 and 90 days in September. That is the analysis's description and was not checked.
The analysis also compares vintage with position. It says a 1966 home sold for $15,050,000 in twelve days while a 2022 home listed at $18,000,000 took 156 days, and concludes that on the Back Bay position outweighs vintage. It says six active listings against 20 sales in two years is roughly a seven-month supply, which this brief computes as 7.2 months if the sales span 24 months. Three homes were under contract and two pending. A seller who lists into a thin market with a few listings is competing with a few homes, and one stale listing can set the comparison.
The price gap between asking and selling is visible in the newspaper's report. The $16.5 million sale closed about 17% below its first asking price of nearly $20 million, and 16.5 over 20 is 82.5%, computed here, which fits an ask just under $20 million. Redfin shows its latest sale at 1.1% under list. The two examples sit at opposite ends, and with samples of one each, neither is a measure of the market. A seller should ask for closed sales on the same kind of lot, with the first ask, the cumulative days and the final price.
The rent and income checks are limited. The Census median household income for the postal area is $159,564 and the median rent is $3,501, so the analysis's median of $5,762,500 is 36.1 times the income, a rough ratio of two medians for a neighborhood much richer than the postal area. The Census figures cover a wider area than Dover Shores and say little about the homes. The postal area has a household size of 2.2 people, computed from 34,890 residents in 15,533 occupied homes, and half of its occupied homes are rented.
| Source | Figure | What it measures |
|---|---|---|
| Local brokerage analysis | $5,762,500 | 20 closings; median 31 days; $1,588 per square foot |
| Brokerage team page | $5,967,424 | 56 sales; 46 days; undated |
| Redfin | $6.7 million, up 15.3% | Three months ending April; 1 home sold |
| Broker blog | $7,322,500 to $9.8 million | Median list prices from 6 to 10 active homes |
| Local business newspaper | $16.5 million | One estate; 148 feet of frontage; 298 days |
| Local brokerage analysis | $4,995,000 to $9,800,000 | Six active listings in mid-September |
Sources as cited. The windows, areas and measures differ and the figures are not directly comparable. Commercial content; not independently verified.
What does the Census say about owners and movers near Dover Shores?
The Census postal area that includes Dover Shores has 17,061 housing units and 34,890 residents, and it covers far more than the 310 homes of the neighborhood. Of 15,533 occupied homes, 7,636 are owned, 49.2%, and 7,897 are rented, 50.8%. The median household income is $159,564 and the median rent $3,501. The median owner value is reported as $2,000,001, the top category the Census publishes, so the true median is at least that and it cannot be compared with a sale price. These are postal-area figures and not Dover Shores figures.
Owners moved in at different times. Of 7,636 owner households, 92 moved in in 2023 or later, 1.2%, and 1,086 in 2020 to 2022, 14.2%. Another 2,726 moved in during the 2010s, 35.7%, 1,399 in the 2000s, 18.3%, 1,155 in the 1990s, 15.1%, and 1,178 in 1989 or earlier, 15.4%. Since 2010, 3,904 owners have moved in, 51.1%, and before 2000, 2,333, 30.6%. A third of owners have held their homes since before 2000. That fits the pages' description of a neighborhood where residents put down roots and stay, though the Census cannot say where in the postal area they live.
Renters are newer. Of 7,897 renter households, 499 moved in in 2023 or later, 6.3%, 2,871 in 2020 to 2022, 36.4%, 4,001 in the 2010s, 50.7%, 283 in the 2000s, 3.6%, 152 in the 1990s, 1.9%, and 91 in 1989 or earlier, 1.2%. Since 2020, 3,370 renter households have moved in, 42.7%, and since 2010, 7,371, 93.3%. The renter base turns over quickly, and the owner base does not, which means a long-held home is the typical owner's home in this postal area.
The homes are mostly from the 1960s and 1970s. The median year built is 1980, and homes built before 1980 number 8,737, 51.2%. The 1970s are the largest decade, with 4,364 homes, 25.6%, followed by the 1960s with 3,214, 18.8%. The analysis says the homes that traded in Dover Shores were built between 1955 and 2025, with a median year of 1967, and that the tract is in the middle of a long rebuild. The Census says nothing about the condition of any one house, and a 1960s waterfront tract can hold both a teardown and a new build. Readers comparing markets can also read the Eastbluff brief and the Newport Center brief.
Source: Census Reporter, American Community Survey 2020-2024 five-year estimates, tables B25024, B25003, B25038, B25004, B25034, B25077, B25064 and B19013. Percentages and ratios are this brief's arithmetic.
What should an owner ask, and what does a private sale change?
The first question is which Dover Shores the home is in. The water streets, the interior streets and the sub-areas inland do not share a median, a buyer or a clock, according to the pages. A seller should ask for closed sales on the same kind of lot, from the last twelve months, with the frontage, the dock permit status, the cumulative days and the gap between the first ask and the final price. In a neighborhood with a handful of sales a year, a seller's comparison may be a single house.
The second question is what a number measures. Ask whether it is a closed price or a list price, a median or an average, and how many homes it covers. The pages above differ on every one of those points, and a seller who reads the broker blog's median list price of $9.8 million as a sale price will overshoot the analysis's $5,762,500 by 70.1%, computed here, on a sample of seven homes.
The third question is the cost of selling, and the arithmetic is simple. Each 1% of $5,760,000 is $57,600. At 3% the figure is $172,800 and at 5% it is $288,000. At $5,970,000, each 1% is $59,700, 3% is $179,100 and 5% is $298,500. At $6,700,000, each 1% is $67,000, 3% is $201,000 and 5% is $335,000. These illustrate the size of each percentage point and are not quotes of any rate a seller would be charged. No page in this brief names a Dover Shores commission rate, and the medians are not the price of any one home.
The fourth question is the dock. A public sale of a bay-front home involves a pier permit transfer, a fee and a review of how many feet lie between the bulkhead and pierhead lines, and a state review that could change pier rents. The broker's blog says buyers now ask sellers for the current annual pier rent in writing. A public listing also means showings, a price history and neighbors watching the days on market. A private sale has no showings and no neighbors talking about a sale.
The benefits are plain. Maison Off-Market buys luxury homes and estates directly from their owners and speaks only to sellers. A private sale has no showings. It allows closing dates that give a seller time to find a new home. It has no commission costs and no closing costs, and it avoids inspection repairs, which matters for a tract where the analysis says many homes date from the 1960s, though the Census says nothing about the condition of any one house. The company does not say that a private sale always beats a public listing, and in a neighborhood where one page shows $5.76 million and another $9.8 million, an owner is right to ask what each route yields. If you would like a private, no-obligation offer for a Dover Shores home, call 401-219-4207 or use the contact form on this site.
Methodology and limitations
The brokerage analysis is a commercial page whose sales sample of 20 and measures were not independently checked. The team page is undated and its 56 sales conflict with the analysis. Redfin's figures rest on one sale in the window and conflict inside the page. The broker blog's snapshots are active listings in July and August and its claims about the pier review were not checked against the city. The business newspaper reports one sale and quotes a broker. The Census figures are five-year estimates for a postal area that covers far more than Dover Shores, and the median owner value is the top category, $2,000,001. Percent changes were taken as printed, and ratios and sums are this brief's arithmetic.
Conclusion
The Dover Shores record shows medians from $5.76 million to $9.8 million, clocks from 31 to 298 days, an 88% premium for the water streets by one analysis and a pier permit that is under city review. The pages differ because they count a handful of homes in different windows, and the useful figure for an owner is the one for the same lot and the same frontage.
Frequently Asked Questions
What is the median home price in Dover Shores?
Pages differ. A brokerage analysis shows $5,762,500 for 20 closings, a team page shows $5,967,424, Redfin shows $6.7 million and blog snapshots of active listings show $7,322,500 to $9.8 million.
Why do Dover Shores median prices vary so much?
The neighborhood has about 310 homes and often fewer than ten for sale, so swapping two or three listings moves a median by millions, according to a broker's blog.
Does Dover Shores have an association?
A brokerage analysis says dues are billed annually at $1,383 to $2,100 and many listings report nothing. Another blog says every owner can use the three private beaches.
What kinds of homes are in the Dover Shores postal area?
In the Census postal area that includes Dover Shores, 49.2% of occupied homes are owned, 51.2% of homes were built before 1980 and the median household income is $159,564.
Can I sell my Dover Shores home privately?
Yes. Maison Off-Market buys luxury homes and estates directly from their owners with no showings, flexible closing dates, no commission costs, no closing costs and no inspections or repairs. Call 401-219-4207 or use the contact form.
Compare your options before committing. Request a written private offer for your property, with no obligation, then weigh it against your listing plan.
Sources
- Local brokerage analysis, 2026. Dover Shores Newport Beach: HOA Dues, Prices, Beaches. https://jadelarney.com/neighborhoods/dover-shores.
- Redfin, 2026. Dover Shores, CA Housing Market. https://www.redfin.com/neighborhood/115849/CA/Newport-Beach/Dover-Shores/housing-market.
- Broker blog, 2026. Dover Shores Median Price Is Misleading: What Actually Drives Value in 2026. https://cassiefrench.com/blog/dover-shores-median-price-is-whatever-the-portal-pulled-that-week-heres-what-actually-sets-value.
- Local business newspaper, 2026. Dover Shores Home Sells for $16.5 Million. https://www.ocbj.com/oc-homepage/dover-shores-home-sells-for-16-5-million/.
- Brokerage team page, 2026. Dover Shores Real Estate and Luxury Homes for Sale. https://masontaylorassociates.com/neighborhoods/dover-shores.
- Local brokerage blog, 2026. What Drives Dover Shores Bayfront Home Values?. https://weirproperties.com/blog/the-real-premium-in-dover-shores-isnt-the-private-beach-you-already-have.
Related research

Seller Guide · October 6, 2026
How to Prepare Point Pleasant Beach Rental Records Before Selling
Separate rental approval, income history and booked stays before comparing sale terms.

Seller Guide · October 6, 2026
How to Prepare Rumson Flood and Waterfront Records Before Selling
Separate flood disclosure, elevation, repairs and waterfront rights before comparing sale terms.

Seller Guide · October 6, 2026
How to Prepare Sarasota Condo Inspection and Reserve Records Before Selling
Separate building condition, reserve funding and resale documents before comparing sale terms.