Market Brief · by Aidan Sowa · October 5, 2026
Who Owns the Homes in Andersonville When Renters Fill Most of Them? Reading the Rents, the Tenure and the Cost Burden
Reading the Rents, the Tenure and the Cost Burden for Andersonville, IL, with each source dated and its limits noted, for owners weighing a listing against a direct sale.
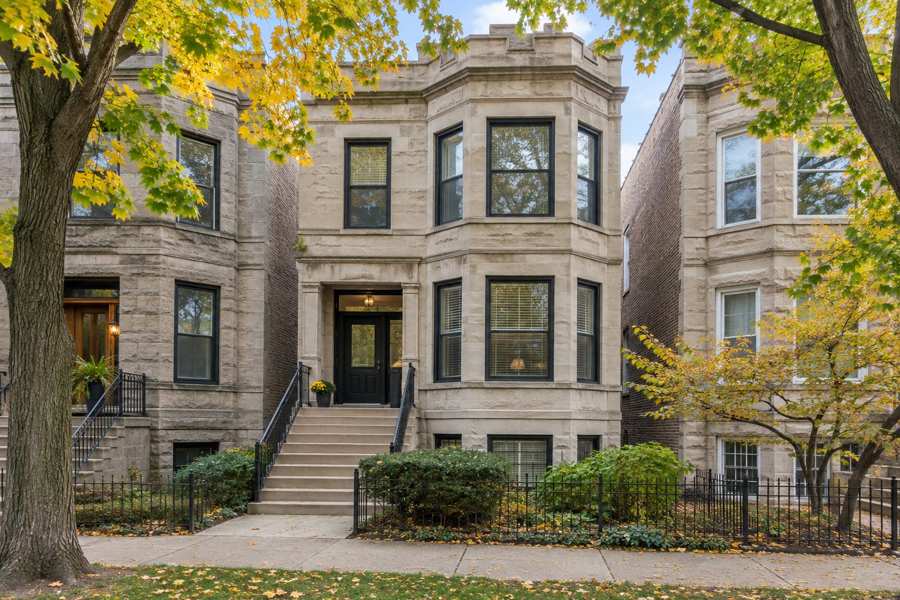
Who owns the homes in Andersonville when renters fill most of them? In the postal area that includes Andersonville, the Census counts 37,848 occupied homes. Owners hold 12,023 of them, 31.8%, and renters hold 25,825, 68.2%. A seller in this part of Chicago is therefore in the smaller group, and the market around that seller is shaped mostly by the larger one.
Renting is also where the cost pressure shows. Of the 24,875 renter homes with a computed rent share, 11,564, or 46.5%, spend 30% or more of income on rent. Realtor.com's median asking rent for the postal area is $1,950 for June 2026, against a Census median gross rent of $1,413. These figures describe the people on the other side of the street from an owner, and they explain why the area keeps a steady flow of buyers and tenants.
This brief takes the renter side of the numbers first and then turns to what an owner can do with them. It covers who holds tenure, how long households have been in place, how many bedrooms each group has, how heavy housing cost is, what the rental listings show, and what to ask before choosing a listing or a direct sale.
Key Findings
- The Census counts 41,362 housing units in the postal area, 37,848 occupied, 12,023 by owners and 25,825 by renters, with 3,514 vacant. The median owner value is $370,300, plus or minus $19,046, the median household income is $73,254, plus or minus $3,119, and the median gross rent is $1,413, plus or minus $39.
- Of 25,825 renter homes, 24,875 have a computed rent share. Of those, 11,564, or 46.5%, pay 30% or more of income on rent, and 5,798, or 23.3%, pay half or more.
- Realtor.com's page, with key indicators as of June 2026, shows 931 rental properties, down 9.28% on the year, and a median rent of $1,950, up 8.64% on the year and up 13.64% on three years (Realtor.com, Andersonville postal area).
- Redfin's page for the same postal area has a latest month of February 2026, with a median sale price of $336,000 and a median of 54 days on the market (Redfin, Andersonville postal area). Only a city-level Zillow page was found, so no Zillow figure is used.
- Renters are the newer arrivals and the lighter sleepers. Owners have been in place for longer, and an owner who sells may be selling into a neighborhood where most of the people nearby have lived there for a short time.
How do owners and renters divide the homes in Andersonville?
The split is lopsided. Of 37,848 occupied homes, 25,825, or 68.2%, are rented and 12,023, or 31.8%, are owned. Put another way, there are about 2.1 renter homes for every owner home, computed from the Census counts. An owner in the postal area lives among tenants, in buildings that are often shared with them.
The housing stock explains the split. The Census counts 2,446 detached houses and 649 attached houses among 41,362 units, and 32,974 units in buildings of five or more. A further 1,622 are in buildings of two units and 3,671 in buildings of three or four. Owners and renters both live in these buildings, but the table does not say in which. The brief therefore makes no claim about the share of condominiums or the share of rental apartments.
Vacancy adds a little. Of 3,514 vacant units, 1,304 are for rent and 172 are rented but not yet occupied, together 1,476, or 42.0% of vacant units. Only 100 are for sale only and 79 are sold but not yet occupied. For a seller, the contrast is plain: 1,304 units were vacant and for rent when the survey was taken, against 100 vacant and for sale. The survey counts a moment, and the figures are estimates, so the contrast is a rough guide.
The stock is old, which matters for owners and renters alike. Of 41,362 units, 19,095, or 46.2%, were built before 1940, and homes built before 1980 total 32,736, or 79.1%. The median build year is 1946. An older building may carry repair needs that fall on an owner, and the Census does not measure condition, so the brief offers no claim about any one building.
A common trap for a seller in a neighborhood like this is to read a postal-area median as the price of a particular home. The median is the middle of many sales across different building types, sizes and ages. A greystone, a two-flat, a condominium in a larger building and a newer unit each sit in a different part of the range. The fair comparison is with closed sales of the same kind of home on nearby blocks, and with how long each one took, since two homes with the same price on paper can have very different waits behind them.
Sources as cited. Shares and ratios are computed from the Census counts.
How long have owners and renters stayed in place in Andersonville?
Owners are the longer-settled group. Of 12,023 owner homes, 511 were taken up in 2023 or later, 2,136 in 2020 to 2022, 4,903 in the 2010s, 2,240 in the 2000s, 1,403 in the 1990s and 830 before 1990. That puts 18.6% of owners in place since before 2000, and 40.8% arriving in the 2010s.
Renters turn over faster. Of 25,825 renter homes, 2,266 were taken up in 2023 or later, 9,668 in 2020 to 2022, 11,002 in the 2010s, 2,004 in the 2000s, 629 in the 1990s and 256 before 1990. Households that arrived in 2020 or later are 11,934, or 46.2%, of renters, against 2,647, or 22.0%, of owners.
The gap is a reminder that the people near an owner change more often than the owner does. A household that has been in a home for many years sees the neighbors come and go, and a sale to a private buyer does not change that. What it can do is keep the sale out of view while it happens, since there are no showings and no neighbors talking about the owner selling.
Population gives the same picture from another side. The postal area has 65,445 residents, with a margin of error of 1,868. The largest age band is 25 to 34, at 17,283, or 26.4%. The 45 to 64 band has 15,946, or 24.4%, the 35 to 44 band has 12,142, or 18.6%, and the 65 or older band has 8,934, or 13.7%. Children under 18 number 6,857, or 10.5%, and 18 to 24 year olds 4,283, or 6.5%.
The renter share also affects what a buyer sees on the street. A block with many renters has more moving days, more changes of name on the mailboxes and more people who are in the area for a short stay. That is not good or bad for an owner. It is a fact of the setting, and it can make an owner more careful about how much of a sale is visible. A private sale keeps showings, open houses and signs out of the picture, so the neighbors learn about the sale only when the owner chooses to tell them.
The brief draws one careful inference and labels it as such. With a large band of residents in their late twenties and thirties and a high renter share, a sizable part of the local housing demand is likely to come from households that rent now and may buy later. The sources do not measure that, so it is an inference and not a finding.
Sources as cited. Shares are computed from the Census counts.
What do bedroom counts say about who lives where in Andersonville?
Renters live in smaller homes. Of 25,825 renter homes, 5,246 have no separate bedroom, 20.3%, 11,443 have one, 44.3%, 6,715 have two, 26.0%, 2,189 have three, 8.5%, 147 have four and 85 have five or more. One and two bedrooms together are 18,158, or 70.3%.
Owners live in somewhat larger ones. Of 12,023 owner homes, 218 have no separate bedroom, 2,278 have one, 4,929 have two, 3,217 have three, 850 have four and 531 have five or more. Two bedrooms is the most common size, at 41.0%, and homes with three or more bedrooms total 4,598, or 38.2%.
Three bedrooms or more is where the groups differ most. Among renters, 2,421 homes, or 9.4%, have three or more. Among owners, the figure is 38.2%. A seller of a larger home, such as a greystone or a house with several bedrooms, is selling into a small slice of the stock, and the price figures in the headline medians describe mostly smaller units.
That point is worth keeping in mind when reading any median. Redfin's median sale price of $336,000 and Realtor.com's median sold price of $372,000 are for all homes that sold in a month, and in a stock made up mostly of smaller units in larger buildings, the middle of the market is a unit and not a house. The sources give no median by bedroom count, so the brief states none.
The spread around the median matters here as well. In a stock with many small units and a few larger homes, the middle of the market is a small unit, and a seller of a larger home cannot read the median as a guide to their own price. The sources show medians and not the full range. A seller can ask for the sales of larger homes in the last year, how far each sold from its list price and how many weeks each took, and then compare those with the headline numbers in this brief.
A larger home also has a different set of buyers. Owners of larger homes are a minority, and a buyer for such a home may come from outside the neighborhood or may be an existing owner trading up. These are possibilities and not findings. The practical question is how many similar homes sold in the past year and how long each took, which an owner can ask for and compare.
Sources as cited. Shares are computed from the Census counts.
How heavy is housing cost on Andersonville renters and owners?
The rent burden is the plainest figure in the table. Of 25,825 renter homes, 950 have no computed rent share, leaving 24,875. Of those, 710 pay less than 10% of income, 1,809 pay 10% to 14.9%, 3,581 pay 15% to 19.9%, 3,502 pay 20% to 24.9% and 3,709 pay 25% to 29.9%. Then 2,291 pay 30% to 34.9%, 1,595 pay 35% to 39.9%, 1,880 pay 40% to 49.9% and 5,798 pay 50% or more.
Taken together, 11,564 renter homes, or 46.5% of those computed, pay 30% or more, and 5,798, or 23.3%, pay half of income or more. The 50% band is the single largest of the nine, larger than the 25% to 29.9% band at 3,709. The Census does not say why, and the brief draws no conclusion, but the result shows a renter group under real pressure.
Owners with a mortgage carry less of a burden. Of 8,282 owner homes with a mortgage, 10 have no computed share, leaving 8,272. Of those, 2,190, or 26.5%, pay 30% or more of income on owner costs, and 717, or 8.7%, pay half or more. Owners without a mortgage number 3,741, of whom 63 have no computed share, and 940 of the remaining 3,678, or 25.6%, still pay 30% or more, which reflects taxes and upkeep.
Income and rent frame these figures. The median household income is $73,254, plus or minus $3,119, and the median gross rent is $1,413, plus or minus $39. Realtor.com's median asking rent is $1,950, up 8.64% on the year, which implies about $1,795 a year before, and up 13.64% on three years, which implies about $1,716. The asking median is 38.0% above the Census gross rent, taking the Census as the base.
Cost burden figures are best read as a description of the neighborhood and not as a verdict on any household. The Census measures the share of income spent on housing for each home at the time of the survey, and a household can move in and out of a band from one year to the next. For an owner, the practical meaning is that many households nearby are stretched.
Asking rents and Census rents are different things. Census gross rent covers every renter, including those on older leases, while the asking median covers only homes currently advertised. The gap is a sign that new leases cost more than existing ones, though the sources do not prove it. For an owner who is also a landlord, or an owner of a multi-unit building, the gap is worth a closer look with local data.
| Share of income on rent | Renter homes | Share of computed |
|---|---|---|
| Under 10% | 710 | 2.9% |
| 10% to 14.9% | 1,809 | 7.3% |
| 15% to 19.9% | 3,581 | 14.4% |
| 20% to 24.9% | 3,502 | 14.1% |
| 25% to 29.9% | 3,709 | 14.9% |
| 30% to 34.9% | 2,291 | 9.2% |
| 35% to 39.9% | 1,595 | 6.4% |
| 40% to 49.9% | 1,880 | 7.6% |
| 50% or more | 5,798 | 23.3% |
Sources as cited. Shares and ratios are computed from the Census counts; renter homes with no computed rent share are excluded.
What do the rental listings and sale pages show about Andersonville?
Realtor.com shows 931 rental properties for June 2026, down 9.28% on the year, which implies about 1,026 a year before, and down 17.56% on three years, which implies about 1,129. Against 1,304 vacant units for rent in the Census, the listing count is lower, but the two count different things, since the Census is a five-year survey and the page counts active listings at one date.
On the sale side, Redfin's page has a latest month of February 2026, and Realtor.com's has key indicators as of June 2026, so Redfin's page is the older of the two by four months. Redfin shows a median sale price of $336,000, down 0.44% on the year, 136 homes sold, up from 121, and a median of 54 days on the market against 60. Realtor.com shows a median sold price of $372,000 and a median listing price of $335,000.
The Census median owner value is $370,300, plus or minus $19,046, which is 5.1% of the value. Realtor.com's sold median is 0.5% above it, and Redfin's sale median is 9.3% below it, taking the Census as the base in both cases. The spread between the pages is modest, but the pages are four months apart and measure different things.
Two flags apply. Realtor.com's sale-to-list ratio of 106% conflicts with its own text, which says homes sold for about the asking price, so the brief does not use it. Redfin's page shows the change in days on market as 7 days while its own figures of 54 and 60 differ by 6. Only a city-level Zillow page was found, so no Zillow figure is used.
The stock mix matters for the reading of every page here. The pages count homes of every kind together, and the Census counts show that most units are in larger buildings. Because the sources do not split by type, a careful reader keeps a list of what the figures cannot say: they cannot say what a greystone sells for, they cannot say what a unit in a tall building sells for, and they cannot say how long a particular home would take. A seller who needs those answers should ask for comparable sales before choosing a path.
For a seller, the combined picture is a postal area where homes sell in roughly one to two months, rents have risen and rental listings have fallen. None of this is a forecast. It is a description of the pages as they stood, and a seller should treat it as background for a conversation about price and timing, not as a promise. Readers comparing markets can also read the Uptown brief and the Wilmette brief.
Sources as cited. Earlier values are computed from the published percentages.
What should an Andersonville owner ask before choosing a listing or a private sale?
Four questions are worth keeping apart. What do sales of homes of the same type and size show, since the headline medians mostly describe smaller units? How long might a listing take, and how many showings would it need? What would inspections and repairs cost in a building this old? And what date does the owner need to close? The first question is about price, the second about time, the third about cost and the fourth about the next home.
For illustration only, a total commission of 1%, 3% or 5% on a sale of $450,000 would be $4,500, $13,500 or $22,500. On $725,000 it would be $7,250, $21,750 or $36,250, and on $1,200,000 it would be $12,000, $36,000 or $60,000. At the Census median owner value of $370,300, the same percentages come to $3,703, $11,109 and $18,515. These are arithmetic and not quoted rates, since commissions are negotiated.
The five benefits of a private sale to Maison Off-Market are privacy, because there are no showings and no neighbors talking about the sale, closing dates that can be flexible and give time to find a new home, no commission costs, no closing costs and no inspections or repairs. In a neighborhood where most households rent and many are new, privacy may carry extra weight for an owner who does not want the sale to be talked about. The brief does not claim a private sale always beats a listing.
Maison Off-Market buys luxury homes and estates directly from their owners and speaks only to sellers. An owner who wants to see what a direct purchase would look like, with no public listing and no showings, can use the contact form below and ask for an offer before deciding.
Sources as cited. Fee figures are arithmetic and not quoted rates.
Methodology and limitations
Each page's date, title and place were read before use. The Redfin page's latest month is February 2026 and the Realtor.com page has key indicators as of June 2026, so the Redfin page is the oldest source and is used with that flag. The Realtor.com sale-to-list ratio of 106% conflicts with its own text and is not used. The Redfin change in days on market is stated as 7 days against a difference of 6 in its own figures. Only a city-level Zillow page was found, so no Zillow figure is used. The Census figures are five-year survey estimates with margins of error, are for a postal area and not for the neighborhood alone, and are shared with another post about the same postal area, so no figure stands for one home. Shares exclude renter homes with no computed rent share. Earlier values are computed from published percentages and are approximate. No figure here is a forecast.
Conclusion
The record for Andersonville, as far as the pages allow, is a postal area where renters hold about two of every three homes, where renter households are newer and more stretched than owners, where asking rents sit well above the Census gross rent, and where the price pages agree within a modest range. For an owner, the practical step is to ask for sales of homes of the same type and size, compare the cost and risk of a listing with a direct offer, and decide how much of the showing, inspection and timing risk to carry.
Frequently Asked Questions
How many Andersonville homes are rented?
In the postal area that includes Andersonville, the Census counts 25,825 renter homes out of 37,848 occupied, or 68.2%.
How much of income do Andersonville renters spend on rent?
Of 24,875 renter homes with a computed share, 11,564, or 46.5%, pay 30% or more of income on rent and 5,798, or 23.3%, pay half or more.
What is the median rent near Andersonville?
Realtor.com showed a median asking rent of $1,950 for June 2026, and the Census median gross rent is $1,413.
What is the median home price near Andersonville?
Redfin showed a median sale price of $336,000 for February 2026, Realtor.com showed a median sold price of $372,000 for June 2026, and the Census median owner value is $370,300.
Can I sell my Andersonville home privately?
Yes. Maison Off-Market buys luxury homes and estates directly from their owners with no showings, flexible closing dates, no commission costs, no closing costs and no inspections or repairs. It does not say a private sale always beats a listing.
Compare your options before committing. Request a written private offer for your property, with no obligation, then weigh it against your listing plan.
Sources
- Realtor.com, postal area housing market, 2026. Housing Market Data. https://www.realtor.com/local/market/illinois/zipcode-60640.
- Redfin, postal area housing market, 2026. Housing Market Trends. https://www.redfin.com/zipcode/60640/housing-market.
Related research

Seller Guide · October 6, 2026
How to Prepare Point Pleasant Beach Rental Records Before Selling
Separate rental approval, income history and booked stays before comparing sale terms.

Seller Guide · October 6, 2026
How to Prepare Rumson Flood and Waterfront Records Before Selling
Separate flood disclosure, elevation, repairs and waterfront rights before comparing sale terms.

Seller Guide · October 6, 2026
How to Prepare Sarasota Condo Inspection and Reserve Records Before Selling
Separate building condition, reserve funding and resale documents before comparing sale terms.