Market Brief · by Aidan Sowa · October 5, 2026
Which Birmingham Median Is Real? Reading Rising Medians of Different Sizes
Reading Rising Medians of Different Sizes for Birmingham, MI, with each source dated and its limits noted, for owners weighing a listing against a direct sale.
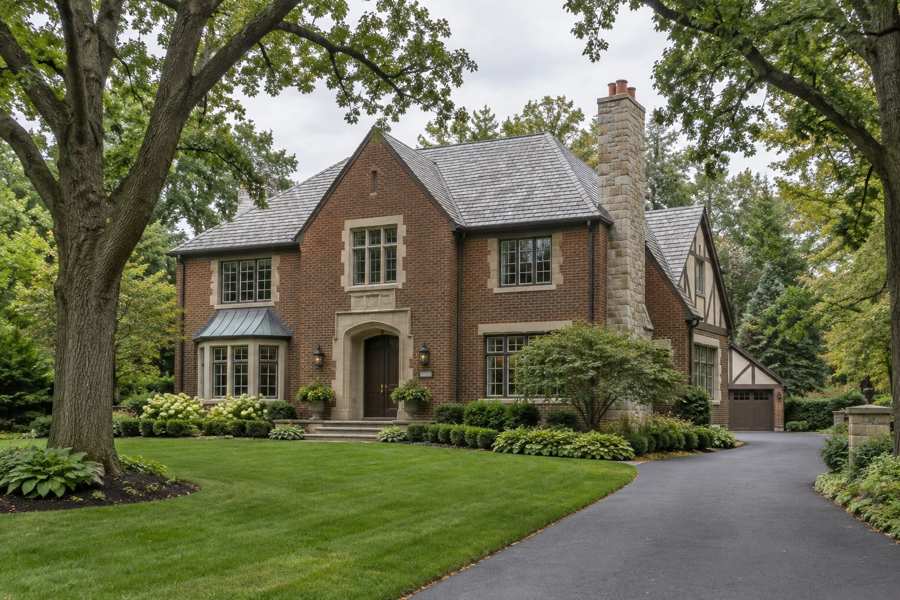
Two respected national sites publish a page for Birmingham, Michigan, and the two pages do not agree. Redfin says the median sale price over the three months to August 2026 was about $1.1 million, up 13.6% on the year. Realtor.com says the median sold price is $956,000 and that it is up 59.47% on the year. Both cannot describe the same quarter and the same homes.
The disagreement runs through the other figures. Redfin puts the price per square foot at $332, down 10.0%. Realtor.com puts it at $498, up 2.68%. Redfin calls the market somewhat competitive with homes selling in 25 days, four more than a year earlier. Realtor.com gives 29 days, and a median listing price of $1,299,900.
A seller who reads one page sees a market that is up 13.6%. A seller who reads the other might think prices have jumped by nearly 60%. This brief reads the pages together with the Census profile of the postal area that includes Birmingham and the Realtor.com series for the Detroit area, asks what can and cannot be said, and sets out what a private sale changes.
Key Findings
- Redfin reported a Birmingham median sale price of about $1.1 million for the three months to August 2026 (up 13.6%), $332 per square foot (down 10.0%), 25 days on market against 21 a year earlier and 125 homes sold in August against 139, and called the market somewhat competitive (Redfin, Birmingham).
- Realtor.com reported a median listing price of $1,299,900 (down 12.7%), a median sold price of $956,000 (up 59.47%), $498 per square foot, 148 active listings (up 31.3%), 29 days on market and a median rent of $2,950 a month (Realtor.com, Birmingham). The page does not state the period its figures cover.
- In the Census postal area, 7,285 of 10,351 housing units (70.4%) were built before 1980, owners occupy 7,287 of 9,449 occupied homes (77.1%) and median household income is $153,401 (U.S. Census Bureau, 2020-2024).
- In the Detroit-Warren-Dearborn area the number of active listings rose from 8,162 in March 2026 to 10,694 in July, and listings with a price reduction rose from 2,386 to 4,446 (Realtor.com, active listings; Realtor.com, price reduced listings).
- The Detroit area median days on market was 39 in July 2026 and 45 in March (Realtor.com, days on market).
Can a median rise 13.6 percent on one page and 59 percent on another?
It can if the pages measure different things, and it cannot if they measure the same thing. Start with the arithmetic. If a median of about $1.1 million is up 13.6%, the median a year earlier was about $968,000. If a median of $956,000 is up 59.47%, the median a year earlier was about $600,000. A city does not move from $600,000 to $956,000 in a year without something unusual, such as a change in which homes are sold, and a city like Birmingham, with a stock of older houses on established streets, rarely changes that fast.
The two pages also differ in level. The Redfin median is about $144,000 above the Realtor.com median, which is about 15% of the lower figure. That could be a difference of period. Redfin states three months to August 2026. Realtor.com gives no period. It could also be a difference of method, since one may count all sales and the other only some, or one may use a different date for a sale.
A small market adds noise. Redfin reports 125 homes sold in August, down from 139. A median taken from 125 sales, or from the sales of one quarter, can swing when a handful of high-priced homes close in one month. A gain of 59% from a smaller base of sales is more likely to be a statistical event than a change in what a home is worth.
The honest reading is that Birmingham is an expensive market in which a typical sale is near or above $1 million, and that the size of the recent change is not settled by these two pages. I do not pick one. A seller who needs a number should look at recent sales of comparable homes on the same and nearby streets.
| Measure | Redfin | Realtor.com |
|---|---|---|
| Median sale price | About $1.1 million (up 13.6%) | $956,000 (up 59.47%) |
| Price per square foot | $332 (down 10.0%) | $498 (up 2.68%) |
| Days on market | 25 (21 a year earlier) | 29 |
| Homes sold or active | 125 sold in August (139 a year earlier) | 148 active (up 31.3%) |
| Median listing price | Not stated | $1,299,900 (down 12.7%) |
Sources: Redfin and Realtor.com pages as cited. The $968,000, $600,000, $144,000 and 15% figures are this brief's arithmetic from the published changes. Commercial content; not independently verified.
Is the price per square foot $332 or $498?
The two figures differ by $166, which makes the higher one 50% above the lower. They also move in opposite directions: down 10.0% on Redfin and up 2.68% on Realtor.com. A price per square foot divides a price by the size of the home, so it can differ when the pages count size differently, when they use sold price or asking price, or when they take different sets of homes.
A price per foot is a useful guide only for similar homes. In an older city, the figure can shift when large houses sell, because large houses often sell for fewer dollars per foot than small ones. A median price near $1 million with $332 a foot implies about 3,300 square feet for a typical sale. With $498 a foot and $956,000, it implies about 1,900. Either may be right for the homes in the sample, and the two are not the same sample.
The Redfin figure fell while the price rose, which fits a market where buyers paid more in total for larger homes. The Realtor.com figure rose a little, which fits a steadier market. The two stories do not agree, and a seller who reads a price per foot for a single home will do best to compare it with sales of homes of the same size, age and condition.
The larger point is that a figure with a plausible look can still be unsuited to the question. A price per foot is useful for comparing two homes and weak for describing a city.
There is one more reason to be careful with a headline gain, which is who reads it. A buyer who sees a page that says prices rose 59% may bid fast, and a buyer who sees one that says the price per foot fell 10% may bid low. Each reader carries a number into the negotiation that may not describe the home in front of them. A seller who knows where the numbers come from can answer both, and a seller who does not may accept a lower offer because a page said so.
Sources: Redfin and Realtor.com pages as cited. The 50% difference and the implied sizes of about 3,300 and 1,900 square feet are this brief's arithmetic ($1.1 million divided by $332 and $956,000 divided by $498). Commercial content; not independently verified.
What does the Census say about Birmingham homes?
The Census profile describes the postal area that includes Birmingham. It counts 21,772 people and 10,351 housing units, of which 9,449 are occupied and 902 are vacant, a vacancy rate of 8.7%. Owners live in 7,287 homes (77.1% of those occupied) and renters in 2,162 (22.9%). Median household income is $153,401 and median gross rent is $1,902 a month.
Owners estimate the median home at $697,900, with a margin of error of $40,453, or 5.8%. That is about 37% below the $1.1 million median sale price on the first page and 27% below the $956,000 on the second. Owners who have lived in their homes a long time may not know what the market would pay, and the Census figure is an average over five years of survey responses, so it trails the market.
The homes are old. The median year built is 1960. The largest group, 2,477 homes (23.9%), was built in the 1950s. Another 1,640 (15.8%) date from 1939 or earlier, and 1,087 (10.5%) from the 1940s. In all, 7,285 homes, 70.4%, were built before 1980. Only 784 homes, 7.6%, were built since 2010.
Age matters to a seller for a practical reason. Older houses are the ones that most often need new roofs, wiring, plumbing, windows and heating, and they are the ones about which buyers' inspectors write the longest reports. Even a house that sells for $1 million can have a list of repairs, and the repairs are a point of negotiation.
| Indicator | Value | Note |
|---|---|---|
| Population | 21,772 | Whole postal area |
| Housing units | 10,351 | All units |
| Vacant units | 902 | 8.7% of all units |
| Owner-occupied homes | 7,287 | 77.1% of occupied |
| Median household income | $153,401 | Estimate |
| Median gross rent | $1,902 | Per month |
| Owner-estimated median value | $697,900 | Margin of error $40,453 |
| Median year built | 1960 | Estimate |
Source: U.S. Census Bureau, American Community Survey 2020-2024 five-year estimates. The percentage gaps are this brief's arithmetic.
What would it mean if the 59 percent were real?
Suppose the Realtor.com figure is right and the median sold price rose from about $600,000 to $956,000 in a year. That would be a rise of $356,000, or about $30,000 a month. It would be one of the sharpest moves in any market in this series, and it would show up in a flood of new listings from owners who wanted to sell into the surge. The same page reports 148 active listings, which is more than a year ago, but a rise of 31% is a long way from a rush.
Suppose instead that the figure is the product of a small sample. Then the page's median is correct for the homes it counted and tells us little about the market. A listing page may count only the sales that were reported to it, and in a city of this size, a change in which sales were counted could move the median by tens of thousands of dollars.
A third possibility is that the percentage was computed against a figure for a different area or a different period, so the number is right for neither. I cannot tell which of the three applies. What I can say is that the Redfin page, which states its period and reports a change of 13.6%, is the more specific of the two, and that the Realtor.com page supplies a level but not a reliable change.
For a seller, this means that the number to ignore is the gain. A gain that large would be a reason to rush to list. A gain that small, 13.6%, is a reason to look at what it rests on. Neither tells an owner what a given home would sell for next month.
Sources: Redfin and Realtor.com pages as cited. The $356,000 and $30,000 figures are this brief's arithmetic. The three explanations are this brief's reasoning and not findings. Commercial content; not independently verified.
What does the Detroit series say, and what does it not say?
Realtor.com's series for the Detroit-Warren-Dearborn area, published by the Federal Reserve Bank of St. Louis, covers a region with millions of residents. It is not Birmingham. The median listing price in that area was $275,000 in August 2026, which is about a fifth of Birmingham's listing price on the Realtor.com city page. That gap is itself the point: a metropolitan figure says very little about a city whose homes cost several times the regional median.
What the series can show is direction. Active listings rose from 8,162 in March to 8,606 in April, 9,404 in May, 10,126 in June and 10,694 in July, a rise of 31% in four months. New listings climbed from 5,044 in March to 6,686 in July (Realtor.com, new listings). The median days on market, though, stayed in a narrow band, 45 in March and 38 to 39 from April to July.
Listings with a price reduction nearly doubled, from 2,386 in March to 4,446 in July, a rise of 86%. In July, 4,446 of 10,694 active listings carried a reduction, about 42%, if the two series count the same homes, which they are not promised to do. The median listing price meanwhile rose from $248,900 in April to $275,000 in June, July and August (Realtor.com, median listing price).
A region in which supply is rising, many listings are being cut and the typical wait is steady is a region in which buyers have more choice and sellers must price carefully. Birmingham's own figures are not in this series. The Realtor.com city page shows 148 active listings up 31.3%, which is the same direction as the region, and the Redfin figure of 25 days against 21 is also in the direction of a slower market. Both fit, and neither proves it.
Sources: Realtor.com series on FRED as cited. The 31%, 86%, 42% and one-fifth figures are this brief's arithmetic. Commercial content; not independently verified.
Does a high price mean a home needs no preparation?
The two pages describe a market near or above $1 million, and a seller might conclude that a home at that price sells itself. The Redfin report of 25 days on market, up four, and the Realtor.com report of 148 active listings, up 31.3%, suggest otherwise. Buyers at this price level can compare many homes and wait for the right one.
Buyers at this price level also hire inspectors. In a postal area where 70.4% of homes were built before 1980, the inspector's list is long. A roof near the end of its life, an old electrical panel, a boiler or furnace of an earlier decade and windows that are not sealed are the common items. Each becomes a request for a credit or a repair.
The seller's choices are to repair before listing, to credit at the inspection or to sell to a buyer who takes the home as it is. The first costs money and time before any offer. The second hands the buyer a lever in the negotiation. The third is a feature of a private sale.
None of the sources used here measures the cost of repairs in Birmingham and I do not estimate it. The point is only that the headline price tells a seller what a well-prepared home might fetch and says nothing about what preparing it costs.
Sources: Redfin, Realtor.com and U.S. Census Bureau as cited. The reasoning about inspections is this brief's and not a measured finding. Commercial content; not independently verified.
What does a median rent of $2,950 say about holding a home?
Realtor.com reports a median rent of $2,950 a month, down 10.61% on the year, from 127 rental properties. At $2,950 a month, rent is $35,400 a year. The Census figure for the postal area is lower, $1,902 a month, or $22,824 a year. The gap is 55%, and it reflects the fact that the Census figure counts all renters, including those in older and smaller units, while the page describes rentals on the market.
The rent is useful for one comparison. An owner who is thinking of renting out a home instead of selling it should know that the rent is falling on the page's figures and that listings are rising. A landlord must carry the home, find a tenant, fix what breaks and wait through vacancies. The sources here do not give vacancy for rentals or the cost of repairs, and I do not estimate them.
An owner who wants out of the home entirely has a simpler path. A direct sale ends the carrying costs, the need to find a tenant and the risk of repairs. It does so at a price the owner agrees to at the start.
Where the buyer pays no commission and the seller owes none, a seller can compare the net from a private sale with the net after fees and repairs from a public sale. That comparison, more than any median, is what an owner needs. Readers comparing markets can also read the Bloomfield Hills brief and the Bloomfield Hills brief.
Sources: Realtor.com page and U.S. Census Bureau as cited. The $35,400, $22,824 and 55% figures are this brief's arithmetic. Commercial content; not independently verified.
What does a private sale change in a city like this?
Privacy matters most at this level. A listing in a city with a small number of homes for sale puts the address, the photographs and the asking price in front of neighbors and anyone watching the market. A seller who prefers that neighbors not talk about the sale gets that from a private sale, with no showings and no listing.
A flexible closing date matters to an owner who is buying elsewhere. A buyer's loan has its own calendar, and a long wait to sell and then a long wait to close can leave an owner holding two homes. A private sale can be set to the seller's date.
No commission and no closing costs are the largest savings. On a home at $1 million, each 1% is $10,000. At a median of $956,000 it is $9,560. I do not state a rate, since none of the sources used here gives one, but the saving is the whole of whatever the rate would have been.
Avoiding inspections and repairs is the last. A buyer who purchases as is does not send an inspector to write a list, and the seller does not credit the buyer or fix the roof before closing.
A public listing may still be right for an owner who wants to test the market and who is willing to prepare the home. The record above does not say which of the two prices is right, which is a reason to compare the offer of a direct buyer with what a listing is likely to produce.
Finally, a seller should write down what matters most before reading any offer: the price, the date, the privacy or the lack of repairs. In a market where two public pages cannot agree on the median, the offers a seller receives will differ more than the pages do, and the seller's own priorities are the steadier guide. Ask each buyer for the terms in writing, including who pays what at closing and whether the offer depends on an inspection or a loan, and compare the offers on those terms and not on the headline price alone.
Sources: Redfin and Realtor.com figures as cited. The $10,000 and $9,560 figures are this brief's arithmetic for 1% of $1 million and of $956,000.
Methodology and limitations
Prices, price per square foot, days on market, sales counts, listing counts and rents for Birmingham come from two commercial pages, a national brokerage site and a national listing site. The first states a period and the second does not. They were not independently verified.
Age, tenure, vacancy, income, rent and owner-estimated value come from the American Community Survey 2020-2024 five-year estimates for the postal-code area that includes Birmingham. Shares are calculated from published counts, and owner-estimated value carries a margin of error.
Days on market, active and new listings, median listing price and price reduced counts are Realtor.com series published by the Federal Reserve Bank of St. Louis for the Detroit-Warren-Dearborn metropolitan area. They describe the region and not the city. The brief makes no forecast and values no home.
Conclusion
The Birmingham record shows two pages that disagree on the price, the change and the price per foot, a regional market in which supply and price cuts have grown, and a stock of homes in which 70.4% predate 1980.
It does not fix a price for any one home. The choice between a public listing and a private sale comes down to whether an owner would rather compete in that market or take privacy, a flexible closing date, no commission, no closing costs and no inspections or repairs. To see what a direct offer would look like for your home, use the contact form on this page.
Frequently Asked Questions
What is the median home price in Birmingham, Michigan?
Redfin reports about $1.1 million for three months to August 2026, up 13.6%. Realtor.com reports a median sold price of $956,000, with no period stated.
Why do the two sites disagree?
They may use different periods, different sets of sales and different methods. Neither page explains the gap.
How long do Birmingham homes take to sell?
Redfin reports 25 days against 21 a year earlier, and Realtor.com reports 29.
Does the Detroit data describe Birmingham?
No. It covers a large region whose median listing price is far lower, and it shows direction only.
Does a private sale always beat a public listing?
No. A public listing can attract competing bids. A private sale offers privacy, a flexible closing date, no commission, no closing costs and no inspections or repairs.
Compare your options before committing. Request a written private offer for your property, with no obligation, then weigh it against your listing plan.
Sources
- Redfin, 2026. Birmingham, MI Housing Market. https://www.redfin.com/city/2248/MI/Birmingham/housing-market.
- Realtor.com, 2026. Birmingham, MI Housing Market and Rental Trends. https://www.realtor.com/local/market/michigan/oakland-county/birmingham.
- U.S. Census Bureau, 2026. American Community Survey 2020-2024 five-year estimates, the Birmingham area (via Census Reporter). https://censusreporter.org/profiles/86000US48009-48009/.
- Realtor.com, 2026. Housing Inventory: Active Listing Count in Detroit-Warren-Dearborn, MI (CBSA). https://fred.stlouisfed.org/series/ACTLISCOU19820.
- Realtor.com, 2026. Housing Inventory: Price Reduced Count in Detroit-Warren-Dearborn, MI (CBSA). https://fred.stlouisfed.org/series/PRIREDCOU19820.
- Realtor.com, 2026. Housing Inventory: Median Days on Market in Detroit-Warren-Dearborn, MI (CBSA). https://fred.stlouisfed.org/series/MEDDAYONMAR19820.
- Realtor.com, 2026. Housing Inventory: New Listing Count in Detroit-Warren-Dearborn, MI (CBSA). https://fred.stlouisfed.org/series/NEWLISCOU19820.
- Realtor.com, 2026. Housing Inventory: Median Listing Price in Detroit-Warren-Dearborn, MI (CBSA). https://fred.stlouisfed.org/series/MEDLISPRI19820.
Related research

Seller Guide · October 6, 2026
How to Prepare Point Pleasant Beach Rental Records Before Selling
Separate rental approval, income history and booked stays before comparing sale terms.

Seller Guide · October 6, 2026
How to Prepare Rumson Flood and Waterfront Records Before Selling
Separate flood disclosure, elevation, repairs and waterfront rights before comparing sale terms.

Seller Guide · October 6, 2026
How to Prepare Sarasota Condo Inspection and Reserve Records Before Selling
Separate building condition, reserve funding and resale documents before comparing sale terms.