Market Brief · by Aidan Sowa · October 5, 2026
Which Bellaire Median Should a Seller Trust When the Pages Disagree? Reading the Sold Prices, the Houses and the Waits
Reading the Sold Prices, the Houses and the Waits for Bellaire, TX, with each source dated and its limits noted, for owners weighing a listing against a direct sale.
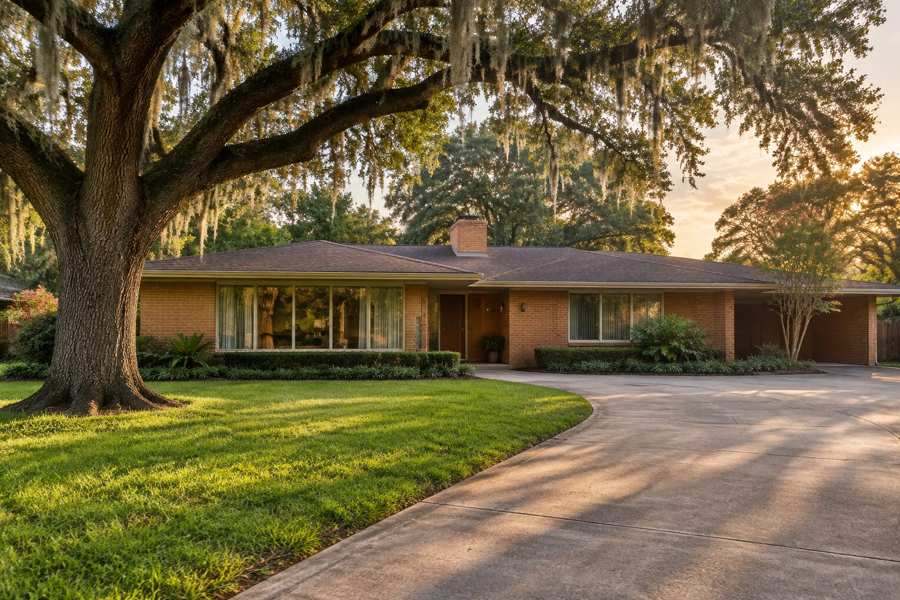
Which Bellaire median should a seller trust when the pages disagree? Redfin's page for the postal area that includes Bellaire, with a three-month window ending August 2026, shows a median sale price of $1,289,442. Realtor.com's page for the same area, with key indicators as of September 2026, shows a median sold price of $1,018,983 and a median listing price of $1,299,500. The Census median owner value is $1,036,800. The first figure is 26.5% above the second, taking Realtor.com's sold median as the base, and that is a wide gap for two pages about the same place.
The gap is partly a matter of what each page measures and partly a matter of timing, and it is not a puzzle that the pages solve. What the Census adds is a picture of the homes themselves. Of 6,648 housing units in the postal area, 5,989, or 90.1%, are detached houses. Of 6,089 occupied homes, 5,355, or 87.9%, are owned. It is a place of owner-occupied houses, and the middle of its market is a house.
For an owner, the useful point is that the price figures cannot all be right at once for the same home, and that no median describes a particular house. The sections below set out the price figures and why they differ, the houses and their ages, the wait on the market, the owners and their housing cost, and the questions worth asking before a listing or a direct sale.
Key Findings
- Redfin's page, whose window is the three months ending August 2026, shows a median sale price of $1,289,442, up 7.5% on the year, a median sale price per square foot of $331, down 5.4%, 52 homes sold in August, down 22.8% from 68, a median of 26 days on the market against 21, a sale-to-list ratio of 98.3%, up 0.9 points, 23.5% of homes sold above list, up 1.5 points, and a compete score of 73, very competitive (Redfin, Bellaire postal area).
- Realtor.com's page, with key indicators as of September 2026, shows a median listing price of $1,299,500, up 0.81% on the month and up 0.78% on the year, a median sold price of $1,018,983, down 1.06% and up 13.02%, $346 per square foot, 71 active listings, 38 median days on the market, up 24.24% and up 10.81%, 27 rental properties, down 10.81% and down 42.11%, and a median rent of $2,800, up 3.70% and up 12.45% (Realtor.com, Bellaire postal area).
- Only a city-level Zillow page was found for Bellaire, so no Zillow figure is used.
- The Census counts 6,648 housing units, 6,089 occupied, 5,355 by owners and 734 by renters, and 559 vacant. The median build year is 1996, the median owner value is $1,036,800, plus or minus $47,360, the median household income is $243,750, plus or minus $32,933, and the median gross rent is $2,672, plus or minus $901.
- The picture is a postal area of owner-occupied detached houses, mostly built since 1990, where homes take about one to two months to sell at a modest discount to list, and where the two price pages differ enough that the evidence for any one home has to come from comparable sales.
Why do the Bellaire price pages disagree, and what does each measure?
Four price figures are on the table. Redfin's median sale price is $1,289,442 for the three months ending August 2026. Realtor.com's median sold price is $1,018,983 and its median listing price is $1,299,500, both as of September 2026. The Census median owner value is $1,036,800, a five-year survey estimate with a margin of error of $47,360, or 4.6% of the value. Redfin's page is the oldest of the three sources, by one month.
Taking the Census value as the base, Realtor.com's sold median is 1.7% below it and Redfin's sale median is 24.4% above it. Redfin's median is 26.5% above Realtor.com's sold median, taking Realtor.com as the base. Realtor.com's listing median is 0.78% above Redfin's sale median, taking Redfin as the base. In other words, the listing median and Redfin's sale median nearly match, and Realtor.com's sold median stands apart.
Redfin's page covers the three months ending in August and gives a median of homes that sold in that window. Realtor.com's page shows a one-month sold median that moves with the mix of homes that closed. A month with a few sales of smaller or older houses can pull a median down, and a month with a few large sales can push it up. The Realtor.com sold median is up 13.02% on the year, which implies about $901,595 a year before, and down 1.06% on the month, which implies about $1,029,900.
Redfin's sale median is up 7.5% on the year, which implies about $1,199,481 a year before. Realtor.com's listing median is up 0.78% on the year, which implies about $1,289,442, and up 0.81% on the month, which implies about $1,289,059. So asking prices barely moved while Redfin's sale median rose, which is a pattern that a single set of pages cannot explain. The brief makes no claim about why.
Price per square foot shows a similar split. Redfin shows $331, down 5.4% on the year, which implies about $350 a year before, while Realtor.com shows $346 for listings, down 1.03% on the year, which implies about $350. The two figures differ in kind and in date. Both are lower than a year earlier, even though Redfin's median sale price is higher, which suggests the homes that sold were larger, though the pages do not say so and the brief treats that as an inference only.
A seller reading these figures should avoid a common trap. A median listing price is the middle of what owners are asking, and many listings never sell at that figure. A median sale price is the middle of what buyers paid, but only for the homes that closed in the period, and in a month with a small number of sales it can move a long way. Neither describes a particular house. The only evidence that does is the closed sales of houses with the same size, age, lot, condition and finish, and those are what a seller should ask to see before setting a price.
| Source | Figure | What it measures |
|---|---|---|
| Redfin | $1,289,442, up 7.5% | Median sale price, three months ending August 2026 (oldest page) |
| Realtor.com | $1,299,500, up 0.78% | Median listing price, September 2026 |
| Census Reporter | $1,036,800 | Median owner value, five-year estimate |
| Realtor.com | $1,018,983, up 13.02% | Median sold price, September 2026 |
Sources as cited. Earlier values and differences are computed from the published percentages.
What do the houses of Bellaire look like by type, size and age?
Detached houses dominate. Of 6,648 units, 5,989, or 90.1%, are detached houses and 438, or 6.6%, are attached houses. Buildings with two units hold 8, buildings with three or four units hold 8, buildings with five to nine units hold 91, ten to nineteen hold 6, twenty to forty-nine hold 28 and fifty or more hold 80. No mobile homes or boats are counted. Units in buildings of five or more total 205, or 3.1%.
The houses are large. Of 5,355 owner homes, 2,362 have four bedrooms and 1,156 have five or more, which makes 3,518, or 65.7%, with four or more. Another 1,330, or 24.8%, have three, 499 have two, and 8 have none. Renters live in smaller homes: of 734, 202 have five or more bedrooms, 61 have four, 192 have three, 172 have two, 67 have one and 40 have none.
The stock is newer than in many older neighborhoods. Of 6,648 units, 4,276, or 64.3%, were built in 1990 or later: 1,708 in the 1990s, 1,508 in the 2000s, 859 in the 2010s and 201 in 2020 or later. Homes built before 1980 total 1,850, or 27.8%, with 346 from the 1940s, 783 from the 1950s, 297 from the 1960s and 424 from the 1970s, and 522 were built in the 1980s. The median build year is 1996, and none are counted from before 1940.
Vacancy is modest. Of the 559 vacant units, 111 are for rent, 137 are for sale only, 77 are held for seasonal, recreational or occasional use and 234 are vacant for other reasons. Vacant units are 8.4% of all units. The group labeled other is the largest and the Census does not say why those units are empty, so the brief draws no conclusion from it.
A seller of a house in this kind of stock should expect buyers to compare homes closely by size, age, lot and finish. The Census cannot show condition, lot size or any recent renovation, and the brief makes no claim about any one house. An owner should ask what comparable houses of the same size and decade sold for, and how long each one took.
Because most owner homes have four or more bedrooms, the typical house here is large, and size is likely to be one of the first things a buyer compares. A house with four bedrooms and one with five or more can sit far apart in price even on neighboring streets. The Census table gives counts of bedrooms and not floor area, so it cannot show how large each house is. The sale pages give a price per square foot, but only as a median across all homes, and it should not be applied to one house without comparable sales.
Sources as cited. Shares are computed from the Census counts.
How fast do Bellaire homes sell, and what do sellers get against asking?
About one to two months. Redfin shows a median of 26 days on the market for the three months ending August 2026, against 21 a year before, and a compete score of 73, very competitive, with the average home selling about 2% below list and going pending in about 33 days. Realtor.com shows a median of 38 days for September 2026, up 24.24% on the month, which implies about 31 days a month before, and up 10.81% on the year, which implies about 34 days a year before.
The two pages measure differently and fall in different months, so the gap between 26 and 38 days is not a trend. Redfin's figure covers homes that sold in a three-month window, and Realtor.com's covers listings in a single month. Redfin's page also shows the change in days on market as 6 days, while its own figures of 26 and 21 differ by 5, and that is flagged.
Sales settle a little below list on Redfin's page. It shows a sale-to-list ratio of 98.3%, up 0.9 points, with 23.5% of homes sold above list, up 1.5 points, and 28.9% of homes with price drops, up 3.1 points. It says hot homes sell about 1% above list and go pending in about 8 days. Realtor.com's page says homes sold for 13.54% below asking with a sale-to-list ratio of 86%, which conflicts sharply with Redfin's 98.3% and is flagged. The brief reports the Redfin figure and does not use the Realtor.com one.
Supply is slightly lower. Realtor.com shows 71 active listings, down 3.53% on the year, which implies about 74 a year before, and down 7.87% on the month, which implies about 77 a month before. Against 6,089 occupied homes, 71 listings equal 1.2%. Redfin shows 52 homes sold in August 2026, down 22.8% from 68 a year before, so fewer homes changed hands.
A market where a typical sale takes a month or two and closes a little under list, with price drops on 28.9% of homes on Redfin's page, is a market where pricing matters. It does not mean every home sells slowly or quickly, and the sources show medians and not the spread. A seller who wants certainty of date can choose a direct sale, which sets the closing date at the owner's choice. The brief does not claim a direct sale brings more.
The spread around the median matters as much as the median. Some homes sell in days, while others sit for months and then cut their price. The pages report medians and not the spread, so a seller with a fixed date cannot read the risk of a long wait from them. A better guide is the days on market of houses of the same kind sold in the last year, which an owner can ask for and compare with the page figures here. Fewer homes sold in August than a year earlier, which also means fewer recent sales to compare.
Sources as cited. Earlier values are computed from the published percentages.
Who owns the homes in Bellaire, and how heavy is housing cost?
The population is 17,213, with a margin of error of 63. Of those, 4,619 are under 18, 26.8%, 914 are 18 to 24, 5.3%, 1,063 are 25 to 34, 6.2%, 2,383 are 35 to 44, 13.8%, 5,041 are 45 to 64, 29.3%, and 3,193 are 65 or older, 18.5%. Children under 18 are more than a quarter of residents, a high share compared with the 25 to 34 group, which is small.
Of 6,089 occupied homes, 5,355, or 87.9%, are owned and 734, or 12.1%, are rented. Owners arrived over a long span: 235 in 2023 or later, 640 in 2020 to 2022, 2,083 in the 2010s, 1,166 in the 2000s, 891 in the 1990s and 340 before 1990. That puts 23.0% of owners in place since before 2000 and 16.3% arriving in 2020 or later.
Renters are a small group, and their figures are less reliable, since the sample is small and the margins wide. Of 734 renter homes, 46 were taken up in 2023 or later, 185 in 2020 to 2022, 336 in the 2010s, 147 in the 2000s, 9 in the 1990s and 11 before 1990. Of 734, 77 have no computed rent share, and of the remaining 657, 341, or 51.9%, pay 30% or more of income on rent and 229, or 34.9%, pay half or more.
Owner costs are lighter. Among owners with a mortgage, 2,837 homes, 14 have no computed share, and of the remaining 2,823, 1,044, or 37.0%, pay 30% or more of income on owner costs and 428, or 15.2%, pay half or more. Of 2,518 owners without a mortgage, 2,512 have a computed share, and 363, or 14.5%, pay 30% or more, with 165, or 6.6%, paying half or more. Taxes and upkeep still weigh on owners with no mortgage.
The median household income is $243,750, with a margin of error of $32,933, or 13.5% of the value. The median gross rent is $2,672, with a margin of $901, a wide margin because few homes are rented. Realtor.com's median asking rent is $2,800, up 12.45% on the year, which implies about $2,490 a year before, and up 3.70% on the month, which implies about $2,700. Realtor.com shows 27 rentals, down 42.11% on the year, which implies about 47 a year before. A median of so few rentals moves a lot and is a weak guide.
The renter figures deserve care. Only a small number of homes are rented, so a few leases can move the median rent and the cost burden shares by a large amount, and the Census margin of error on gross rent is wide. The owner figures rest on thousands of homes and are steadier. A reader should therefore lean on the owner counts for a view of the neighborhood and treat the rental figures as a rough indication only, with no claim about any one landlord or tenant. Readers comparing markets can also read the Galleria and Tanglewood brief and the Memorial Villages brief.
Sources as cited. Shares and ratios are computed from the Census counts.
What should a Bellaire owner ask before choosing a listing or a private sale?
A seller should keep four questions apart. What do closed sales of houses of the same size, age and finish show, given that the pages disagree by a wide margin? How long might a listing take, with a median of about one to two months and sales a little under list? What would inspections and repairs cost on a house of this kind? And what date does the owner need to close? The first question is about price, the second about time, the third about cost and the fourth about the next home.
For illustration only, a total commission of 1%, 3% or 5% on a sale of $450,000 would be $4,500, $13,500 or $22,500. On $725,000 it would be $7,250, $21,750 or $36,250, and on $1,200,000 it would be $12,000, $36,000 or $60,000. At the Census median owner value of $1,036,800, the same percentages come to $10,368, $31,104 and $51,840. These are arithmetic and not quoted rates, since commissions are negotiated.
The five benefits of a private sale to Maison Off-Market are privacy, because there are no showings and no neighbors talking about the sale, closing dates that can be flexible and give time to find a new home, no commission costs, no closing costs and no inspections or repairs. In a neighborhood of owner-occupied houses, where neighbors know one another, privacy may matter a great deal. The brief does not claim a private sale always beats a listing.
Maison Off-Market buys luxury homes and estates directly from their owners and speaks only to sellers. An owner who wants to see what a direct purchase would look like, with no public listing and no showings, can use the contact form below and ask for an offer before deciding.
Sources as cited. Fee figures are arithmetic and not quoted rates.
Methodology and limitations
Each page's date, title and place were read before use. The Redfin page's window is the three months ending August 2026 and the Realtor.com page has key indicators as of September 2026, so the Redfin page is the oldest source and is used with that flag. The Realtor.com sold median of $1,018,983 differs from Redfin's sale median by a wide margin and is reported with that flag. The Realtor.com sale-to-list ratio of 86% and its statement that homes sold 13.54% below asking conflict with Redfin's 98.3% and are not used. The Realtor.com text that calls the area a buyer's market is not used. Redfin states the change in days on market as 6 days while its own figures of 26 and 21 differ by 5. Realtor.com's neighborhood tables for sale and rent counts are not used. Only a city-level Zillow page was found, so no Zillow figure is used. The Census figures are five-year survey estimates with margins of error, and the renter and rent figures rest on a small number of homes with wide margins. Earlier values are computed from published percentages and are approximate. No figure here is a forecast.
Conclusion
The record for Bellaire, as far as the pages allow, is a postal area of owner-occupied detached houses, most of them built since 1990 with four or more bedrooms, where the Census value sits between two price pages that differ widely, where homes take about one to two months to sell at a small discount to list, and where few homes are rented. For an owner, the practical step is to ask for the closed sales of houses of the same size and age, compare the cost and risk of a listing with a direct offer, and decide how much of the showing, inspection and timing risk to carry.
Frequently Asked Questions
What is the median home price in Bellaire?
The sources differ. Redfin showed a median sale price of $1,289,442 for the three months ending August 2026, Realtor.com showed a median sold price of $1,018,983 and a median listing price of $1,299,500 for September 2026, and the Census median owner value is $1,036,800.
How long do Bellaire homes take to sell?
Redfin showed a median of 26 days on the market for the three months ending August 2026, and Realtor.com showed 38 days for September 2026.
Do Bellaire homes sell above asking?
Some do. Redfin showed 23.5% of homes sold above list and a sale-to-list ratio of 98.3%.
How many Bellaire homes are owner-occupied?
The Census counts 5,355 of 6,089 occupied homes in the postal area, 87.9%, as owned.
Can I sell my Bellaire home privately?
Yes. Maison Off-Market buys luxury homes and estates directly from their owners with no showings, flexible closing dates, no commission costs, no closing costs and no inspections or repairs. It does not say a private sale always beats a listing.
Compare your options before committing. Request a written private offer for your property, with no obligation, then weigh it against your listing plan.
Sources
- Redfin, postal area housing market, 2026. Housing Market Trends. https://www.redfin.com/zipcode/77401/housing-market.
- Realtor.com, postal area housing market, 2026. Housing Market Data. https://www.realtor.com/local/market/texas/zipcode-77401.
Related research

Seller Guide · October 6, 2026
How to Prepare Point Pleasant Beach Rental Records Before Selling
Separate rental approval, income history and booked stays before comparing sale terms.

Seller Guide · October 6, 2026
How to Prepare Rumson Flood and Waterfront Records Before Selling
Separate flood disclosure, elevation, repairs and waterfront rights before comparing sale terms.

Seller Guide · October 6, 2026
How to Prepare Sarasota Condo Inspection and Reserve Records Before Selling
Separate building condition, reserve funding and resale documents before comparing sale terms.