Market Brief · by Aidan Sowa · October 5, 2026
Where Are the Johns Island Homes That Belong to No Neighborhood? Reading a Falling Sold Median and the Homes for Sale
Reading a Falling Sold Median and the Homes for Sale for Johns Island, SC, with each source dated and its limits noted, for owners weighing a listing against a direct sale.
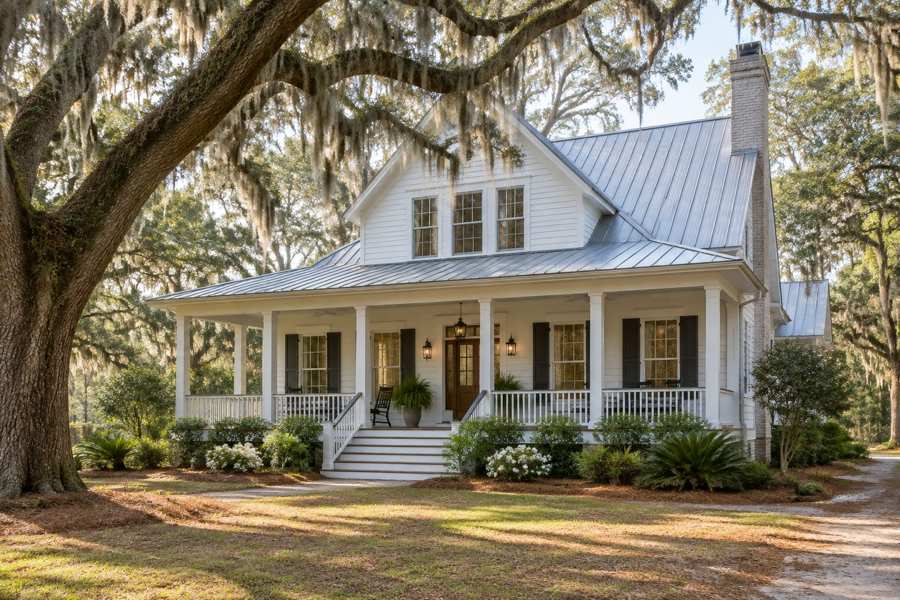
What did the typical Johns Island home sell for this year? Realtor.com puts the median sold price at $725,000 for June 2026, down 8.81% on the year and up 25.98% on three years. The same page puts the median listing price at $745,000, down 2.42% on the year. A home that sold for $20,000 less than the typical asking price, in a market that moved sideways on one clock and up on another, is a market an owner can read in more than one way.
The same page also counts 747 homes for sale on Johns Island. It then lists twelve neighborhoods, and the homes for sale in all twelve add up to 212. The other 535 homes, 71.6% of the total, belong to no neighborhood the table names. A seller who looks for the neighborhood in the table may find a number that says little about the street.
This brief reads that page with an older Redfin page, the Census profile of the area and the Realtor.com series for the Charleston metropolitan area. It asks what the figures say, where they conflict, which of them have gone stale and what a private sale changes for an owner who would rather not wait for the market to sort itself out.
Key Findings
- Realtor.com reported, as of June 2026, a median listing price of $745,000 (down 2.42% on the year and down 5.67% on three years), a median sold price of $725,000 (down 8.81% and up 25.98%), $338 per square foot (down 3.66% and down 16.26%), 747 active listings (up 1.88% and up 54.26%) and a median of 43 days on market (down 6.42% and up 37.84%). The table headers on that page read 1Y Change and 3Y Change (Realtor.com, Johns Island).
- The same Realtor.com page gave a sale-to-list ratio of 98%, with homes selling 1.88% below the asking price on average, and called the market balanced and warm. It counted 148 rentals (down 57.51% on the year) at a median rent of $2,155 a month (up 2.57%).
- The Redfin page for Johns Island showed a median sale price of $700,000 in January 2025, up 17.6% on the year, with 88 days on market against 53 and 159 homes sold against 168. Its own recently sold list stopped in February 2025, so that page is old (Redfin, Johns Island).
- In the Census postal area that includes Johns Island, 12,249 of 17,781 housing units are occupied, 5,532 (31.1%) are vacant, owners hold 10,804 of the occupied homes (88.2%), the median year built is 2001 and the owner-estimated median home value is $590,800 (U.S. Census Bureau, 2020-2024).
- In the Charleston-North Charleston area the median days on market rose from 44 in April 2026 to 58 in August (Realtor.com, days on market).
Is a sold median down 8.8 percent a falling market?
Not by itself. The Realtor.com median sold price of $725,000 is the middle sale of one month, and a month on an island with a mix of waterfront estates, newer subdivisions and older lots can swing by tens of thousands of dollars depending on which homes happen to close. A fall of 8.81% in a year would mean that the middle sale a year earlier was about $795,000, which is arithmetic from the stated change and not a figure from the page.
The same page shows the median listing price, which is the price of homes that have not sold, down only 2.42%. If values were dropping sharply, asking prices would usually follow them. Here the asking price fell about a quarter as much as the sold price. That gap suggests a change in the mix of homes that closed, a change in how much sellers gave up from their asking price, or both. The page does not separate them.
The three year change is just as telling in the other direction. A rise of 25.98% means that the middle sale three years ago was about $575,500. An owner who bought three years ago and looks only at the one year figure sees a decline. An owner who looks only at the three year figure sees a gain. Both are on the same page and both are true of the same series.
What an owner can take from this is a range and not a price. The typical sale was in the low to mid $700,000s in the most recent month the page reports, and the typical home was listed at about $745,000. A particular home on a particular lot with a dock, a view or a bad drainage ditch is outside what these pages can see.
| Indicator | Level | 1Y change | 3Y change |
|---|---|---|---|
| Median listing price | $745,000 | -2.42% | -5.67% |
| Median sold price | $725,000 | -8.81% | 25.98% |
| Price per square foot | $338 | -3.66% | -16.26% |
| Active listings | 747 | 1.88% | 54.26% |
| Median days on market | 43 | -6.42% | 37.84% |
| Rentals | 148 | -57.51% | 828% |
| Median rent | $2,155 a month | 2.57% | -29.92% |
Source: Realtor.com page as cited. The $795,000 and $575,500 figures are this brief's arithmetic from the stated changes. The explanation of the gap between the sold and listing medians is this brief's reasoning and not a statement of the page. Commercial content; not independently verified.
Where are the 535 homes that the neighborhood table cannot place?
The Realtor.com page counts 747 homes for sale on Johns Island. Its table by neighborhood lists twelve places. The largest row is headed Johns Island itself and shows 181 homes, up 21.11% on the year. After that come Headquarters Island, Oak Land and Sylvan Shores with seven each, Sylvan Shores East with five, five more places with one each, and two, Angel Oak Park and Riverland Crossing, with none. The twelve rows add up to 212.
The difference from the headline count is 535 homes, or 71.6%. The page does not explain it. The likeliest reason is that the table shows only listings assigned to a named subdivision in the data, and most listings carry a street address that has no subdivision attached. A second reason could be that the headline counts the broader island and the table does not. Either way, the number of homes for sale in a seller's own subdivision is not something this table can answer.
The growth rates in the table are worth a second look as well. Headquarters Island shows 500% on a count of seven, and Oak Land shows a fall of 52.94% on the same count. Percentages on counts this small are close to noise, and an owner should not read a trend into them.
For a seller, the practical point is simple. Competition is not measured by a table of neighborhood names. It is measured by the homes a buyer would actually compare with yours, which are the ones within a few streets and a similar size. A public listing puts a home among all of them. A private sale does not.
Source: Realtor.com page as cited. The 212, 535, 71.6% and 500% explanations are this brief's arithmetic and reasoning. Commercial content; not independently verified.
What do three neighborhood prices say about the island?
The same page gives a median listing price for three neighborhoods. Johns Island as a whole is $750,000 at $333 per square foot with a median rent of $2,139 a month. Oak Land is $457,500 at $277 per foot. Sylvan Shores is $267,450 at $256 per foot. Nothing in the page labels what kind of home sits in each, but the spread tells a seller that the island is not one price.
The gap between the top and the bottom is $482,550. The difference in price per foot is much smaller, $333 against $256, or $77. That pattern, a big difference in the price and a small difference in the price per foot, usually points to the size of the homes and the lots. A smaller home on a smaller lot costs less in total, though not proportionally less per foot of floor space.
The days on market tell a mixed story. Johns Island as a whole shows 39 days, down 12.36% on the year. Oak Land and Sylvan Shores both show 59 days, and Oak Land is up 126.92% on the year. A home in the cheaper areas waited about 20 days longer than the island row, and that is a month of taxes, insurance and upkeep that the seller carries.
| Area | Median listing price | Price per sq ft | Days on market |
|---|---|---|---|
| Johns Island | $750,000 | $333 | 39 |
| Oak Land | $457,500 | $277 | 59 |
| Sylvan Shores | $267,450 | $256 | 59 |
Source: Realtor.com page as cited. The $482,550, $77, 20 day and 3.3% comparisons are this brief's arithmetic. Commercial content; not independently verified.
Why does a 2025 Redfin page still sit beside a 2026 one?
The Redfin page for Johns Island is a good example of a source that looks current and is not. Its text says that the median sale price was $700,000 in January 2025, up 17.6% on the year, that homes sold after 88 days against 53 and that 159 homes sold against 168. Its list of recent sales ends in February 2025. An owner who searches for Johns Island home values may well land on it.
Set beside the Realtor.com figure of $725,000 for June 2026, the Redfin figure is $25,000 lower, or 3.6%. The two pages cover different months, about seventeen months apart, and may define the area differently, so the comparison proves very little. It does show that the typical sale has not collapsed. It also shows that a number from a page without a clear date is a number to treat with care.
Redfin's page also called the market somewhat competitive, with homes going pending in about 77 days and selling about 2% below list. Realtor.com's newer page calls the market balanced and warm, with 43 days and a sale-to-list ratio of 98%, which is the same 2% below. The discount has held. The wait is the part that moved, and the two pages measure it differently: one counts days to pending and the other counts days on market.
Source: Redfin and Realtor.com pages as cited. The $25,000 and 3.6% figures and the seventeen month gap are this brief's arithmetic. Commercial content; not independently verified.
Does a 31 percent vacancy rate mean the island is empty?
In the Census postal area that includes Johns Island, 5,532 of the 17,781 housing units are vacant. That is 31.1%, a share much higher than most places. Owners live in 10,804 of the 12,249 occupied homes, which is 88.2%, and renters in 1,445, or 11.8%. The population is 27,576, which is about 2.25 people in each occupied home.
The table used here counts a home as vacant if no one lives in it at the time of the survey. That covers homes for rent, homes for sale, homes held for seasonal or occasional use and homes under construction. The data in this brief do not give the split, so it would be wrong to say how many of the 5,532 are second homes. The ownership pattern, with nearly nine in ten occupied homes owner occupied, fits a place with many houses and few apartments.
A seller can read the rate in two ways. A high share of vacant homes can mean that owners are away for part of the year and that a sale can be done without a household moving out. It can also mean that new homes are still being built and have not yet been lived in, and the age table below suggests that happened here: more than half of the housing stock was built in 2000 or later.
Rents show another side. The Census gross rent median for the area is $1,567 a month, and Realtor.com's median asking rent is $2,155, $588 or 37.5% higher. The surveys measure what current tenants pay, many of them under older leases, and the listing page measures what landlords ask for new tenants. A rise from the first number to the second is normal and does not by itself say that rents are rising.
Source: U.S. Census Bureau, American Community Survey 2020-2024, and Realtor.com as cited. Shares and gaps are this brief's arithmetic. The reasons for vacancy are not given in the table used.
What does a housing stock built mostly after 1999 mean for a seller?
The Census count by decade shows 9,416 homes, 53.0% of the total, built in 2000 or later: 3,925 in the 2000s, 4,220 in the 2010s and 1,271 since 2020. Only 3,373 homes, 19.0%, date from before 1980, and the median year built is 2001. This is a young stock, even though the island itself is old.
For an owner, age cuts two ways. Newer homes tend to have fewer hidden problems, and a buyer's inspector will usually find less to complain about. But in a place where so much was built in two decades, many homes are close in size and style and a buyer can compare dozens of them. A home that stands out on a list needs a reason to.
For the 3,373 older homes, the reverse holds. An older home on the island may be on a larger lot and may have mature trees, but it is also the one whose inspection is likelier to produce a list of repairs. Avoiding inspections and repairs is one of the five benefits of selling off the market, and it matters most for exactly these homes.
The owner-estimated median value in the Census is $590,800, with a margin of error of $37,078. The sold median on Realtor.com is $725,000, which is $134,200 or 22.7% above the Census figure. The Census value is what owners think their homes are worth, averaged over 2020 to 2024. The sold median is what homes fetched in one recent month. A gap of that kind is usual when prices rose over the period.
Source: U.S. Census Bureau, American Community Survey 2020-2024, and Realtor.com as cited. Shares and gaps are this brief's arithmetic.
What does the Charleston series add?
The island figures end at June 2026. The Charleston-North Charleston series run later and describe the whole region, so they show where the metropolitan market was heading after the island page was written. They are not Johns Island figures.
The median days on market in the region was 44 in April 2026, 45 in May, 51 in June, 57 in July and 58 in August. That is a rise of 14 days in four months, or 31.8%. If the island followed the region, its June 43 days would have moved up since. The page for the island does not say so, and that is an inference only.
Active listings across the region were 4,188 in May and 4,224 in September 2026 (Realtor.com, active listings), a rise of 36, or 0.9%. New listings fell from 1,976 in May to 1,520 in August (Realtor.com, new listings). The pace of new listings fell by 23.1% while the stock of unsold homes stayed level, which means homes were staying on the market.
The regional median listing price slipped from $499,300 in May to $479,450 in September (Realtor.com, median listing price), a fall of 4.0%. The island median of $745,000 is $265,550, or 55.4%, above the September regional figure, though the months differ. Price reductions were 1,946 in September, 46.1% of the regional active listings (Realtor.com, price reduced listings), compared with 1,876 in May or 44.8%.
Taken together, the series say that the Charleston market slowed over the summer, with longer waits, fewer new listings and more of the unsold homes carrying a price cut. For an island owner, that is a reason to ask what the next ninety days of waiting would cost.
Source: Realtor.com series published by the Federal Reserve Bank of St. Louis as cited. The 14 day, 31.8%, 0.9%, 23.1%, 4.0%, 55.4%, 46.1% and 44.8% figures are this brief's arithmetic. The inference about the island is this brief's and is not a figure from any page.
What should an owner ask before accepting any offer?
Whether an offer is public or private, an owner can compare it with a short list of questions. What is the price, and is any part of it contingent on an inspection, a loan or the sale of another home? What will I receive at closing after every charge? On what date will the sale close, and can the date move? Who pays for any repair a buyer asks for? What is the buyer's evidence that the money is there?
On a low island there are a few more. Is the home in a flood zone, and will the buyer's insurance quote change the deal? Are the dock, the boat lift or any shared easement included and in writing? Who handles the utilities and the dues until closing? A sale that falls apart after a flood insurance quote costs the seller weeks, and a written answer in advance can save them.
The comparison should include the cost of waiting. At a 43 day median, a home carries taxes, insurance and upkeep for six weeks before an offer is even accepted, and more before the sale closes. A fixed date and a known price remove the uncertainty, and some owners value that as much as the price. Readers comparing markets can also read the Mount Pleasant brief and the Hilton Head Island brief.
Source: this brief's general reasoning. The 43 day figure is from Realtor.com as cited. Commercial content; not independently verified.
What does a private sale change?
Maison Off-Market buys homes directly from their owners. It does not list a home, hold showings or put a home on a public listing. For a Johns Island owner, the five benefits are plain. There are no showings and no neighbors talking about the sale. The closing date can be flexible, which gives time to find a new home. There are no commission costs and no closing costs for the seller, and there are no inspections and repairs.
A little arithmetic shows what that is worth. Each 1% of a $725,000 sale is $7,250. A seller who gives up 3% to a result they cannot predict gives up $21,750, and one who gives up 5% gives up $36,250. This brief does not claim that those are the costs of any sale, since the real figures depend on the agreement the seller signs. It simply shows how quickly a percentage becomes a sum.
The trade is that a private buyer may offer a price that differs from what a public sale could bring. That is why the useful comparison is not the price alone but the price after every cost and every week of waiting, set against a closing date the seller picks. A public sale may fetch more or less. A private offer tells an owner the number before any of that begins.
Maison Off-Market speaks only to sellers. An owner who wants to know what a direct offer would look like can use the contact form below, or call 401-219-4207, and ask for a figure with no showings, no listing and no obligation.
Source: Maison Off-Market. The fee figures are this brief's arithmetic and not claims about any sale.
Methodology and limitations
Prices, price per square foot, days on market, listing and rental counts and the neighborhood tables for Johns Island come from two commercial pages: a national listing site page dated June 2026 and a national brokerage page whose latest figures date from January 2025. They are not independently verified, and the brokerage page is old.
Age, tenure, vacancy, income, rent and owner-estimated value come from the American Community Survey 2020-2024 five-year estimates for the postal-code area that includes Johns Island. Shares are calculated from published counts, and owner-estimated value carries a margin of error.
Days on market, active and new listings, median listing price and price reduced counts are Realtor.com series published by the Federal Reserve Bank of St. Louis for the Charleston-North Charleston metropolitan area. They describe the region and not the island. The brief makes no forecast and values no home.
Conclusion
The Johns Island record shows a sold median down 8.8% on the year and up 26% on three years, 747 homes for sale of which only 212 appear in any neighborhood, a Census vacancy rate of 31% and a regional market that slowed over the summer.
It does not fix a price for any one home. The choice between a public listing and a private sale comes down to whether an owner would rather compete in that market or take privacy, a flexible closing date, no commission, no closing costs and no inspections or repairs. To see what a direct offer would look like for your home, use the contact form below or call 401-219-4207.
Frequently Asked Questions
What is the median home price on Johns Island?
Realtor.com reports a median sold price of $725,000 for June 2026, down 8.81% on the year, and a median listing price of $745,000.
How long do Johns Island homes take to sell?
Realtor.com reports a median of 43 days on market for June 2026, down 6.42% on the year.
Is Johns Island a buyer's or a seller's market?
Realtor.com calls it balanced and warm, with homes selling 1.88% below the asking price on average.
Why does the neighborhood table show fewer homes than the total?
The twelve neighborhoods shown add up to 212 of 747 homes for sale. The page does not say why, and the likeliest reason is that many listings are not assigned to a named subdivision.
Does a private sale always beat a public listing?
No. A public listing can attract competing bids. A private sale offers privacy, a flexible closing date, no commission, no closing costs and no inspections or repairs.
Compare your options before committing. Request a written private offer for your property, with no obligation, then weigh it against your listing plan.
Sources
- Realtor.com, 2026. Johns Island, SC Housing Market and Rental Trends. https://www.realtor.com/local/market/south-carolina/charleston-county/johns-island.
- Redfin, 2025. Johns Island Housing Market Trends. https://www.redfin.com/neighborhood/766525/SC/Charleston/Johns-Island/housing-market.
- U.S. Census Bureau, 2026. American Community Survey 2020-2024 five-year estimates, the Johns Island area (via Census Reporter). https://censusreporter.org/profiles/86000US29455-29455/.
- Realtor.com, 2026. Housing Inventory: Median Days on Market in Charleston-North Charleston, SC (CBSA). https://fred.stlouisfed.org/series/MEDDAYONMAR16700.
- Realtor.com, 2026. Housing Inventory: Active Listing Count in Charleston-North Charleston, SC (CBSA). https://fred.stlouisfed.org/series/ACTLISCOU16700.
- Realtor.com, 2026. Housing Inventory: New Listing Count in Charleston-North Charleston, SC (CBSA). https://fred.stlouisfed.org/series/NEWLISCOU16700.
- Realtor.com, 2026. Housing Inventory: Median Listing Price in Charleston-North Charleston, SC (CBSA). https://fred.stlouisfed.org/series/MEDLISPRI16700.
- Realtor.com, 2026. Housing Inventory: Price Reduced Count in Charleston-North Charleston, SC (CBSA). https://fred.stlouisfed.org/series/PRIREDCOU16700.
Related research

Seller Guide · October 6, 2026
How to Prepare Point Pleasant Beach Rental Records Before Selling
Separate rental approval, income history and booked stays before comparing sale terms.

Seller Guide · October 6, 2026
How to Prepare Rumson Flood and Waterfront Records Before Selling
Separate flood disclosure, elevation, repairs and waterfront rights before comparing sale terms.

Seller Guide · October 6, 2026
How to Prepare Sarasota Condo Inspection and Reserve Records Before Selling
Separate building condition, reserve funding and resale documents before comparing sale terms.