Market Brief · by Aidan Sowa · October 5, 2026
What Is a Montclair Home Worth? Reading a Rising Sold Median Beside a Falling One
Reading a Rising Sold Median Beside a Falling One for Montclair, CO, with each source dated and its limits noted, for owners weighing a listing against a direct sale.
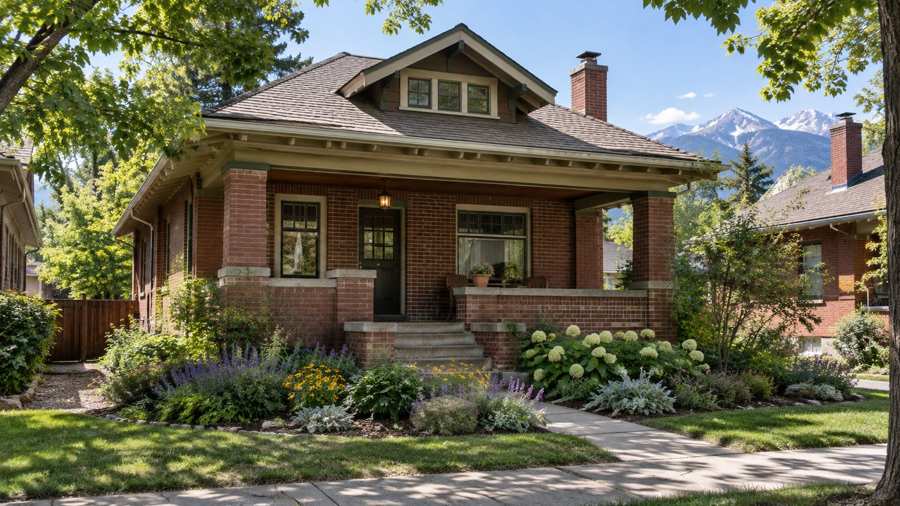
Is a Montclair home worth $635,000, $676,250, $700,000 or $739,600? Each is published for the same Denver neighborhood in 2026. The first is the median sold price on a September page, the second a median sale price for February, the third the median sold price over a recent thirty days and the fourth the median home value on a neighborhood guide. The highest of the four is 1.16 times the lowest.
The pages disagree about direction as well as level. One shows the median sold price up 15.98% on the year. Another shows it down 11.4%. The wait to sell is 10 days on one page, 43 on another, 51 on a third and 74 on a fourth. The same neighborhood is described as a buyer's market on one page and a competitive market on another.
Maison Off-Market buys luxury homes and estates directly from their owners and speaks only to sellers. We do not estimate what any home is worth, and nothing here is a valuation. This brief sets the sources side by side, separates houses from condominiums where a page does, and states what a percentage of a price is worth in dollars. Every figure is attributed, every calculation is this brief's own arithmetic and every inference is labeled as one.
Key Findings
- Realtor.com, with indicators as of September 2026, showed a median listing price of $717,500 (down 7.42% on the year), a median sold price of $635,000 (up 15.98% on the year), 28 active listings (down 30.77%) and a median of 51 days on market (Realtor.com, Montclair market data).
- Orchard showed, for the last thirty days, a median sold price of $700,000 (down 11.4%), 9 homes sold (11 a year earlier), 51 homes for sale, a median of 10 days on market against 21, 5 months of supply and a sale-to-list ratio of 98.36% (Orchard, Montclair market report).
- Houzeo showed a median sale price of $676,250 as of February 2026, a median of 74 days on market, 3.25 months of supply, a sale-to-list ratio of 97.52% and 26 homes for sale (Houzeo, Montclair housing market).
- Prop:Metrics showed, as of May 2026, a median home value of $646,000 for all homes, $715,000 for single-family homes and $245,000 for condominiums, with 43 days on market (Prop:Metrics, postal area data).
- A neighborhood guide, data verified July 17, 2026, showed a median home value of $739,600, a median household income of $101,961 and 55.0% of homes owned (Homendo, Montclair neighborhood guide).
- The Census shows a postal area with 37,203 residents, a median household income of $106,054 and a median gross rent of $1,639, with 56.9% of occupied homes owner-occupied and 5.2% of all homes vacant (Census Reporter, American Community Survey profile).
Which Montclair price is the right one?
The six pages measure six different things. The September Realtor.com figure of $635,000 is a median of homes that sold. Orchard's $700,000 is also a median sold, over a different window of thirty days. Houzeo's $676,250 is a median sale price for February. The Prop:Metrics $646,000 is a home value for all homes, which is an estimate and not a price, and its $715,000 for single-family homes is the figure closest to what a house is worth to a seller. The Homendo $739,600 is a Census-based median value. The Census Reporter profile gives $805,400 for the postal area, with a margin of error of $35,667, and the postal area is larger than the neighborhood.
Take the three medians of sales. They are $635,000, $676,250 and $700,000, and the highest is 1.10 times the lowest. That is close, and most owners would call it the same market. Add the estimates and the highest figure is $805,400, which is 1.27 times the lowest. The spread between the sold medians is $65,000 and between all the figures $170,400. A seller reading any one page would be 10% to 27% off the figure on another.
The listing median adds a fourth view. Realtor.com's $717,500 is 1.13 times its own sold median of $635,000. A seller who prices at the listing median and sells at the sold median gives up $82,500, a gap this brief computes from the two figures on that page. Orchard's sold median of $700,000 is 97.6% of that listing median, which fits its own sale-to-list ratio of 98.36%. The two pages are consistent with each other and not with each other's months.
The direction is the strangest part. Realtor.com shows the sold median up 15.98% on the year and down 7.97% on the month. Orchard shows the sold median down 11.4% on the year. The two pages cover different windows, nine sales in thirty days against a month of sales, and neither shows the sale counts behind its percentage. A median of nine sales can move by tens of thousands of dollars if one more large house closes. The likely reading, which is this brief's inference, is that a small sample moved both pages and that neither is a trend.
Prop:Metrics adds a further oddity. Its headline for the median home value says a growth of 1.1%, and its text says the change is -1.1% and that prices are decreasing. This brief reports the text, since the figure is the one that is explained, and treats the headline sign as an error on the page. The page gives the price forecast as -1.6%.
| Source | Figure | What it measures |
|---|---|---|
| Realtor.com | $635,000 | Median sold price, September |
| Houzeo | $676,250 | Median sale price, February |
| Orchard | $700,000 | Median sold price, last thirty days, 9 sales |
| Prop:Metrics | $646,000 | Median home value, all homes, May |
| Homendo | $739,600 | Median home value, verified July 17 |
| Census Reporter | $805,400 | Median owner-occupied value, postal area |
Sources as cited. The measures differ and the figures are not directly comparable. Commercial content; not independently verified.
Does a Montclair home sell in 10 days or 74?
The four clocks are 10 days on Orchard, 43 on Prop:Metrics, 51 on Realtor.com and 74 on Houzeo. A neighborhood guide says that homes typically sell in 25 to 35 days, and does not give its source or date (Neighborhood guide, Montclair homes). The ratio between the longest and the shortest is 7.4.
Part of the gap is time. Houzeo's 74 days is a February figure, and winter is when homes sit. Orchard's 10 days is a recent figure for a thinner month. Realtor.com's 51 days is the September figure and it is down 36.25% on the month and 29.17% on the year, so it was falling. Part of the gap is what is counted. Houzeo defines under 45 days as a seller's market, 45 to 70 as balanced and over 70 as favoring buyers, so by its own rule 74 days is a buyer's market. By the same rule Orchard's 10 days would be a very hot seller's market, and Orchard shows 5 months of supply, up from 3.55.
The supply figures do not agree either. Houzeo shows 26 homes for sale and 28 new listings in the month, and 3.25 months of supply. Realtor.com shows 28 active listings, down 23.4% on the month. Orchard shows 51 homes for sale, down 1.9% on the year, and 23 new listings in thirty days, up 35.3%. The Orchard count of homes for sale is 1.8 times Realtor.com's. The pages do not say whether they count the same homes, and some may include condominiums and some not. Prop:Metrics shows that condominiums are worth $245,000, against $715,000 for single-family homes, a ratio of 2.9, so a count that includes them is a different market.
Orchard's sale-to-list ratio is 98.36%, down 0.9 points, with 11.11% of homes selling above the list price and 33.33% of listed homes having dropped their price, down 12.1 points. Houzeo's ratio is 97.52%, and it says sellers are accepting offers below asking. The two ratios are within 1 point of each other, which is closer than anything else the pages share. A home that sells at 98% of its list price on 10 days and a home that sells at 97.5% on 74 days differ by one thing, and it is time.
The Colorado Realtors report for the first quarter of 2026 gives the metro frame. It says the median sale price across the seven-county Denver metro held flat at $575,000 and that the attached home market saw days on market up more than 15% to 76 days and 5.1 months of supply (Colorado Realtors, first-quarter housing report). The Montclair sold medians are 1.10 to 1.22 times the metro median, ratios this brief computes. The pages are for a different area and quarter, and they describe a market in balance, not one racing.
What do the Census figures say about the homes and the people?
This brief uses the Census cut for income, rent and tenure. The postal area has 37,203 residents. The median household income is $106,054 and the median gross rent is $1,639. The rent at the median is 18.5% of the monthly income at the median, a ratio computed from $1,639 times twelve divided by $106,054. Of 17,861 homes, 16,930 are occupied and 931 are vacant, a vacancy of 5.2%. Of the occupied homes, 9,635 (56.9%) are owner-occupied and 7,295 (43.1%) are rented.
The Homendo guide quotes older Census-based figures for the same postal area: a median income of $101,961, a median rent of $1,543, 55.0% owned, 40.2% rented and 4.8% vacant. The newer figures are higher. Income is up 4.0%, rent is up 6.2% and the median value is up 8.9% from $739,600 to $805,400, each a ratio this brief computes between two Census releases. The newer figure for value comes with a margin of error of $35,667, so the true change could be a little smaller or a little larger.
Prop:Metrics gives yet another income, $102,000, and a median rent of $1,540, which match the older Census release and not the newer. The pages that quote the Census are not quoting the same year. This is the sort of difference that a seller reading three pages will not see unless the dates are checked.
The homes are old. Of 17,861 in the postal area, 3,964 were built before 1940 and 3,687 in the 1940s. Together they are 42.8% of the stock. The median year built is 1955. Homendo gives the median age of a home as 71 years, against 51 for the city, and the guide says the neighborhood grew as a streetcar suburb in the late nineteenth century. Old homes on large lots are the reason a single median says little. A home value of $245,000 for a condominium and $715,000 for a house, in the same area, makes the point.
Source: Census Reporter, American Community Survey 2020-2024 five-year estimates, tables B19013, B25064, B25003 and B25002, and the Homendo guide for the earlier release. Percentages and ratios are this brief's arithmetic.
What do bedroom counts and rents add?
Prop:Metrics breaks its home values by size, and the breaks show how little one median can say. As of May 2026 it gives a one-bedroom value of $215,000 (down 9.3%), a two-bedroom value of $437,000 (down 3.1%), a three-bedroom value of $718,000 (down 0.1%), a four-bedroom value of $1,032,000 (up 0.6%) and a five-bedroom value of $1,712,366 (up 1.5%). The five-bedroom value is 8.0 times the one-bedroom value, and the four-bedroom is 2.4 times the two-bedroom. The smaller homes are falling and the larger ones are flat or rising, which is this brief's reading of the signs on the page.
The pattern fits the condominium split. A condominium value of $245,000 sits beside a single-family value of $715,000, and an area that includes small units will show a lower median than one with only houses. The pages do not say how many homes of each kind sold, so it is not possible to tell which group moved the medians. A seller of a four- or five-bedroom house is in a different market from a seller of a one-bedroom unit, and the headline numbers describe neither.
The rent figures show the same spread. Realtor.com gives a median rent of $2,300 a month, up 15.17% on the month and down 14.02% on the year, from 29 rental properties. Prop:Metrics gives $1,540, with one-bedroom rent at $1,280, two-bedroom at $1,700 and three-bedroom at $2,800. The Census gives $1,639 and the older release $1,543. The Realtor.com rent is 1.49 times the Prop:Metrics figure. A page of current asking rents will show a higher number than a Census median of what existing tenants pay, which is this brief's inference, and 29 rentals is a small count.
Rents against prices give a rough sense of what the houses are worth to an investor, though the pages do not do this themselves. A year of the Realtor.com rent is $27,600, which is 4.3% of the $635,000 sold median, and a year of the Prop:Metrics rent is $18,480, which is 2.9% of the $646,000 home value. Both are this brief's arithmetic. They are not yields, because they leave out taxes, upkeep and vacancy. The point is that buyers who weigh a house against renting have numbers of their own, and they read the same pages a seller does.
For a seller the useful lesson is how many ways a number can be cut. A figure for all homes, one for houses, one for a size and one for a postal area can all be correct and all describe a different home. The question to put to any page is which homes it covers. A second question is how many sales sit behind the figure, since a median of nine sales and a median of ninety can look identical on a page and carry very different weight. A third is which month the figure belongs to, because the pages above run from February to September and the market moved in between. An owner who asks these three things of every number will not be surprised by the next page, and will know which of the figures describe a home like their own. Readers comparing markets can also read the Hilltop brief and the Boulder brief.
What should an owner ask, and what does a private sale change?
Ask which month a number describes and how many sales are behind it. Ask whether the figure is a sold price, a listing price or an estimate, and whether it includes condominiums. Ask whether the wait runs to a pending date or a closing. A seller who has these answers can read a page, and a seller who does not will find that six pages give six prices.
A private sale changes how a home reaches a buyer. With Maison Off-Market there are no showings and no neighbors talking about a sale, the closing date can be flexible so that an owner has time to find a new home, there are no commission costs, there are no closing costs and there are no inspections or repairs. For a home in a neighborhood of older houses, avoiding the inspection and the repair list may matter most. This brief does not claim that a private sale always brings a higher price than a public listing.
Fee arithmetic shows what the commission point means in dollars, without assuming any rate. Each 1% of a sale price is $6,350 at $635,000, $7,000 at $700,000 and $7,175 at $717,500. At 3% those amounts are $19,050, $21,000 and $21,525. At 5% they are $31,750, $35,000 and $35,875. These are illustrations of what a percentage means on the figures in this brief, and they are not a statement of what any agent charges or what any sale would cost.
Privacy is often the first thing owners raise. A public listing puts photographs, a price history and every price cut in front of anyone with a phone, and the neighbors read them too. A private sale keeps those details out of view. That is a matter of preference and not a claim about price.
Timing is the other thing an owner controls. A public listing starts a clock that buyers can see, and the pages above show a range of 10 to 74 days. A private sale lets the owner choose the closing date, which matters most to people who need to find the next home first.
If you are weighing a sale of a Montclair home, one conversation costs nothing and obliges you to nothing. We ask about the home, the timing you would like and what you would need from a buyer, and we say plainly whether a private sale fits.
If you would like a private, no-obligation offer for a Montclair home, call 401-219-4207 or use the contact form on this site.
Methodology and limitations
Prices, days on market, counts and ratios come from Realtor.com's neighborhood page with indicators as of September 2026, Orchard's neighborhood report, Houzeo's page for February 2026, Prop:Metrics data as of May 2026, a neighborhood guide verified on July 17, 2026, and a second neighborhood guide that does not give a date. The metro frame comes from the Colorado Realtors report for the first quarter of 2026. The pages cover different periods and measures, and most are commercial pages, so they are not independent of each other.
Census figures come from the American Community Survey 2020-2024 five-year estimates for the postal area, through Census Reporter. The postal area is larger than the neighborhood and also holds Hilltop, which has its own brief in this series with a different Census cut. Percentages, gaps, ratios and fee amounts are this brief's own arithmetic and are labeled as such. Where a reading goes beyond what a page says, it is called an inference. No agent names, contact details or street addresses from the pages are reproduced.
Conclusion
The Montclair record shows sold medians from $635,000 to $700,000, estimates up to $805,400, waits from 10 to 74 days, 26 to 51 homes for sale, sale-to-list ratios near 98% and a stock of homes of which 42.8% were built before 1950. The numbers differ because the pages measure different things, cover different months and in several cases rest on a handful of sales.
It does not fix a price for any one home. The choice between a public listing and a private sale comes down to whether an owner would rather meet showings, inspections and a public clock, or sell quietly on a date that suits them. Maison Off-Market speaks only to sellers, and a conversation costs nothing.
Frequently Asked Questions
What is the median home price in Montclair, Denver?
Pages differ. Realtor.com shows a median sold price of $635,000 for September 2026, Houzeo $676,250 for February and Orchard $700,000 for the last thirty days. Listing medians and home values are higher.
How long do homes take to sell in Montclair?
Pages show 10, 43, 51 and 74 days on market, and one guide says 25 to 35 days. The measures and months differ.
Are Montclair prices rising or falling?
Realtor.com shows the sold median up 15.98% on the year and the listing median down 7.42%. Orchard shows the sold median down 11.4%. Prop:Metrics shows home values down 1.1%.
How many homes are for sale in Montclair?
Houzeo shows 26, Realtor.com 28 and Orchard 51. The pages do not say whether they count the same homes.
What is the difference between a private sale and a public listing?
A private sale with Maison Off-Market has no showings, a flexible closing date, no commission costs, no closing costs and no inspections or repairs. A public listing exposes the home to a wider group of buyers. This brief does not claim either always gets a higher price.
Compare your options before committing. Request a written private offer for your property, with no obligation, then weigh it against your listing plan.
Sources
- Realtor.com, 2026. Montclair Neighborhood of Denver, CO Housing Market. https://www.realtor.com/local/market/colorado/denver/montclair.
- Orchard, 2026. Montclair Housing Market: Stats and Trends. https://orchard.com/homes/real-estate-market-report/neighborhood/co/denver/montclair.
- Houzeo, 2026. Montclair, Denver, CO Housing Market in 2026. https://www.houzeo.com/housing-market/colorado/denver/montclair.
- Prop:Metrics, 2026. Montclair, Denver, CO Home Prices, Rental Trends and Demographics. https://www.prop-metrics.com/zip/80220.
- Homendo, 2026. Montclair in Denver, CO. https://homendo.com/places/usa/co/denver/80220/montclair-denver-co.
- U.S. Census Bureau, 2026. American Community Survey 2020-2024 five-year estimates, the Montclair area (via Census Reporter). https://censusreporter.org/profiles/86000US80220-80220/.
- Local neighborhood guide, 2026. Montclair Denver: Homes, Real Estate and Neighborhood Guide. https://salliesimmons.com/neighborhoods/montclair.
- Colorado Realtors, 2026. Housing Markets Finding Some Balance as Full Spring Season Begins. https://coloradorealtors.com/2026/04/14/housing-markets-finding-some-balance-as-full-spring-season-begins/.
Related research

Seller Guide · October 6, 2026
How to Prepare Point Pleasant Beach Rental Records Before Selling
Separate rental approval, income history and booked stays before comparing sale terms.

Seller Guide · October 6, 2026
How to Prepare Rumson Flood and Waterfront Records Before Selling
Separate flood disclosure, elevation, repairs and waterfront rights before comparing sale terms.

Seller Guide · October 6, 2026
How to Prepare Sarasota Condo Inspection and Reserve Records Before Selling
Separate building condition, reserve funding and resale documents before comparing sale terms.