Market Brief · by Aidan Sowa · October 5, 2026
What Is a Backcountry South Estate Worth? Reading a Median and an Average
Reading a Median and an Average for Backcountry South, CT, with each source dated and its limits noted, for owners weighing a listing against a direct sale.
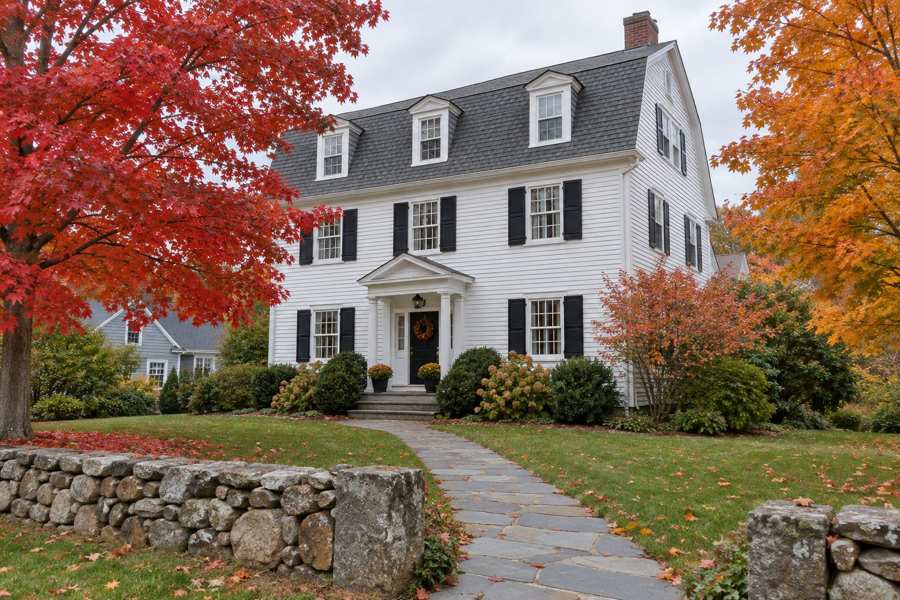
What is an estate on four acres north of the Merritt Parkway worth? The question has no single answer, because the sources that cover Backcountry South disagree. A Greenwich real estate blog dated September 3, 2026 puts the backcountry median sale price near $4.8 million, up roughly 35% on the year. A local newspaper report by a Compass agent puts the average sale in the Parkway school district, the best stand-in for the backcountry, at $6.78 million for 2025. A brokerage guide puts the median at $4.0 million or more.
The waits and the discounts disagree in the same way. The blog gives 105 to 120 days on market and a sale-to-list ratio below 97%. The newspaper gives an average sale at 94.8% of the original list price. The town as a whole, the blog says, took 30 days in July 2026 at 106.3%. Backcountry South is slower than the town in a market where the town is fast.
The big listing sites do not give Backcountry South a page of its own. This brief reads the Realtor.com page for the postal area that contains it, a blog on the backcountry's slow market, two Greenwich Sentinel reports and a lifestyle guide, tests them against each other and asks what they mean for an owner who is choosing between a public listing and a private sale.
Key Findings
- A Greenwich real estate blog dated September 3, 2026 reported that over the past year the backcountry's median sale price ran near $4.8 million, up roughly 35%, with 105 to 120 days on market and sale-to-list ratios below 97%, against under 40 days and above 103% in Old Greenwich and Cos Cob, and 30 days and 106.3% for the town in July 2026.
- A Greenwich Sentinel report on 2025, by a Compass agent, said the Parkway school district, which it described as the back country and mid-country just below the Merritt Parkway, had 94 sales, an average price up $2.44 million to $6.78 million, an average sale at 94.8% of the original list price, $829 per square foot (up 21.8%) and 17 listings at year end.
- A second Sentinel report said that in the first half of 2026 the Parkway district had 48 sales against 45 a year earlier, with a sales volume of $242.1 million against $272.9 million, a highest sale of $11 million against $19.5 million and an average price per square foot up 3.3%.
- A lifestyle guide by a brokerage listed a backcountry median sale price of $4.0 million or more for 2025 and an average of 120 days on market, down from 180 days in 2022.
- Realtor.com's page for the postal area that includes Backcountry South reported, as of August 2026, a median listing price of $3,550,000 (up 27.28% on the year), a median sold price of $1,302,000, 70 homes for sale, a median of 46 days and a sale-to-list ratio of 103%.
- In the Bridgeport-Stamford-Norwalk area the median days on market was 27 in April 2026 and 42 in July (Realtor.com, days on market).
Why does a median of $4.8 million sit beside an average of $6.78 million?
A median is the middle sale, and an average is the total divided by the count. In a market with a few very large sales, the average sits far above the median. The Sentinel gives the Parkway district's average as $6.78 million for 2025, and the blog gives a median near $4.8 million. The average is 1.4 times the median, so the top of the market pulls the average up by about $2 million.
The two are not the same area or the same period. The Sentinel's district includes mid-country as well as the backcountry, covers the calendar year 2025 and the first half of 2026, and counts single-family sales on the town's listing service. The blog's figure covers the past year to September 2026, for the backcountry. The guide's $4.0 million or more is for 2025, and it sits 17% below the blog's figure for a period that overlaps.
The newspaper gives the best way to see the spread. In the first half of 2025 the district had 45 sales worth $272.9 million, an average of about $6.06 million. In the first half of 2026 it had 48 sales worth $242.1 million, an average of about $5.04 million, which is 16.8% lower. The highest sale fell from $19.5 million to $11 million, and the paper says that last year there were six sales above $11 million. One or two sales above $15 million move the average by more than $1 million.
The newspaper adds one more caution. For 2025 it says that the Parkway district, its largest by land, sold 94 houses, one more than in 2024, and that the town as a whole had 519 sales against 500. A rise of $2.44 million in the average price on almost the same number of sales suggests that the mix moved up the price range, and not only that the same houses sold for more. The 39 sales over $10 million in the town, concentrated in three districts, did most of the work.
A seller who is told that the average is $6.78 million should ask for the median, and a seller who is told that the median is $4.8 million should ask what the top of the range is. A house at the median is a different property from one at the average, and neither one is a price for a particular home.
| Source and period | Measure | Figure |
|---|---|---|
| Blog, past year to September 2026 | Median sale price | near $4.8 million (up roughly 35%) |
| Sentinel, 2025 | Average sale price, Parkway district | $6.78 million (up $2.44 million) |
| Sentinel, first half of 2026 | Average sale price, Parkway district (this brief's arithmetic) | about $5.04 million (down 16.8%) |
| Brokerage guide, 2025 | Median sale price | $4.0 million or more |
Source: Greenwich real estate blog, Greenwich Sentinel and a brokerage guide as cited. The 1.4 ratio, the $2 million gap, the 17%, $6.06 million, $5.04 million and 16.8% figures are this brief's arithmetic from the stated counts and volumes. Commercial content; not independently verified.
Why is the backcountry slower than the town?
The blog's table shows the contrast. Old Greenwich and Cos Cob averaged under 40 days on market over the past year, with sale-to-list ratios above 103%. The Back Country and North Parkway took 105 to 120 days, with ratios below 97%. The town as a whole took 30 days in July 2026 at 106.3%. The backcountry's wait is 3.5 to 4 times the town's.
The Sentinel reported the same shape for 2025, when the Parkway district had the lowest ratio of sale price to original list price in town, 94.8%. Every district but two sold above its original list price, and the two were Parkway and the waterfront Julian Curtiss district, where the paper says owners list at an aspirational price. A sale at 94.8% of the original list price on a $6.78 million average is about $353,000 below the original ask.
The blog says that the cause is a thin market and not weak demand. There are few four-acre estates, each is priced against a handful of true comparables, and a buyer who wants that combination of acreage, privacy and architecture must wait for the right property. The guide's table shows the wait shortening, from 180 days in 2022 to 120 in 2025, as buyers returned for land. Both are brokerage commentary.
The regional series shows what the rest of the market did at the same time. The median days on market across the Bridgeport-Stamford-Norwalk area was 27 in April, 26 in May, 32 in June and 42 in July. The region's median is much shorter than the backcountry's 105 to 120 days. A seller here plans in quarters, not weeks.
Source: Greenwich real estate blog, Greenwich Sentinel, a brokerage guide and the regional series as cited. The multiple of 3.5 to 4 and the $353,000 figure are this brief's arithmetic (5.2% of $6.78 million). The commentary is the sources' and was not independently verified.
What does the price per foot say about large houses?
The Sentinel reports that in 2025 the Parkway district's average price per square foot was $829, up 21.8% on 2024 and the largest rise in town, against a townwide rise of 11.3%. The paper says that many of its houses are large, and that extra square feet in older homes or styles that younger buyers like less sell for less per foot.
At $829 per foot, an average sale of $6.78 million implies about 8,200 square feet. This is a rough figure, since an average price and an average price per foot are not computed from the same set of homes in a simple way, but it shows the scale. A buyer paying $829 per foot for 8,200 square feet is paying for land and privacy as much as for the house.
In the first half of 2026 the paper says the district's average price per foot rose a further 3.3%. If 3.3% is applied to $829, it gives about $856, though the paper does not say that the base is the same. The rise is much smaller than 2025's 21.8%, and it came while the district's sales volume fell by $30.8 million.
The guide points to a similar tension. It says that homes in the backcountry sell for under $2 million at the low end, while the newspaper says that no single-family home in town was listed below $1 million at the start of 2026. Both can be true for different homes and different dates, and both show how wide the range is. A seller whose house is at the low end of the range will be compared with a very different set of sales from a seller whose house is at the top.
For a seller, the price per foot is a poor tool at this size. A 12,000 square foot house on four acres, an older 6,000 square foot house on two acres and a new build on a smaller lot do not share a price per foot. The size of the lot, the age of the house and the style matter more than the number on a page.
Source: Greenwich Sentinel as cited. The 8,200 square feet, $856 and $30.8 million figures are this brief's arithmetic (the $856 assumes the same base, which the report does not state). The remark on land and privacy is this brief's reasoning. Commercial content; not independently verified.
How much inventory is there, and what does the postal page add?
The Sentinel counted 17 Parkway listings at the end of 2025, the most of any district, with Julian Curtiss next at 12 and every other district in single digits. Town-wide, inventory fell 13% in the first half of 2026 according to its later report. A district that holds the most listings and sells the slowest is the one where a seller has the least pull.
The postal-area page from Realtor.com for Backcountry South's ZIP shows 70 homes for sale, down 9% on the year and 11.65% on three years, 78 rentals, a median of 46 days and a sale-to-list ratio of 103%. These cover the whole postal area, including the town center, and they describe a seller's market. They do not describe the backcountry.
The postal area's listing median is $3,550,000, up 27.28% on the year, and its sold median is $1,302,000, down 47.39%. The sold median is 63% below the listing median, which points to a very different mix of homes selling and listing. Where a postal page has a sold median this far below its listing median, the median is not a guide to a four-acre estate.
Regionally, active listings rose from 1,190 in April 2026 to 1,622 in June (Realtor.com, active listings), a rise of 36.3%, and were 1,560 in August. Price-reduced listings were 166 in March and 440 in June. More homes are staying on the market and more are being cut, and the backcountry, the slowest part, feels it first.
Source: Greenwich Sentinel, Realtor.com and the regional series as cited. The 63% and 36.3% figures are this brief's arithmetic. The remark that the postal figures do not describe the backcountry is this brief's reasoning. Commercial content; not independently verified.
What do zoning and the new state law mean for an owner?
The blog says that the new state housing law, Public Act 25-1, which began implementation in Greenwich on July 1, 2026, does not apply to the zones that cover most of the backcountry, which are four-acre residential zones. Its streamlined review applies to areas zoned commercial or mixed-use. The blog says a proposal for a 5,000 square foot lot cap did not become law, and that its author sees the political risk to four-acre zoning as a longer-dated variable.
The blog also lists points a buyer should check, and each is also a point a seller should be ready to answer. Whether the parcel is in the standard four-acre zones or in the privately governed Conyers Farm association with its own ten-acre minimum. Whether an accessory dwelling unit would route through the town health department's septic review, since most large lots north of the Merritt Parkway use well and septic. Whether any planning applications are pending on the property or next door.
The guide adds that parcels are often subject to four-acre minimums and to conservation restrictions, wetlands rules and subdivision limits, and gives the example of a tennis court plan that is delayed by wetlands rules. It is a brokerage's guide, and it is general. The point is that each estate has its own rules, and a buyer's lawyer will ask for them.
This is why a public sale can run long. A buyer of a large estate hires inspectors, a surveyor, a lawyer and sometimes an engineer, and each can raise a question that reopens the price. A seller who sells directly to a buyer who accepts the property as is can skip most of those rounds. The trade is that a direct offer may differ from what a patient public sale could bring.
Source: Greenwich real estate blog and a brokerage guide as cited. The characterization of what a seller should be ready to answer and the remarks on inspections are this brief's reasoning. This is not legal advice. Commercial content; not independently verified.
What does the Census say, and what should an owner ask?
The Census data is for the postal area that includes Backcountry South, which also holds the town center and the shore. It has 24,880 residents, 9,480 occupied homes and a median household income of $146,654. The owner-estimated median home value is $1,660,700, which is 11.3 times the median income. The median gross rent is $2,374, which is a yearly $28,488, or 1.7% of that value.
The Sentinel's 2025 average of $6.78 million is 4.1 times the Census value, and the blog's median of near $4.8 million is 2.9 times it. The backcountry is a different market from the area average, and the Census value says what the typical home is worth in the whole postal area, not what an estate is worth. The margin of error on the value is $196,170, or 11.8%.
An owner can test any offer with plain questions. What is the price, and is any part of it conditional on an inspection, a survey, a loan or the sale of another home? What will I take home after every charge? When will the sale close, and can the date move? Who pays for repairs and for any approvals a buyer needs?
For an estate there are more. Which sales are true comparables for my acreage, house and style? How many days did they wait, and how far below the original list did they close? Does my parcel have wetlands, conservation limits or a private association? What would I pay in taxes, insurance, grounds and upkeep over a wait of 105 to 120 days? Readers comparing markets can also read the Central Greenwich brief and the Fairfield brief.
Source: U.S. Census Bureau, American Community Survey 2020-2024 as cited. The multiples, $28,488 and 1.7% are this brief's arithmetic. The questions are this brief's general reasoning and not statements of any source.
What does a private sale change?
Maison Off-Market buys homes directly from their owners. It does not list a home, hold showings or put a home on a public listing. For a Backcountry South owner, the five benefits are plain. There are no showings and no neighbors talking about the sale. The closing date can be flexible, which gives time to find a new home. There are no commission costs and no closing costs for the seller, and there are no inspections and repairs.
A little arithmetic shows what that is worth. Each 1% of a $4,800,000 sale is $48,000. A seller who gives up 3% gives up $144,000, and one who gives up 5% gives up $240,000. This brief does not claim that those are the costs of any sale, since the real figures depend on the agreement the seller signs. It shows how quickly a percentage becomes a sum at estate prices, and how it compares with the 5.2% below the original list that the Parkway district averaged.
Privacy and time are the benefits that fit an estate best. A public listing of an estate with a gate and a long drive brings tours of the grounds and of the house, with photographs and an address that neighbors see. A wait of 105 to 120 days means months of that. A direct sale avoids it and can close on a date the seller picks.
Maison Off-Market speaks only to sellers. An owner who wants to see what a direct offer would look like can use the contact form below, or call 401-219-4207, and ask for a figure with no showings, no listing and no obligation.
Source: Maison Off-Market. The fee figures are this brief's arithmetic and not claims about any sale.
Methodology and limitations
The backcountry median, days on market and sale-to-list ratios come from a brokerage blog dated September 3, 2026. District sales counts, volumes, averages and prices per square foot come from two reports in a local newspaper by a brokerage agent, using school districts as a stand-in for neighborhoods. A brokerage guide supplies a multi-year table. A national listing site page supplies figures for the postal area that includes Backcountry South. None of these is a page for Backcountry South itself, and none is independently verified.
Age, tenure, income, rent and owner-estimated value come from the American Community Survey 2020-2024 five-year estimates for the postal-code area that includes Backcountry South. The area is much larger than the backcountry. Owner-estimated value carries a margin of error.
Days on market, active listings and price reduced counts are Realtor.com series published by the Federal Reserve Bank of St. Louis for the Bridgeport-Stamford-Norwalk area. They describe the region and not the neighborhood. Averages, implied sizes and discounts are this brief's arithmetic. The brief makes no forecast and values no home.
Conclusion
The Backcountry South record shows a median near $4.8 million, a district average of $6.78 million, sales at 94.8% of the original list price and waits of 105 to 120 days. It describes a thin market of large estates in which no single figure is a price for a given home, and in which patience is the usual cost of a public sale.
It does not fix a price for any one home. The choice between a public listing and a private sale comes down to whether an owner would rather meet showings, inspections and a repair list or take privacy, a flexible closing date, no commission, no closing costs and no inspections or repairs. To see what a direct offer would look like for your home, use the contact form below or call 401-219-4207.
Frequently Asked Questions
What is the median home price in Backcountry South?
A Greenwich blog dated September 3, 2026 puts the backcountry median sale price near $4.8 million. A local report puts the Parkway district's 2025 average at $6.78 million.
How long do backcountry homes take to sell?
The blog reports 105 to 120 days on market, against 30 days for the town in July 2026.
Do backcountry homes sell below asking?
The Sentinel reports an average sale at 94.8% of the original list price in the Parkway district in 2025.
What is the zoning?
The blog and a brokerage guide describe four-acre minimums across most of the backcountry and a ten-acre minimum in one private association.
Does a private sale always beat a public listing?
No. A public listing can attract competing bids. A private sale offers privacy, a flexible closing date, no commission, no closing costs and no inspections or repairs.
Compare your options before committing. Request a written private offer for your property, with no obligation, then weigh it against your listing plan.
Sources
- Realtor.com, 2026. Greenwich Postal Area Housing Market Data. https://www.realtor.com/local/market/connecticut/zipcode-06830.
- Brid Mortamais, 2026. Backcountry Greenwich's Slow Market Has Nothing to Do With Hartford (Yet). https://bridmortamaisrealestate.com/blog/backcountry-greenwichs-slow-market-has-nothing-to-do-with-hartford-yet.
- Greenwich Sentinel, 2026. 2025 Set Records in Every Neighborhood. https://www.greenwichsentinel.com/2026/01/19/2025-set-records-in-every-neighborhood/.
- Greenwich Living, 2025. Back Country Greenwich Real Estate and Lifestyle Guide 2025. https://greenwichliving.com/back-country-greenwich-real-estate-lifestyle-guide-2025/.
- Realtor.com, 2026. Housing Inventory: Median Days on Market in Bridgeport-Stamford-Norwalk, CT (CBSA). https://fred.stlouisfed.org/series/MEDDAYONMAR14860.
- Realtor.com, 2026. Housing Inventory: Active Listing Count in Bridgeport-Stamford-Norwalk, CT (CBSA). https://fred.stlouisfed.org/series/ACTLISCOU14860.
Related research

Seller Guide · October 6, 2026
How to Prepare Point Pleasant Beach Rental Records Before Selling
Separate rental approval, income history and booked stays before comparing sale terms.

Seller Guide · October 6, 2026
How to Prepare Rumson Flood and Waterfront Records Before Selling
Separate flood disclosure, elevation, repairs and waterfront rights before comparing sale terms.

Seller Guide · October 6, 2026
How to Prepare Sarasota Condo Inspection and Reserve Records Before Selling
Separate building condition, reserve funding and resale documents before comparing sale terms.