Market Brief · by Aidan Sowa · October 5, 2026
What Happens When Inventory Rises and Sales Stay Flat? Reading Green Valley Ranch's Median, Clock and Listings
Reading Green Valley Ranch's Median, Clock and Listings for Green Valley Ranch, NV, with each source dated and its limits noted, for owners weighing a listing against a direct sale.
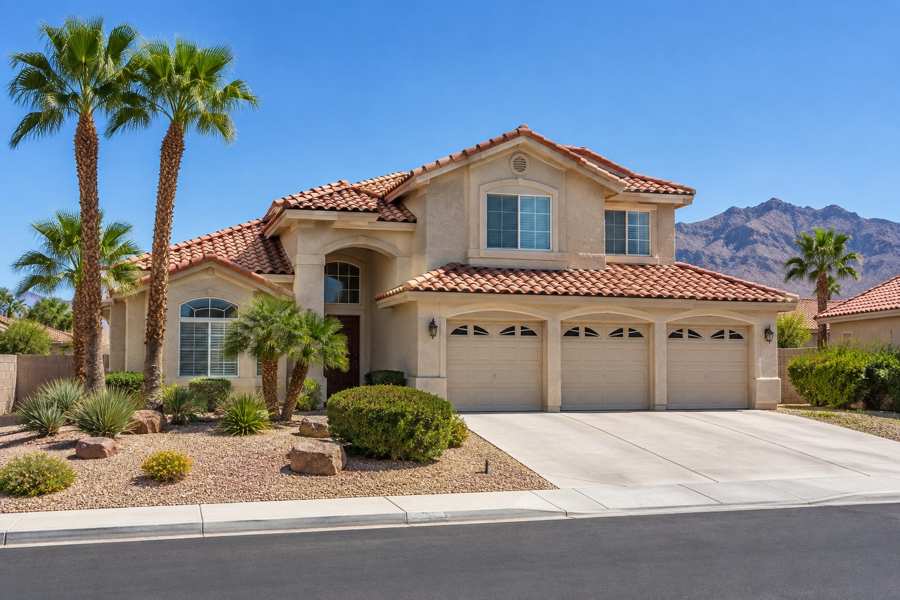
The second-quarter market update for Green Valley Ranch carries a set of percentage changes that would worry a seller if they stood alone. Inventory is up 49% on a year earlier, to 61 listings. New listings are up 50%. Months of supply are up 46%. Average days on market are up 48%, to 31. Reading only those, a seller might think the market had turned.
The same page shows two numbers that point the other way. The median sales price is $625,000, up 11% on the second quarter of 2025, and closed sales are 53, up 2%. A market in which prices are rising and sales are holding while listings pile up is not a market that has turned. It is a market where supply is catching up with demand from a low base, and where the speed of sale is easing from a very fast pace to a merely quick one.
This brief reads the update alongside the Census profile of the postal area that includes Green Valley Ranch and the Las Vegas metropolitan listing series. In the postal area, 96.6% of homes were built since 1990, and 38.3% of occupied homes are rented. The market data are from one brokerage update and are labeled so. Nothing here prices a house.
Key Findings
- Sotheby's Q2 2026 update for Green Valley Ranch showed a median sales price of $625,000 (11% above Q2 2025), 31 average days on market (48% more), 53 closed sales (2% more) and 61 active listings (49% more), with new listings up 50% and months of supply up 46% (Sotheby's International Realty, Q2 2026).
- In the Census postal area, 16,376 of 16,951 housing units (96.6%) were built since 1990, 6,195 of 16,162 occupied homes (38.3%) are rented and median household income is $98,053 (U.S. Census Bureau, 2020-2024).
- The Las Vegas metropolitan median days on market rose from 51 in April 2026 to 58 in August (Realtor.com, days on market).
- Metropolitan active listings rose from 9,615 in April to 10,788 in August (Realtor.com, active listings).
- Metropolitan listings with a price reduction rose from 3,422 in April to 4,024 in August (Realtor.com, price reduced listings).
What does a 49 percent rise in inventory mean when sales are flat?
Inventory on the page is the number of active properties on the market at the end of the quarter: 61, against about 41 a year earlier, which is the arithmetic implied by the 49% rise. Closed sales in the quarter are 53, against about 52. The count of homes for sale grew by about 20 while the count sold barely moved.
A simple division shows what that does to the pace. Sales of 53 in a quarter are about 18 a month. At 61 listings, current inventory is a little over three months of sales, which this brief calculates for illustration and which the page presents as a percentage change in months of supply, up 46%. A year earlier, with about 41 listings and a similar sales pace, inventory was about two and a quarter months. The market moved from very tight to merely tight.
The page does not say whether the extra listings are new houses, houses that failed to sell last year or houses that sellers decided to list because they saw high prices. New listings are up 50% for the quarter, which suggests that sellers noticed the same prices that the median shows and came to market. The prices they see are the ones that rose 11%.
For a seller, the message is that the competition for each buyer has risen. A year ago, a house in this market faced few comparable houses. Now it faces about half as many again. The advantage that scarcity gave to sellers has narrowed, though not disappeared, because three months of supply is still a market where a priced-right house sells.
It helps to hold the percentages next to the counts. A 50% rise in new listings sounds like a flood, but on a base of a few dozen listings a quarter it is a matter of roughly twenty more houses. A single large builder release, a handful of owners relocating or a few investors selling can account for a swing of that size. The page does not tell a reader which of these happened, and a seller should avoid reading a motive into a number that might be a handful of decisions. What the count does show is that buyers who walk through the market now meet more choice than a year earlier, which is the part that changes how they behave.
Source: Sotheby's International Realty, Q2 2026, Green Valley Ranch. Prior-year counts are derived from the stated percentage changes and are approximate; the months-of-supply figures are this brief's arithmetic.
Why did days on market rise 48 percent to only 31?
A rise of 48% sounds large and a figure of 31 days is small. The page gives the average days on market as 31, 48% more than in the second quarter of 2025, which implies a year-earlier figure of about 21 days. A house that went under contract in three weeks now takes about four and a half.
The page defines the measure as the days from listing until a seller has accepted an offer and signed a contract, so it ends at the contract and not at the closing. The closing then follows by some weeks. A seller should add the period between contract and closing to any figure like this one when planning a move.
The change in speed is real and is consistent with the higher inventory. More houses means more choice, and more choice means buyers take longer. It is also consistent with prices that rose 11%, since buyers take longer to decide when a house costs more. The page does not say which effect is larger.
What the figure does not say is that houses are sitting. A month to sign a contract is quick by almost any standard, and the Las Vegas metropolitan median of 58 days in August is nearly twice as long. A Green Valley Ranch seller is still in a faster market than the metropolitan average, and the point is that the gap has narrowed.
There is one more thing to say about the speed. In a market where houses go under contract in three weeks, a buyer has to decide quickly and tends to bid close to asking. In a market where the figure is four and a half weeks, a buyer can visit a second weekend, compare a third house and come back with a lower number. That small change in behavior is what moves a seller from receiving offers without effort to negotiating them. It is a gradual change, and a seller who notices it early can adjust the price or the terms before the first offers arrive, and not after a month of silence.
Source: Sotheby's International Realty, Q2 2026; Realtor.com via FRED. Prior-year figure derived from the stated percentage change and approximate.
How should a seller read a market that is easing from very fast?
There are two ways to misread an easing market. One is to assume it is turning and to cut a price in a panic. The other is to assume nothing has changed and to price as if it were last year. The figures on the page support neither. They show that buyers have more choice than they did and take longer to choose, and that prices were still higher than a year ago in the quarter measured.
A useful test is to ask what a buyer sees. A year ago, a buyer looking in Green Valley Ranch saw about 41 houses for sale at the end of the quarter. Now the buyer sees about 61. The buyer who used to find one house that fit a budget and a size may now find two or three. That buyer has leverage that did not exist, and that leverage shows up in longer decisions, in requests for credits and in offers a little below asking.
The second test is to ask what the house offers that the others do not. In a market with more choice, a house with a recent roof, new cooling equipment, a clean inspection history or an unusually good lot stands out, and a house without those things is one of many. The page cannot say which a given house is. A seller who has not looked at the house through a buyer's eyes should do so, preferably with a contractor, before choosing a price.
The third test is to ask how long the seller can wait. The page says the average house still goes under contract in about a month. A seller who can wait that long and then weeks more for a closing is in the market the page describes. A seller whose needs are fixed, for example by a job start, a purchase elsewhere or a tax year, has less room to wait if the market eases further.
The fourth test is the cost of being wrong. A price that is too high wastes weeks and may attach a stale listing to the house, which buyers read as a sign of a problem. A price that is too low gives away money that cannot be recovered. A private offer has its own risk, which is that it is one number from one buyer, and the seller cannot know whether a public sale would have brought more. It also has its own benefits: the date and the price are settled, with no commission, no closing costs and no inspections or repairs.
None of this tells an owner what to do. It tells an owner what to ask, and the answers depend on the house, the owner's plans and the buyer in front of them. The market data are a background, and the decision is made against the owner's own numbers.
Source: this section is analysis of the figures above; prior-year counts are derived from stated percentage changes and are approximate.
How old is the stock, and what does age mean for sellers?
The Census profile covers the postal area that includes Green Valley Ranch and a large part of Henderson, so it describes the wider area. Of 16,951 homes, 6,762 were built in the 1990s (39.9%), 6,066 in the 2000s (35.8%), 3,127 in the 2010s (18.4%) and 421 since 2020 (2.5%). The median year built is 2002. Only 575 homes, 3.4%, predate 1990.
A stock built mostly in the 1990s and 2000s is now twenty to thirty-five years old. That is the age at which the first big replacements come due on a house: roofs, air conditioning equipment, water heaters, windows and exterior paint. The sources used here give no repair costs and this brief does not estimate any. The pattern is general, not specific to this area, and a buyer who inspects a house of that age will expect to find some of those items on the list.
The market data show a rise in listings of 49%, and the age of the stock suggests that many of the new listings are houses that are reaching the age at which owners decide whether to repair or sell. That is a hypothesis, not a finding, since the page does not break listings down by age. It is consistent with the profile, and an owner should consider it when thinking about what buyers will see.
For a seller of a house that is thirty years old, the inspection is the part of the sale most likely to change the number. A buyer who inspects may ask for credits or repairs, and the seller is left to choose between paying and accepting a lower price. A buyer who purchases as is, with no inspections or repairs, takes that choice away.
A last point on age. The profile shows that only 3.4% of homes in the postal area were built before 1990, so very few owners here live with the kind of decades-old systems found in older neighborhoods. What they do live with is a second round of ordinary wear. A buyer inspecting a house of this age is likely to ask about the roof, the cooling units and the water heater first, and sellers who know those answers in advance negotiate from a stronger position.
| Indicator | Value | Note |
|---|---|---|
| Population | 38,339 | Whole postal area |
| Housing units | 16,951 | All units |
| Owner-occupied homes | 9,967 | 61.7% of occupied |
| Renter-occupied homes | 6,195 | 38.3% of occupied |
| No usual resident | 789 | 4.7% of all units |
| Median household income | $98,053 | Estimate |
| Median gross rent | $1,941 | Monthly |
| Owner-estimated median value | $494,700 | Margin of error $13,473 |
| Median year built | 2002 | Estimate |
Source: U.S. Census Bureau, American Community Survey 2020-2024 five-year estimates, tables B01003, B19013, B25002, B25003, B25034, B25064 and B25077.
How far is $625,000 from what owners think their homes are worth?
Owners in the postal area estimate the median home at $494,700, with a margin of error of $13,473, or 2.7%. The median sale in Green Valley Ranch in the second quarter was $625,000, which is $130,300 higher, or 26% above the owner estimate. The two are not measuring the same thing. The Census figure covers every owner-occupied home in a large area, including older and smaller ones, and the estimate is the owner's opinion, often formed years ago. The sale figure covers houses that sold in the quarter in one master-planned community.
The gap still matters. Many owners in the wider area bought when prices were lower, and the Census captures their opinion, which may lag the market. An owner who has not checked recent sales may be underestimating what a house like theirs can sell for, which cuts in the seller's favor, or overestimating it if their house is older or smaller than the typical sale.
The household numbers show the area is middle-income and heavily rented. Median household income is $98,053, median gross rent is $1,941 a month, or $23,292 a year, which is 23.8% of the median income. Renters are 38.3% of occupied households. Many buyers of Green Valley Ranch houses may therefore be renters in the area who are becoming owners, along with investors and move-up buyers.
A seller can use this. A first-time buyer who needs a loan is a buyer who needs an appraisal and an inspection, and who will compare the house closely to others. An investor who pays cash or a direct buyer is a buyer who may skip both. The mix of buyers in the area includes both kinds.
Source: U.S. Census Bureau, American Community Survey 2020-2024; Sotheby's International Realty, Q2 2026. The Census value is owner-estimated and covers a wider area.
What does the Las Vegas clock say?
Realtor.com publishes listing series for the Las Vegas-Henderson-Paradise metropolitan area through the Federal Reserve Bank of St. Louis. They show direction, not the level for Green Valley Ranch. The median days on market was 51 in April 2026 and May, 55 in June, 57 in July and 58 in August. Active listings rose from 9,615 in April to 10,788 in August, up 12.2%.
New listings eased from 3,604 in April to 3,204 in August (Realtor.com, new listings). The median listing price was $468,175 in March and $469,900 in July (Realtor.com, median listing price), essentially flat. Listings with a price reduction rose from 3,422 in April to 4,024 in August, up 17.6%.
Compared with the local figures, the metropolitan growth in inventory, 12.2% over four months, is smaller than the 49% year-on-year rise in Green Valley Ranch, though the periods differ and one is a season while the other is a year. Both point the same way. The local market is tightening less than it was.
The metropolitan median listing price of about $470,000 is below the local $625,000 median sale, so Green Valley Ranch is a pricier pocket in the metropolitan area. Its direction, though, follows the region: more supply, a longer clock and more cuts. Readers comparing markets can also read the MacDonald Highlands brief and the Reno brief.
Source: Realtor.com via FRED, Housing Inventory: Median Days on Market, Active Listing Count, New Listing Count, Median Listing Price and Price Reduced Count, Las Vegas-Henderson-Paradise, NV (CBSA).
What would a private sale change for a Green Valley Ranch owner?
A direct sale to a buyer who purchases homes off the market changes five things for the seller. There are no showings and no neighbors talking about you selling. The closing date can be flexible, giving time to find a new home. There are no commission costs and no closing costs for the seller. And there are no inspections or repairs, which for a house of thirty years can be the step that most often changes the price.
The fee benefit needs no assumed rate. For every 1% of a sale price that would otherwise go to fees, a sale at $494,700 keeps $4,947 and a sale at $625,000 keeps $6,250. An owner can set whatever percentage applies against a private offer and compare the two on net proceeds.
The market data give a reason to think about timing. Listings are up about half on a year earlier, and a seller who lists now joins a larger field than a year ago. A private sale avoids joining it, and it settles a date.
The trade-off is the usual one. A public listing in a market that still sells in about a month can bring competing bids, and a house that is priced right may do very well. A private sale offers one number with privacy and certainty. The owner decides, with the figures above in hand.
Source: calculation from stated prices; no commission rate, closing cost or repair cost is assumed.
Methodology and limitations
Age, tenure, vacancy, income, rent, population and owner-estimated value come from the American Community Survey 2020-2024 five-year estimates for the postal-code area that includes Green Valley Ranch. The area is wider than the community and is shared with other neighborhoods in this series. Shares are calculated from published counts, and owner-estimated value carries a stated margin of error.
Days on market, active listings, new listings, median listing price and price reduced counts are Realtor.com series published by the Federal Reserve Bank of St. Louis for the Las Vegas-Henderson-Paradise metropolitan area. The series end in July or August 2026. Listing prices are asking prices and not sale prices.
The local figures come from one brokerage quarterly update. Prior-year counts and days are derived from its stated percentage changes and are approximate. The update was not independently verified. The brief makes no forecast and does not estimate what any particular home would sell for.
Conclusion
The public record supports a short list for a Green Valley Ranch owner. Inventory and days on market rose by about half on a year earlier while the median price rose 11% and sales held, the stock is mostly thirty years old or younger, and a large share of the households in the postal area rent.
It does not support a price for any one home. The choice between a public listing and a private sale comes down to how much an owner values the chance of competing bids against privacy, a flexible closing date, no commission, no closing costs and no inspections or repairs.
Frequently Asked Questions
Is the Green Valley Ranch market slowing?
Days on market and inventory rose by about half on a year earlier, but the median price rose 11% and closed sales rose 2%. It is easing from a very fast pace.
How long do homes take to go under contract?
Sotheby's reports an average of 31 days on market for the second quarter of 2026.
Does the Census describe Green Valley Ranch alone?
No. The postal area is much larger and includes other neighborhoods.
Does the Las Vegas metropolitan data describe Green Valley Ranch?
No. It covers a large region and shows direction only.
Does a private sale always beat a public listing?
No. A public listing can attract competing bids. A private sale offers privacy, a flexible closing date, no commission, no closing costs and no inspections or repairs, in exchange for a single offer.
Compare your options before committing. Request a written private offer for your property, with no obligation, then weigh it against your listing plan.
Sources
- Sotheby's International Realty, 2026. Green Valley Ranch Market Update, Q2 2026. https://marketupdates.sothebysrealty.com/marketupdate/lasvegassir/henderson/green_valley_ranch.
- U.S. Census Bureau, 2026. American Community Survey 2020-2024 five-year estimates, the Green Valley Ranch area (via Census Reporter). https://censusreporter.org/profiles/86000US89012-89012/.
- Realtor.com, 2026. Housing Inventory: Median Days on Market in Las Vegas-Henderson-Paradise, NV (CBSA). https://fred.stlouisfed.org/series/MEDDAYONMAR29820.
- Realtor.com, 2026. Housing Inventory: Active Listing Count in Las Vegas-Henderson-Paradise, NV (CBSA). https://fred.stlouisfed.org/series/ACTLISCOU29820.
- Realtor.com, 2026. Housing Inventory: Price Reduced Count in Las Vegas-Henderson-Paradise, NV (CBSA). https://fred.stlouisfed.org/series/PRIREDCOU29820.
- Realtor.com, 2026. Housing Inventory: New Listing Count in Las Vegas-Henderson-Paradise, NV (CBSA). https://fred.stlouisfed.org/series/NEWLISCOU29820.
- Realtor.com, 2026. Housing Inventory: Median Listing Price in Las Vegas-Henderson-Paradise, NV (CBSA). https://fred.stlouisfed.org/series/MEDLISPRI29820.
Related research

Seller Guide · October 6, 2026
How to Prepare Point Pleasant Beach Rental Records Before Selling
Separate rental approval, income history and booked stays before comparing sale terms.

Seller Guide · October 6, 2026
How to Prepare Rumson Flood and Waterfront Records Before Selling
Separate flood disclosure, elevation, repairs and waterfront rights before comparing sale terms.

Seller Guide · October 6, 2026
How to Prepare Sarasota Condo Inspection and Reserve Records Before Selling
Separate building condition, reserve funding and resale documents before comparing sale terms.