Market Brief · by Aidan Sowa · October 5, 2026
What Does Seasonal Housing Tell a Brigantine Seller About Prices? Reading the Seasonal Homes, the Timing and the Owner Costs
Brigantine seasonal housing, dated prices and owner costs, for sellers comparing a listing with a direct offer.
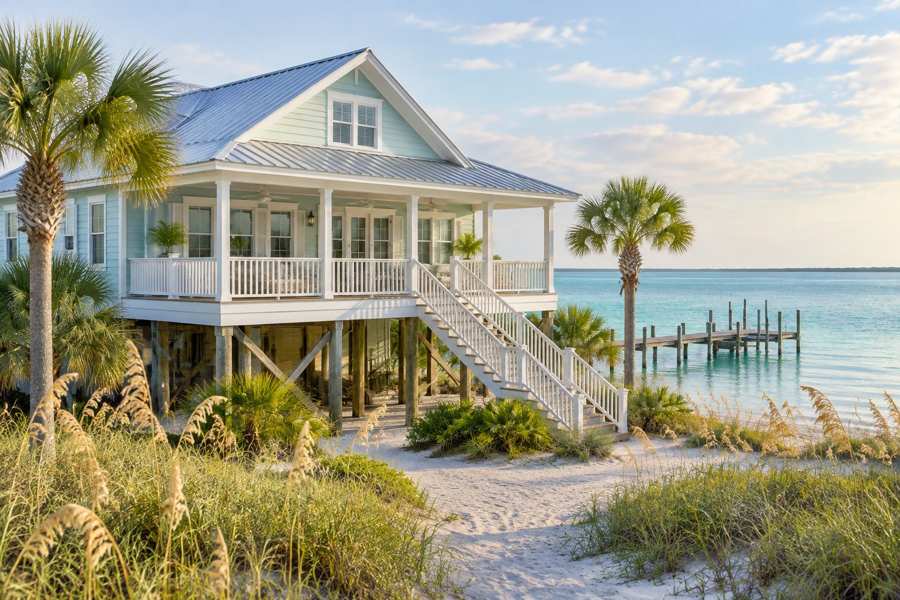
What does seasonal housing tell a Brigantine seller about prices? The postal survey counts 9,518 units, with 5,150 classified seasonal, recreational or occasional, or 54.1% of all housing. Another 4,043 units are occupied under Census residence rules. These categories do not establish full-year occupancy, short-term rental use or the properties behind a sold median.
Redfin's page for the postal area, whose latest month is January 2026, shows a median sale price of $655,000 and a median of 124 days on the market. Realtor.com's page, with key indicators as of March 2026, shows a median listing price of $624,900 and a median of 50 days on the market. The Census median owner value is $524,800, plus or minus $56,267. Redfin's sale median is 24.8% above the Census value, taking the Census as the base.
Seasonal classifications add context, not proof of a different sales clock or why prices move. The pages concern distinct dated populations. The sections below separate stock, prices, marketing and household costs before an owner compares matching closed records, written conditions and cash remaining under each offer.
Key Findings
- Redfin's page, whose latest month is January 2026, shows a median sale price of $655,000, up 10.5% on the year, a median sale price per square foot of $472, down 3.6%, 69 homes sold, up 50.0% from 46, a median of 124 days on the market against 85, a sale-to-list ratio of 96.4%, up 0.1 points, and 14.5% of homes sold above list, up 8.0 points (Redfin, Brigantine postal area).
- Realtor.com's March table reports $624,900 listed, down 0.65% annually and up 1.61% over three years, 106 listings, down 41.67% annually, fifty days, up 16.28%, thirty-four rentals and $2,125 asking rent. No sold median is supplied.
- Census residence classifications do not identify which homes sold, where seasonal owners live or how often those units are used. No city-level Zillow value substitutes for this postal area.
- The Census counts 9,518 housing units, 4,043 occupied, 3,104 by owners and 939 by renters, and 5,475 vacant, of which 5,150 are seasonal. The median build year is 1979, the median owner value is $524,800, plus or minus $56,267, the median household income is $97,250, plus or minus $16,993, and the median gross rent is $1,517, plus or minus $128.
- The postal survey describes seasonal use at 54.1% of units. Market days, pending and complete closing time differ; the dated medians are not a guaranteed closing schedule or evidence of why any owner sells.
How many Brigantine homes are shore homes used only part of the year?
The count is the most striking in the Census table. Of 9,518 housing units, 5,475, or 57.5%, are vacant, and 5,150 of those are held for seasonal, recreational or occasional use, which is 94.1% of vacant units and 54.1% of all units. Only 4,043 units, 42.5%, are occupied. Seasonal homes outnumber occupied homes by about 1.3 to one, computed from the Census counts.
The rest of the vacancy is small. Another 183 units are for rent, 85 are for sale only, 30 are sold but not yet occupied and 27 are vacant for other reasons. None are counted as rented but not yet occupied. Against 5,150 seasonal homes, the 85 units for sale only are a tiny group, and the Census does not say who holds the seasonal homes, how often they are used or whether they are let for short stays. The brief draws no conclusion.
Census vacation-home guidance counts a stay of at least two months from interview as current residence. Shorter stays can be temporarily occupied yet classified vacant. The pooled seasonal count therefore is not a single day of empty homes, an Airbnb inventory or proof nobody stays there. Neither seasonal nor occupied status identifies second-home sellers. The survey does not connect use categories to the closed transactions or measure a different seasonal sales clock.
The stock itself is of middle age. Of 9,518 units, 366 were built before 1940, 331 in the 1940s, 1,505 in the 1950s, 1,283 in the 1960s and 1,462 in the 1970s, so 4,947, or 52.0%, were built before 1980. The 1980s are the largest group at 2,617, or 27.5%. Another 630 were built in the 1990s, 789 in the 2000s, 391 in the 2010s and 144 in 2020 or later. The median build year is 1979.
Detached houses are half of the units. Of 9,518 units, 4,794, or 50.4%, are detached houses and 1,126, or 11.8%, are attached houses. Buildings of two units hold 995, three or four units hold 777, five to nine hold 301, ten to nineteen hold 526, twenty to forty-nine hold 383 and fifty or more hold 616, so buildings of five or more hold 1,826, or 19.2%. The Census table does not say which units are seasonal, so the brief does not link type to use.
Stock counts do not identify the mix behind sold medians. Building size does not establish condominium ownership, and separate tenure and use tables cannot match every type to occupied or seasonal status. Compare closed records with known type, size, ownership, condition, setting and terms. Neither listed nor closed medians value one home. A seasonal classification or construction year does not diagnose condition, repair needs or the urgency of the owner.
Sources as cited. Shares and ratios are computed from the Census counts.
What do the Brigantine price pages show, and how current are they?
Three price figures are on the table, with different dates and measures. Redfin's median sale price is $655,000 for January 2026, its latest month. Realtor.com's median listing price is $624,900 as of March 2026. The Census median owner value is $524,800, a five-year survey estimate with a margin of error of $56,267, or 10.7% of the value, which remains attached. Redfin's page is the older of the two market pages, by two months.
Taking the Census as the base, Redfin's sale median is 24.8% above it and Realtor.com's listing median is 19.1% above it. Taking Redfin as the base, Realtor.com's listing median is 4.6% below it. The three sit in a range of about $130,000, and the survey figure is the lowest. Realtor.com's page offers no median sold price, so no direct sale-to-sale comparison is possible between pages.
Redfin's sold median is up 10.5% annually. Realtor.com's listing median is down 0.65% annually and up 1.61% over three years. These are distinct measures and periods, not evidence of matching-property appreciation. A winter label does not establish a small sample or explain a median's movement. Values reconstructed from rounded growth rates would be approximate rather than independently observed earlier medians. Keep the actual annual and three-year headings attached rather than turn the figures into monthly changes.
Redfin reports $472 per foot, down 3.6% annually. Realtor.com reports $503, down 4.55% annually and up 17.52% over three years. Realtor.com's research library defines median listing price per foot as a listed-home measure. Comparing it with sold properties does not establish a premium on matching homes or show a change in the size, condition or mix of sales. Total-price and per-foot medians cannot by themselves explain why each moved.
A flag applies to Realtor.com's text. The overview says the area has a median home sale price of $624.9K, which is the listing median, and mixes the labels, so the brief uses the table. Its quick insights call a month-on-month change of 4.32% a change in the median sale price, though it is the listing median. Zillow's pages for Brigantine are at the city level only and are not used.
Census owner value has a separate meaning. The ACS subject guide asks owners what the house and lot would sell for if on sale, rather than recording an appraisal or closing. Its margin of error cannot alone test the difference from an unmatched sale median. The pages do not provide a common set of transactions that would establish a winter versus summer pricing effect. Compare matching recent records and retain actual dates rather than assume a seasonal cause or average unlike measures.
| Source | Figure | What it measures |
|---|---|---|
| Redfin | $655,000, up 10.5% | Median sale price, January 2026 (oldest page) |
| Census Reporter | $524,800 | Median owner value, pooled period ending 2024; margin of error $56,267';s['src']='Sources as cited. Numerical differences compare distinct published measures, not matching homes. |
| Realtor.com | $624,900, down 0.65% | Median listing price, March 2026 |
Sources as cited. Earlier values and differences are computed from the published percentages.
How slowly do Brigantine homes sell, and what do sellers get against asking?
Slowly, in the winter figures. Redfin shows a median of 124 days on the market for January 2026, against 85 a year before, a rise of 39 days, with the average home selling about 4% below list and going pending in about 126 days. It says multiple offers are rare, and that hot homes sell about 1% below list and go pending in about 75 days. Realtor.com shows a median of 50 days for March 2026, up 16.28% on the year, which implies about 43 days a year before, and up 47.06% on three years, which implies about 34 days three years before.
Redfin's 124 days and Realtor.com's fifty have separate dates and definitions, not a clean trend. Redfin's Metrics Definitions separates contract-acceptance days from days to close; Realtor.com's library describes listing time through closing or removal. Redfin's methodology explains rolling windows for smaller geographies, but this old page explicitly labels January 2026 and is retained as displayed. Current access does not make it recent evidence or prove a complete-sale schedule. Similar below-list measures do not guarantee a deadline.
Redfin's 96.4% ratio averages individual closed-home ratios against final list price, not original asking or a ratio of postal medians. Its 14.5% above-list share concerns sold homes and does not measure every strong offer. A 3.6% arithmetic difference from one hundred percent is not a promised concession on a matching property. The measures do not establish why a home sold or what one seller should accept. Use actual comparable records and written offer terms.
Realtor.com reports 106 listings, down 41.67% annually and 14.95% over three years. Redfin's sixty-nine January sales are up fifty percent from forty-six, but the older sales and later listing population do not establish a synchronized supply-demand change. Dividing listings by the older survey's 4,043 occupied homes gives 2.6%, or 1.1% against all units. Neither is months of supply, a vacancy rate or an identified overlap with survey homes.
A direct purchase can change marketing obligations, but a closing date and remaining conditions need written terms. Neither a listing nor a direct offer is automatic certainty or a promise of better proceeds. Check marketing, acceptance and closing dates on matching records, and compare condition requirements and charges under each proposal. The postal median cannot determine the cash cost of waiting for one property or establish which route meets a deadline.
A median does not show the spread of waiting times or the chance of missing a deadline. These pages do not substantiate a distribution of sales in weeks versus months. Redfin says multiple offers are rare, but this is not a property-specific prediction. Plan separately for getting an acceptable offer and completing a sale, with contingencies and agreed timing stated in writing. A competition label does not explain the outcome of every transaction.
Sources as cited. Marketing, contract and closing measures retain separate definitions and periods.
What do occupied Brigantine households report about housing costs?
The population is 7,674, plus or minus thirty. Ages forty-five to sixty-four account for 2,674 residents and sixty-five or older for 2,769. Together they are 70.9% of the population under residence rules, not verified full-year residents or identified sellers.
Of 4,043 occupied homes, 3,104, or 76.8%, are owned and 939, or 23.2%, are rented. Owners arrived over a long span: of 3,104 owner homes, 45 were taken up in 2023 or later, 474 in 2020 to 2022, 1,017 in the 2010s, 658 in the 2000s, 368 in the 1990s and 542 before 1990. That puts 29.3% of owners in place since before 2000, and 16.7% arriving in 2020 or later. Recent renter move-ins do not establish future turnover: 197 of 939, or 21.0%, arrived in 2020 or later.
Owners live in mid-sized homes. Of 3,104 owner homes, 1,412 have three bedrooms, 45.5%, 612 have two, 595 have four, 345 have five or more, 119 have one and 21 have none. Renters live in smaller homes: of 939, 408 have two bedrooms, 208 have one, 205 have three, 66 have four, 35 have none and 17 have five or more.
Owner costs vary. Among owners with a mortgage, 1,749 homes have a computed share, and 648, or 37.0%, pay 30% or more of income on owner costs and 285, or 16.3%, pay half or more. Of 1,338 owners without a mortgage with a computed share, 339, or 25.3%, pay 30% or more and 117, or 8.7%, pay half or more, Census selected owner costs include applicable taxes, insurance, utilities and specified charges, not general upkeep. Mortgage-free does not mean cost-free. Renters more often cross the income-share threshold, not necessarily higher dollar costs for matching households: of 882 renter homes with a computed share, 531, or 60.2%, pay 30% or more and 347, or 39.3%, pay half or more.
The median household income is $97,250, plus or minus $16,993. Realtor.com's $2,125 asking-rent median is down fifteen percent annually and 21.30% over three years. Its thirty-four rentals and rounded growth rates should not reconstruct exact earlier counts or prove the percentages wrong. Census gross rent is $1,517, plus or minus $128. The subject guide includes specified utilities and fuels paid separately by renters. This pooled occupied-rental measure is not the same population or definition as March's asking-rent median.
The cost shares describe occupied households under residence rules, not verified full-year residents or the costs of identified seasonal properties. ACS guidance explains that five-year estimates pool sixty months and trade currency for precision in smaller areas. These 2020-2024 estimates are not current households or a panel following the same household across cost bands. Income shares do not explain why an owner sells. Readers can compare the Belmar brief and the Ocean City brief.
Sources as cited. Shares and ratios are computed from the Census counts.
What should a Brigantine owner ask before choosing a listing or a private sale?
Keep four questions separate: what matching closed records show, how marketing and closing could fit your deadline, what known condition and contract obligations involve, and what agreed costs do to proceeds. Seasonal classifications, age bands and demographic groups cannot identify seller urgency or a repair budget. Compare property records and written proposals rather than assume a coastal property condition or treat postal medians as a valuation and schedule.
For illustration, one, three or five percent of a $725,000 price is $7,250, $21,750 or $36,250. These are arithmetic examples, not commission quotes or a valuation. Actual costs depend on agreement. CFPB guidance explains that mortgage payoff can differ from current balance because it includes interest through the payoff date and may include fees or a prepayment penalty. Obtain a dated payoff statement. Compare cash remaining under written offers, including charges not covered by the buyer, instead of subtracting only a headline commission.
Maison Off-Market describes a direct purchase with no public showings, flexible closing, no commissions or seller closing costs, and no seller inspections or repairs. Those terms can suit owners who live elsewhere, but do not establish a higher net result. Compare who pays each charge, remaining conditions and closing dates with a realistic listing alternative. Privacy is a choice about how the sale is conducted, not a promise about what every neighbor knows. Condition can affect price even without seller repair obligations.
Maison Off-Market buys luxury homes and estates directly from their owners and speaks only to sellers. An owner who wants to see what a direct purchase would look like, with no public listing and no showings, can use the contact form below and ask for an offer before deciding.
Sources as cited. Fee figures are arithmetic and not quoted rates.
Methodology and limitations
Redfin's January and Realtor.com's March pages are two months apart. Current access does not update their periods. Realtor.com gives no sold median; its listing price and per-foot figures are mislabeled as sale measures in some prose. Those specific mislabels remain flagged. Its table uses annual and three-year headings, not monthly and annual. Fractional counts reconstructed from rounded growth rates do not independently establish errors. No neighborhood or city-level Zillow value replaces postal data.
ACS estimates pool sixty months. These 2020-2024 postal figures are not current households or a single-day inventory. Margins remain attached; counts and shares were checked against totals. Owner value is a survey response, gross rent includes specified utilities and selected owner costs do not mean upkeep. Vacancy follows residence rules, which do not establish full-year occupancy. Building type, tenure and seasonal use are separate aggregates, not matched attributes of the properties that sold. No figure is a forecast.
Conclusion
The Brigantine postal survey describes seasonal use at 54.1% of units and owners at 76.8% of occupied housing. It does not identify second-home sellers, verified year-round residents or the properties behind a sold median. Dated prices and timing need matching records and written terms before an owner uses them for a decision. Compare condition, marketing and closing risks, and agreed costs rather than treating postal medians as a valuation or deadline.
Frequently Asked Questions
How many Brigantine homes are seasonal?
The Census counts 5,150 of 9,518 housing units in the postal area, 54.1%, as vacant and held for seasonal, recreational or occasional use. These pooled classifications do not establish full-year occupancy or identified short-term rentals.
What is the median home price in Brigantine?
The sources differ. Redfin showed a median sale price of $655,000 for January 2026, Realtor.com showed a median listing price of $624,900 for March 2026, and the Census median owner value is $524,800.
How long do Brigantine homes take to sell?
Redfin showed a median of 124 days on the market for January 2026, and Realtor.com showed 50 days for March 2026. Neither is a guaranteed full-closing schedule.
How many Brigantine homes are owner-occupied?
The Census counts 3,104 of 4,043 occupied homes in the postal area, 76.8%, as owned.
Can I sell my Brigantine home privately?
Maison Off-Market describes direct purchases with no showings, flexible closing, no commissions or seller closing costs, and no seller inspections or repairs. Compare written terms and net proceeds with a listing.
Compare your options before committing. Request a written private offer for your property, with no obligation, then weigh it against your listing plan.
Sources
- Redfin, January 2026, older page; checked October 6, 2026. Postal housing market: prices and timing. https://www.redfin.com/zipcode/08203/housing-market.
- Realtor.com, March 2026; checked October 6, 2026. Brigantine postal housing market data. https://www.realtor.com/local/market/new-jersey/zipcode-08203.
- U.S. Census Bureau via Census Reporter, 2020-2024 ACS five-year estimates; checked October 6, 2026. Postal housing and population estimates. https://censusreporter.org/profiles/86000US08203-08203/.
- Redfin, Checked October 6, 2026. Housing-data methodology: geography and reporting windows. https://www.redfin.com/news/data-center/methodology/.
- Redfin, Checked October 6, 2026. Metrics Definitions: final-list ratios and contract timing. https://www.redfin.com/news/data-center-metrics-definitions/.
- Realtor.com Research, Checked October 6, 2026. Residential data library: listing prices and timing. https://www.realtor.com/research/data/.
- U.S. Census Bureau, Checked October 6, 2026. Choosing ACS estimates: pooled periods and precision. https://www.census.gov/programs-surveys/acs/guidance/estimates.html.
- U.S. Census Bureau, Checked October 6, 2026. Selected monthly owner costs: included charges. https://www.census.gov/quickfacts/note/HSG650222.
- U.S. Census Bureau, Checked October 6, 2026. How ACS counts vacation homes. https://www.census.gov/help/topics/faq.how-does-the-acs-count-vacation-homes.html.
- U.S. Census Bureau, Checked October 6, 2026. ACS subject definitions: owner value. https://www2.census.gov/programs-surveys/acs/tech_docs/subject_definitions/2024_ACSSubjectDefinitions.pdf.
- Consumer Financial Protection Bureau, Checked October 6, 2026. Payoff amount versus current mortgage balance. https://www.consumerfinance.gov/ask-cfpb/what-is-a-payoff-amount-and-is-it-the-same-as-my-current-balance-en-205/.
Related research

Seller Guide · October 6, 2026
How to Prepare Point Pleasant Beach Rental Records Before Selling
Separate rental approval, income history and booked stays before comparing sale terms.

Seller Guide · October 6, 2026
How to Prepare Rumson Flood and Waterfront Records Before Selling
Separate flood disclosure, elevation, repairs and waterfront rights before comparing sale terms.

Seller Guide · October 6, 2026
How to Prepare Sarasota Condo Inspection and Reserve Records Before Selling
Separate building condition, reserve funding and resale documents before comparing sale terms.