Market Brief · by Aidan Sowa · October 5, 2026
Is the Magic Postal Code Still Magic? Reading the Mail Line and the School Line
Reading the Mail Line and the School Line for Magic ZIP (Scottsdale and Phoenix border), AZ, with each source dated and its limits noted, for owners weighing a listing against a direct sale.
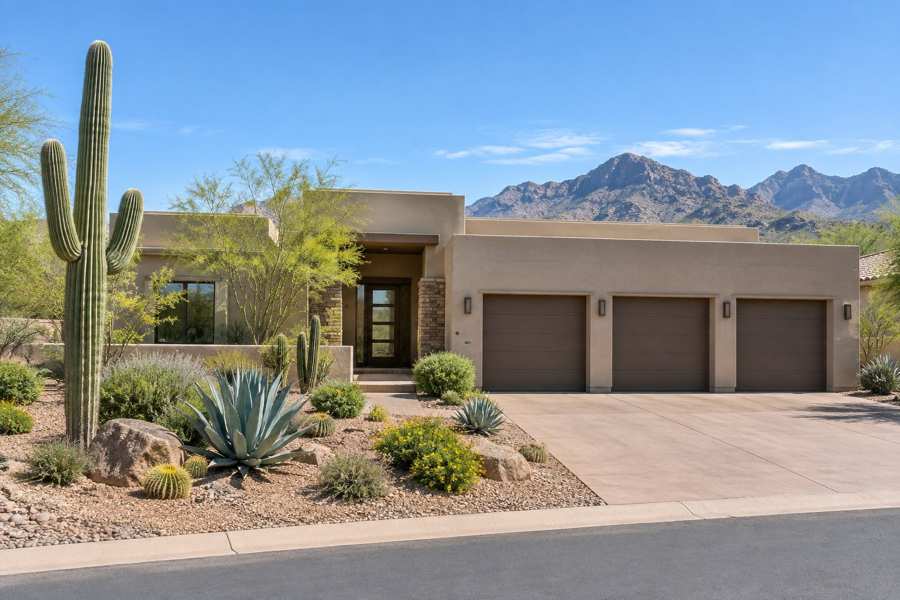
Some postal areas have a number. This one has a nickname. Local agents call it the magic postal code, and a June 2026 television segment explained why: a Scottsdale mailing address, the Paradise Valley Unified School District and the tax rates of the City of Phoenix, all in one place. The pitch to sellers is that the combination draws buyers who want the prestige of one city and the carrying costs of another.
The pitch deserves a careful reading, because each of the three lines follows a different map. The mail line follows the post office. The school line follows a district boundary that, as one news report noted, does not overlap with the town of Paradise Valley. The tax line follows the city limits. A seller who says the address is magic should be able to say which line he means, and what each is worth.
This brief reads the claims against what the sources actually say. It uses a 2026 television report, a 2025 local news feature that quotes agents who disagree about the nickname, a first-half 2026 sales analysis for the central Scottsdale area, a broker's fall 2026 note that claims 7% appreciation, the Census profile of the postal area, and the Phoenix metropolitan listing series from Realtor.com. Its limits are plain: the price figures are brokerage commentary, the Census figures cover a postal area, and nothing here prices a home or gives tax advice.
Key Findings
- A June 2026 television report described the area as combining a Scottsdale mailing address, the Paradise Valley Unified School District and City of Phoenix tax rates (AZFamily, June 2026).
- An October 2025 news feature quoted one agent calling the nickname a social term, another calling it a marketing gimmick, and described the area as roughly bounded by Frank Lloyd Wright Boulevard, Shea Boulevard, Scottsdale Road and Tatum Boulevard, with a median household income near $121,000 (Phoenix New Times, October 2025).
- A first-half 2026 sales analysis of the central Scottsdale area that includes Kierland reported 359 single-family sales, up 16%, at an average of $1,196,986, up 2%, with volume up 18% (Sostman, 2026).
- A broker's fall 2026 note claimed a median sale price between $925,000 and $950,000 and appreciation near 7%, against 2% to 4% for Scottsdale as a whole (Ramsey, 2026).
- In the Census postal area, median household income is $123,203 and 72.0% of occupied homes are owner-occupied (U.S. Census Bureau, 2020-2024).
Which of the three lines does a buyer pay for?
The television report states the combination as three boxes checked at once: a Scottsdale mailing address, the Paradise Valley Unified School District and City of Phoenix tax rates. It says the mix has made the area a hidden gem for families and investors, offering the prestige of a Scottsdale address with significant cost savings. The segment does not give a dollar figure for the savings, and neither does any source used in this brief.
The news feature from 2025 is more skeptical about the first line. A commenter it quotes says postal addresses are not strictly attached to municipal borders and are just a shorthand to help the post office sort mail, so the Scottsdale address probably has nothing to do with it. The agents it quotes put the magic in other places: the blend of neighborhood, schools and access to shopping, well-cared-for streets with fewer homeowner associations, and Phoenix taxes. One agent calls it a social term. Another says it is a marketing gimmick that first appeared during the pandemic, when the area was cheaper and carried the promise of new shopping and entertainment.
The boundary description in the news feature is worth keeping. It places the area between Frank Lloyd Wright Boulevard to the north and Shea Boulevard to the south, bounded roughly by Scottsdale Road on the east and Tatum Boulevard on the west. That is a rectangle of arterial roads, a few miles across. Inside it, the city line, the school line and the post office line do not all coincide, and a house on one side of a street can differ from a house across it. A buyer who relies on the nickname without checking the parcel can be wrong about which line applies.
For a seller the useful distinction is between lines that carry a cost and lines that carry a label. The tax line and the school line show up on bills and on enrollment forms. The mail line shows up on the envelope. A buyer may value the label, and some buyers do, but a buyer cannot get a lower tax bill from it. A seller who describes the tax line should bring the actual bill, not the nickname.
The same feature notes a trade-off. A resident quoted in it says that community programs run by the neighboring city, such as pool passes and recreation classes, can cost more for people who live in the other city's limits. That is one commenter's account and it was not checked, but it shows that a line that saves money on one bill can cost money on another.
Source: AZFamily, June 25, 2026; Phoenix New Times, October 29, 2025. The recreation cost remark is one commenter's statement and was not verified.
Do the two price stories agree?
They do not, and the gap is instructive. The broker's note from the fall says the area's median sale price has been trending near $925,000 to $950,000, against $830,000 to $860,000 for Scottsdale as a whole, and that the area has been appreciating near 7% while the city gains 2% to 4%. It credits tight inventory and the pull of the Kierland and Scottsdale Quarter hubs.
The first-half analysis, built from the Arizona multiple listing service for January through June 2026, reads the same corridor differently. It reports 359 single-family sales, 16% more than a year earlier, at an average price of $1,196,986, up 2%, and volume up 18%. It puts the whole of Scottsdale at 2,487 sales, an average of $1,722,519, up 4%, a sale-to-list ratio of 97% and 83 days to close, up from 76. It describes the central corridor as a market in which more homes sold at a modestly higher price.
Here is how the two could both be true. Suppose that over a year a corridor sells ten homes at $800,000 each and one at $4,000,000. The average is about $1,090,900 and the median is $800,000. If the next year the expensive sale is $4,400,000 and the others do not change, the average rises by about 3.3% and the median does not move. Averages jump on single sales, medians do not, and a broker who wants a bigger number has an incentive to choose the one that moves. This is arithmetic, not an accusation, and it applies to every source in this series.
Two things differ. The first is the statistic: the note uses a median, and the analysis uses an average. The second is the period and the sample, which the note does not specify. An average of $1,196,986 and a median near $937,500 are not in conflict, because an average is pulled up by expensive sales. The 7% and the 2% are harder to reconcile, and the honest answer is that they measure different things over different spans. An owner who hears either number should ask what was measured.
The analysis adds that days to close lengthened almost everywhere in Scottsdale, from 76 to 83 for the city. For the central corridor, a seller should read that as a small increase in the time from contract to closing, not as a drop in demand. The figure counts the time to close and not the time on the market, so it includes escrow. A seller who is planning a move should add that to the listing period.
The analysis makes a point that applies here. It says averages across a city hide the story, and that knowing which description fits your street is the difference between pricing well and guessing. The central corridor sold more homes and the price moved a little. That is a steady market, not a surge, and a seller who counts on 7% may be disappointed.
Source: Brian Ramsey, Equity Star Realty, 2026; Anne Sostman, The Brokery, 2026, citing Arizona multiple listing service sold data for January 1 to June 30, 2026. Brokerage content, not independently verified.
What does the Census say about the people?
The postal area has 45,558 residents and 21,914 housing units, of which 19,533 are occupied. Owners live in 14,071 homes (72.0% of occupied) and renters in 5,462 (28.0%). Median household income is $123,203, close to the news feature's figure of nearly $121,000 and well above the $77,000 it cites for Phoenix as a whole. Median gross rent is $2,156 a month, or $25,872 a year, which is 21.0% of the median income.
Owners estimate the median home at $785,700, with a margin of error of $25,171, about 3.2%. Because that estimate pools several years and covers all home types, it sits below the broker's median claim of $925,000 to $950,000 for recent sales. The distance is about $140,000 to $165,000, or 18% to 21% of the Census figure, which gives a sense of how far recent sale prices run ahead of what owners think their homes are worth.
The age profile is a stock built in one long wave. The 1980s account for 7,334 units (33.5%), the 1970s for 5,420 (24.7%) and the 1990s for 5,044 (23.0%). Homes built since 2020 number 339, 1.5%. The median year built is 1986, and 28.8% of units predate 1980. The agent in the news feature who attributes the appeal to larger lots and fewer associations is describing this stock: homes from a period when lots were generous and associations were less common.
Income and rent give another view of the people nearby. A household that earns $123,203 and pays $25,872 a year in rent spends about one dollar in five on housing, a comfortable ratio. That is why renters here are plausible buyers, and why an investor who owns a rental in the area has options. The vacancy of 10.9%, 2,381 units, includes second homes and units between tenants. The Census does not separate them.
The average shopper also forgets that the postal area is large. With 21,914 housing units and 45,558 residents, it holds more homes than many small cities, and the central corridor sale counts quoted above, 359 sales in six months, are about 1.6% of the units. Turnover at that pace means a typical home changes hands about once in thirty years. A seller in this stock is rare, and a buyer who wants this address has few choices, which is the strongest argument for the broker's claim of tight supply.
Fewer associations means fewer fees and also fewer rules. For a seller, that is a selling point to be documented, not asserted. If the property has no association, say so, and say what the property tax bill is. A buyer who can compare real figures does not need the nickname.
| Indicator | Value | Note |
|---|---|---|
| Population | 45,558 | Whole postal area |
| Housing units | 21,914 | All units |
| Owner-occupied homes | 14,071 | 72.0% of occupied |
| Renter-occupied homes | 5,462 | 28.0% of occupied |
| No usual resident | 2,381 | 10.9% of all units |
| Median household income | $123,203 | Estimate |
| Median gross rent | $2,156 | Monthly |
| Owner-estimated median value | $785,700 | Margin of error $25,171 |
Source: U.S. Census Bureau, American Community Survey 2020-2024 five-year estimates, tables B01003, B19013, B25003, B25034, B25064 and B25077.
Is fall the right season, as the note says?
The broker's note calls fall the Goldilocks season for sellers in the desert, for three reasons. Seasonal residents return as the temperature drops below triple digits and are often cash-heavy buyers looking for a quick transition. Families want to be settled before the spring semester, so a fall listing catches buyers motivated to close by December. And the people who tour in fall are, in the writer's words, the ones ready to sign, not the ones browsing online out of summer boredom.
These are the broker's observations, not measurements, and the notes in this series that cite listing data give a mixed picture. The Phoenix metropolitan median days on market rose from 60 in May to 67 in July and August and eased to 62 in September, which fits a market that was slowest in midsummer and improved a little in the fall. That is one metropolitan series and it does not isolate this area, but it does not contradict the broker's claim.
The note also points to features that it says command a premium in 2026: updated pool equipment and outdoor kitchens, two distinct workspaces for hybrid work, and recent cooling system upgrades or solar. Those are opinions from one broker, and they fit the stock, since homes from the 1980s often have older systems. A seller choosing between spending money on a new cooling unit and selling as is should compare the cost with the price difference a buyer would apply, which is a number a buyer can quote.
A seller who wants to use the fall has to be ready before September. The note suggests a three-step plan: a walk-through to learn which repairs return their cost, a snapshot of every sold and pending sign within a mile, and a look at equity to see how much cash would be left after a sale. The first step is the one that matters most, because repairs are the part of the plan that takes weeks.
A private sale does not follow the season. A buyer who purchases homes off the market can close in October or in July, and the seller does not need to wait for the temperature to drop. For an owner whose reason to sell is a job, a family change or a plan that has a date, the date is the fact that matters.
Source: Brian Ramsey, Equity Star Realty, 2026; Realtor.com via FRED. The seasonal points are the broker's opinions and were not independently verified.
What does the Phoenix metro clock say?
Realtor.com publishes listing series for the Phoenix, Mesa and Scottsdale metropolitan area through the Federal Reserve Bank of St. Louis. They show direction and not the level for this postal area. The median days on market was 60 in May 2026, 64 in June, 67 in July and August, and 62 in September.
Active listings were 19,517 in May and 18,437 in September (Realtor.com, active listings), a fall of 5.5%, with a low of 17,661 in July. The median listing price slipped from $498,000 in May to $475,000 in September (Realtor.com, median listing price), a decline of 4.6%.
A metropolitan asking price of $475,000 is far below the $925,000 to $950,000 that the broker cites for the nickname's area, and well below the Census owner estimate of $785,700. The distance is the point: the area is a premium pocket in a large market, and the metro series show the direction of the whole, not the level of the pocket. Asking prices in the metro slipped a little through the summer, and an owner in the pocket should assume that buyers have noticed.
None of these series says whether the nickname adds to the price. This brief does not claim that it does. The data that would test the claim, sale prices for matched homes on either side of a city boundary, is not in the sources used here. Readers comparing markets can also read the Scottsdale Airpark brief and the Troon brief.
Source: Realtor.com via FRED, Housing Inventory: Median Days on Market, Active Listing Count and Median Listing Price, Phoenix-Mesa-Scottsdale, AZ (CBSA).
What would a private sale change here?
A direct sale to a buyer who purchases homes off the market changes five things for the seller. There are no showings and no neighbors talking about you selling, which is the privacy benefit. The closing date can be flexible, giving time to find a new home. There are no commission costs and no closing costs for the seller. And there are no inspections or repairs, which matters for a stock where much of the housing is forty years old.
The fee benefit needs no assumed rate. For every 1% of a sale price that would otherwise go to fees, a sale at $785,700 keeps $7,857, a sale at $937,500 keeps $9,375 and a sale at $1,196,986 keeps about $11,970. An owner can set whatever percentage applies against a private offer and compare the two on net proceeds.
The nickname matters less to a private buyer than to a public one. A buyer who looks at many homes off the market compares the actual taxes, the lot and the condition, and does not need the label to find the house. A seller who does not want to run a campaign built on a nickname that agents themselves dispute may find the private route simpler.
The trade-off is the usual one. A public listing can bring competing bids, and some buyers will pay for the label. A private sale brings one offer, on a date the seller chooses. An owner who values privacy, a settled date and freedom from repairs may prefer it. The choice belongs to the owner.
Source: calculation from stated prices; no commission rate or closing cost is assumed.
Methodology and limitations
Age, tenure, vacancy, income, rent, population and owner-estimated value come from the American Community Survey 2020-2024 five-year estimates for the postal-code area nicknamed the magic postal code. Shares are calculated from published counts, and owner-estimated value carries a stated margin of error.
Days on market, active listings and median listing price are Realtor.com series published by the Federal Reserve Bank of St. Louis for the Phoenix-Mesa-Scottsdale metropolitan area. The series end in September 2026 and listing prices are asking prices and not sale prices.
The television report, the news feature, the sales analysis and the broker's note are the sources of every claim about the nickname, the three lines and prices, and none was independently verified. No tax or school boundary was checked against government records, and this brief does not give tax advice. It makes no forecast and does not estimate what any particular home would sell for.
Conclusion
The public record supports a short list for an owner in this area. The nickname refers to three lines that follow three different maps, agents disagree on whether it means anything, two 2026 price descriptions of the same corridor differ by five percentage points, and the stock is a long wave of homes from the 1970s to the 1990s.
It does not support a price for any one home, and it does not support a forecast. The choice between a public listing and a private sale comes down to how much an owner values a possible higher price against privacy, a flexible closing date, no commission, no closing costs and no inspections or repairs.
Frequently Asked Questions
What makes the postal area magic?
Agents cite a Scottsdale mailing address, a Paradise Valley school district and Phoenix city taxes. One agent quoted in 2025 called the nickname a marketing gimmick.
Do the sources give a tax saving?
No. None of the sources used here gives a dollar figure. An owner should check the actual tax bill.
Why do the price claims differ?
One source uses a median and an unspecified period, and another uses an average for January to June 2026. They measure different things.
Does the metro listing data describe this area?
No. It covers the whole Phoenix area and shows direction only.
Does a private sale always beat a public listing?
No. A public listing can attract competing bids. A private sale offers privacy, a flexible closing date, no commission, no closing costs and no inspections or repairs, in exchange for a single offer.
Compare your options before committing. Request a written private offer for your property, with no obligation, then weigh it against your listing plan.
Sources
- AZFamily Digital News Staff, 2026. Arizona's "Magic Zip Code" explained: Scottsdale address, Paradise Valley schools, Phoenix taxes. https://www.azfamily.com/2026/06/25/arizonas-magic-zip-code-explained-scottsdale-address-paradise-valley-schools-phoenix-taxes/.
- Cheyla Daverman, 2025. Realtors say this is Phoenix's magic ZIP code. What does that mean?. https://www.phoenixnewtimes.com/news/phoenix-has-magic-zip-code-realtors-whats-that-mean-40616601/.
- Anne Sostman, 2026. Scottsdale, Paradise Valley and Arcadia Market Data (H1 2026). https://annesostman.com/sellers/scottsdale-paradise-valley-arcadia-market-data.
- Brian Ramsey, 2026. The Micro-Market Report: Why This Magic Zip Code is Still Scottsdale's Sweet Spot for Fall 2026 Sellers. https://www.equitystarrealty.com/blog/The-85254-Micro-Market-Report--Why-This--Magic-Zip-Code--is-Still-Scottsdale-s-Sweet-Spot-for-Fall-2026-Sellers.
- U.S. Census Bureau, 2026. American Community Survey 2020-2024 five-year estimates, the Magic ZIP (Scottsdale and Phoenix border) area (via Census Reporter). https://censusreporter.org/profiles/86000US85254-85254/.
- Realtor.com, 2026. Housing Inventory: Active Listing Count in Phoenix-Mesa-Scottsdale, AZ (CBSA). https://fred.stlouisfed.org/series/ACTLISCOU38060.
- Realtor.com, 2026. Housing Inventory: Median Listing Price in Phoenix-Mesa-Scottsdale, AZ (CBSA). https://fred.stlouisfed.org/series/MEDLISPRI38060.
Related research

Seller Guide · October 6, 2026
How to Prepare Point Pleasant Beach Rental Records Before Selling
Separate rental approval, income history and booked stays before comparing sale terms.

Seller Guide · October 6, 2026
How to Prepare Rumson Flood and Waterfront Records Before Selling
Separate flood disclosure, elevation, repairs and waterfront rights before comparing sale terms.

Seller Guide · October 6, 2026
How to Prepare Sarasota Condo Inspection and Reserve Records Before Selling
Separate building condition, reserve funding and resale documents before comparing sale terms.