Market Brief · by Aidan Sowa · October 5, 2026
Is Wicker Park Selling Above List Because Buyers Are Many or Because Homes Are Few? Reading Redfin, Realtor.com, Zillow and the Census Count of Renters
Reading Redfin, Realtor.com, Zillow and the Census Count of Renters for Wicker Park, IL, with each source dated and its limits noted, for owners weighing a listing against a direct sale.
Is Wicker Park selling above list because buyers are many or because homes are few? The pages point to the second. Redfin's page for the postal area that includes Wicker Park, for the three months ending August 2026, shows a median sale price of $737,681, up 12.1%, a sale-to-list ratio of 103.5%, 61.8% of homes sold above list and 11.0% with price drops. Realtor.com's page for the same area, for June 2026, shows 170 active listings, down 29.36% in a year, and lists just 63 homes for sale in Wicker Park itself, with a median listing price of $729,900.
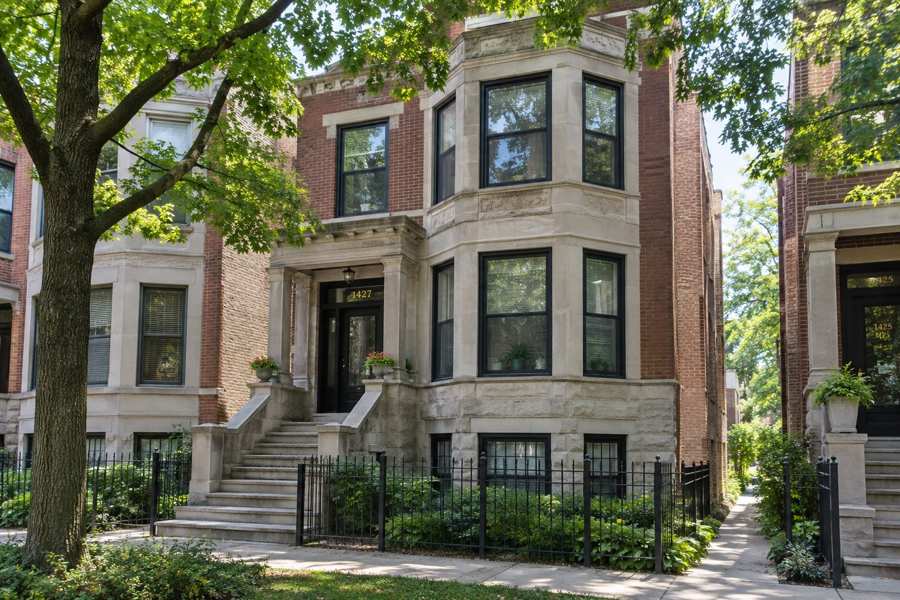
The neighborhood is a place of renters and old buildings. The Census counts 56.9% of occupied homes in the postal area as rented and 46.1% of all homes as built before 1940, and 35.7% of homes are in buildings of three or four units. Zillow's page for Wicker Park shows a home value index of $681,137, up 4.8%, but it was last updated on February 28, 2026, so it is the oldest figure here.
Maison Off-Market speaks only to sellers, and this brief is for an owner in Wicker Park. It uses the neighborhood name from the sheet and the Census postal area that the sheet lists for it, which also covers its neighbors. Every figure is dated and linked, the arithmetic is shown, and inferences are labeled.
Key Findings
- Redfin's page for the postal area, for the three months ending August 2026, showed a median sale price of $737,681, up 12.1% from the same period last year, $428 per square foot, up 23.0%, 253 homes sold in August, up 7.7%, and a median of 42 days on market, unchanged. The sale-to-list ratio was 103.5%, up 1.8 points, 61.8% of homes sold above list, up 9.9 points, and 11.0% had price drops, down 2.3 points (Redfin, postal area housing market).
- Realtor.com's page for the postal area, for June 2026, showed a median listing price of $675,000, up 6.72% in a year and up 0.68% in three years, a median sold price of $690,000, up 4.55% and up 17.45%, $406 per square foot, up 6% and up 13.54%, 170 active listings, down 29.36% and down 27.01%, a median of 29 days on market, up 8.70% and down 3.85%, 299 rental properties, down 23.18% and down 26.11%, and a median rent of $2,757, up 10.28% and up 20.66% (Realtor.com, postal area housing market).
- The same Realtor.com page lists the Wicker Park neighborhood on its own, with a median listing price of $729,900, $431 per square foot, a median monthly rent of $2,858, 63 homes for sale, up 5.26% in a year, 97 properties for rent, down 5.49% from the month before, and a median of 24 days on market, up 41.18% from the month before and up 2.13% in a year (Realtor.com, postal area neighborhood table).
- Zillow's page for Wicker Park showed a home value index of $681,137, up 4.8% over the past year. The page states that it was updated on February 28, 2026 (Zillow, Wicker Park home values). In the Census postal area, 28,216 housing units were counted, 26,486 occupied, 11,410 by owners and 15,076 by renters, 1,730 vacant, the median build year was 1952, the median owner value was $638,100, plus or minus $15,113, the median household income was $136,277 and the median rent was $2,010 (U.S. Census Bureau, American Community Survey 2020-2024 five-year estimates, tables B19013, B25004, B25034, B25064 and B25077).
- Of 54,609 people counted, 13.2% are under 18, 38.6% are 25 to 34 and 7.2% are 65 or older. Of owners with a mortgage, 23.1% spent 30% or more of income on housing and 10.3% spent half or more. Of renters with a computed figure, 32.6% spent 30% or more of income on rent (U.S. Census Bureau, American Community Survey 2020-2024 five-year estimates, tables B01001, B25070 and B25091).
Why do the Wicker Park price figures differ, and what do they agree on?
The levels are close. Redfin's median sale price is $737,681, Realtor.com's sold median is $690,000 and its listing median is $675,000, and Zillow's index is $681,137. Redfin's median is 6.9% above Realtor.com's sold median, computed here, and Zillow's index is 7.7% below Redfin's. The Wicker Park neighborhood's median listing price of $729,900 is 8.1% above the median for the whole postal area, and its price per foot of $431 is above the area's $406. So Wicker Park asks more than its neighbors do.
The directions are up. Redfin's median is up 12.1%, which implies about $658,056 a year earlier. Realtor.com's sold median is up 4.55%, which implies about $659,971, and up 17.45% in three years, which implies about $587,484. Its listing median is up 6.72%, which implies about $632,496, and up 0.68% in three years, which implies about $670,441. Zillow's index is up 4.8%, which implies about $649,940, though as of February. Every source shows a rise of about five to twelve percent over the year.
Per-foot prices agree on direction and differ in size. Redfin shows $428, up 23.0%, which implies about $348 a year earlier, and Realtor.com shows $406, up 6%, which implies about $383, and up 13.54% in three years, which implies about $358. A rise of nearly a quarter in a year is larger than any other figure supports, and it may reflect a change in the mix of homes sold. Realtor.com's rise of 6% is the more plausible guide.
The Census owner value of $638,100, plus or minus $15,113, is 13.5% below Redfin's median, computed here. It is 4.7 times the Census median household income of $136,277. Owners estimate the value of their homes, and the figure is an average over five years that covers condominiums, townhomes and multi-unit buildings, so it trails current sales of single-family houses.
What the sources agree on is that prices are up modestly to strongly, that asking and selling prices are near each other and that homes sell quickly. An owner should treat any published median as a rough guide, since a postal area that mixes condominiums, multi-unit buildings and houses produces medians that move with the mix. The better test is closed sales of homes close to the owner's own in type, size and block.
| Source | Figure | What it measures |
|---|---|---|
| Census Reporter | $638,100 | Median owner value, postal area |
| Realtor.com | $675,000, up 6.72% | Median listing price, postal area, June 2026 |
| Zillow | $681,137, up 4.8% | Home value index, Wicker Park, updated February 28, 2026 |
| Realtor.com | $690,000, up 4.55% | Median sold price, postal area, June 2026 |
| Realtor.com | $729,900 | Median listing price, Wicker Park, June 2026 |
| Redfin | $737,681, up 12.1% | Median sale price, postal area, three months to August 2026 |
Sources as cited. Ratios and year-earlier values in this section are computed from the published figures and percentages.
How scarce are Wicker Park homes, and what does 103% of list mean?
Scarcity is the main fact. Realtor.com shows 170 active listings in the postal area, down 29.36% in a year, which implies about 241 a year earlier, down 27.01% in three years, which implies about 233, and down 11.49% from the month before, which implies about 192. In Wicker Park itself, 63 homes are for sale, up 5.26% in a year, which implies about 60 a year earlier. Against 253 sales in August on Redfin's count for the whole area, 170 listings are about 0.7 of a month of sales, an inference that mixes a June listing count with an August sales count.
Redfin rates the postal area very competitive, with a score of 79 out of 100. Homes receive three offers on average. Many get multiple offers, some with waived contingencies. The average home sold about 3% above list and went pending in around 44 days, and hot homes sold about 7% above list in around 25 days. Of homes sold, 61.8% went above list, up 9.9 points from a year before.
A sale above list is a sign of low asking prices as much as of high demand. The sale-to-list ratio of 103.5% means that homes sold for 3.5% above their asking prices on average, which is about $25,819 on a sale near $740,000, computed here. Realtor.com's June figure is 101%, with homes selling near the asking price. Many sellers price low on purpose to attract bids. A seller who does so and gets the bids ends up where the market puts the home.
Days on market differ by source and by place. Redfin shows a median of 42 days, unchanged in a year. Realtor.com shows 29 days for the postal area, up 8.70% in a year, which implies about 27 a year earlier, and down 3.85% in three years, which implies about 30. For Wicker Park alone it shows 24 days, up 2.13% in a year, which implies about 23, and up 41.18% from the month before, which implies about 17 in May. The neighborhood sold slightly faster than the area, and neighbors such as Logan Square and Ukrainian Village sold faster still.
For a seller, the cost of a public sale in a market like this is mostly preparation and exposure. A seller prepares the home, shows it, takes offers within days and then deals with the buyer's inspection and financing. The strongest offers often waive contingencies, which suggests a buyer who has already priced the home as it stands, and an owner can compare that clean offer with a higher bid that carries conditions. Whether a private buyer's terms beat the open market is the owner's judgment.
Sources as cited. Year-earlier values and differences are computed from the published percentages.
Who owns and who rents around Wicker Park?
Renting is the rule. Of 26,486 occupied homes in the postal area, 15,076 are rented, 56.9%, and 11,410 are owner-occupied, 43.1%. Of 28,216 units, 1,730 are vacant, 6.1%, and of those 451 are for rent, 161 are rented and not yet occupied, 108 are for sale only, 65 are sold and not yet occupied, 209 are held for seasonal use, 16 are for migrant workers and 720 are vacant for other reasons. A place where most households rent has a large investor and landlord class, and many of its sellers are owners of buildings.
Owners are fairly recent. Of 11,410 owner households, 468 moved in during 2023 or later and 3,085 between 2020 and 2022, so 31.1% moved in since 2020. Another 5,146, 45.1%, moved in between 2010 and 2019, 1,310, 11.5%, between 2000 and 2009, 568, 5.0%, in the 1990s and 833, 7.3%, before 1990. In all, 76.2% arrived since 2010, so most owners bought in the last fifteen years.
Owner homes are mid-sized. Of 11,410 owner households, 110, or 1.0%, live in a home with no bedroom, 450, or 3.9%, in a one-bedroom, 4,642, or 40.7%, in a two-bedroom, 3,936, or 34.5%, in a three-bedroom, 1,355, or 11.9%, in a four-bedroom and 917, or 8.0%, in one with five or more bedrooms. Two- and three-bedroom homes are 75.2% of the total.
Costs are moderate for most owners. Of 9,084 owners with a mortgage, 9,038 with a computed figure, 2,086, or 23.1%, spent 30% or more of income on housing, and 933, or 10.3%, spent half or more. Among the 2,326 owners without a mortgage, 2,272 with a computed figure, 457, or 20.1%, spent 30% or more, and 292, or 12.9%, spent half or more. Owners without a mortgage are 20.4% of all owners, so about a fifth could sell without a loan to pay off.
Renters turn over quickly. Of 15,076 renter households, 1,966 moved in during 2023 or later and 6,353 between 2020 and 2022, so 55.2% moved in since 2020, and 5,503, 36.5%, moved in between 2010 and 2019. Realtor.com shows 299 rental properties in the area, down 23.18% in a year, which implies about 389 a year earlier, and a median rent of $2,757, up 10.28%, which implies about $2,500 a year earlier and about $2,285 three years earlier. The Census median rent is $2,010, so the listed rent is 37.2% higher, computed here. In Wicker Park the median rent is $2,858 and 97 properties are for rent. Among renters with a computed figure, 32.6% spent 30% or more of income on rent and 13.4% spent half or more.
Source: U.S. Census Bureau, American Community Survey 2020-2024 five-year estimates, tables B25003, B25004, B25038, B25042, B25064, B25070 and B25091, via Census Reporter; Realtor.com for the rental figures. Shares are computed here.
How old are Wicker Park buildings, and what do they need?
The housing is very old. Of 28,216 units, 13,013, or 46.1%, were built before 1940, 896, or 3.2%, in the 1940s, 1,211, or 4.3%, in the 1950s, 868, or 3.1%, in the 1960s and 1,142, or 4.0%, in the 1970s. Another 1,040, or 3.7%, were built in the 1980s, 2,295, or 8.1%, in the 1990s, 4,542, or 16.1%, in the 2000s, 2,890, or 10.2%, in the 2010s and 319, or 1.1%, in 2020 or later. The median build year is 1952, and 60.7% were built before 1980.
Old brick buildings carry old systems and old obligations. A building from before 1940 may have masonry that needs repointing, a roof that has been replaced several times, wood porches, older plumbing with lead or galvanized pipe in parts, and wiring that has been updated unevenly. A buyer's inspector looks at each of them, and a building with several units has several sets of them. That is an inference from the age of the stock and not a finding from any source here.
Buildings are of every size. Of 28,216 units, 3,495, or 12.4%, are detached houses, 651, or 2.3%, are attached, 3,291, or 11.7%, are in buildings of two units, 10,078, or 35.7%, are in buildings of three or four units and 10,637, or 37.7%, are in buildings of five or more. A further 64 are mobile homes. More than a third of the stock sits in small buildings of three or four units, which is the characteristic form of the area, and which an owner may sell as a single investment or as units.
The population is young. Of 54,609 people counted, 7,205, or 13.2%, are under 18, 3,398, or 6.2%, are 18 to 24, 21,078, or 38.6%, are 25 to 34, 10,813, or 19.8%, are 35 to 44, 8,162, or 14.9%, are 45 to 64 and 3,953, or 7.2%, are 65 or older. The Census margin on the total is plus or minus 2,137. More than a third of residents are in their late twenties or early thirties.
An owner of a small building or a house here may hold a good deal of equity. A household that bought a decade ago, or a landlord who has held a building for years, may weigh a sale, and the timing is the owner's choice. A seller in that position often wants a date that fits a move or a tax year, privacy while tenants or neighbors are not told and a price that needs no repairs first. Those are the things a private buyer can offer. Readers comparing markets can also read the Roscoe Village brief and the Ukrainian Village brief.
Source: U.S. Census Bureau, American Community Survey 2020-2024 five-year estimates, tables B01001, B25004, B25024 and B25034, via Census Reporter. Shares are computed here.
What should a Wicker Park owner ask, and what does a private sale change?
Five questions are worth asking. Is my price based on closed sales of homes like mine, and not on a median that mixes condominiums and houses? What will the buyer's inspector find in a building of this age? What do taxes and upkeep cost me per month while the home is on the market? Do I want a public process with showings, especially with tenants in place? What will the fees be?
Fees are simple arithmetic, and no rate is assumed here. Each 1% of a $450,000 sale is $4,500, of a $725,000 sale is $7,250 and of a $1,200,000 sale is $12,000. Three percent is $13,500, $21,750 and $36,000, and five percent is $22,500, $36,250 and $60,000. A seller can put their own quoted costs into those rows. On the Redfin median of $737,681, 1% is $7,377, 3% is $22,130 and 5% is $36,884.
A private sale has no showings and no neighbors talking about it, which is the first benefit. For an owner whose building has tenants, or whose block notices a sign, a quiet transaction has plain appeal. The second benefit is a closing date that fits the seller, which helps an owner who needs time to find the next home or to settle a lease term.
The third and fourth benefits are no commission costs and no closing costs, and the fifth is no inspection repairs. In a postal area where 57.2% of homes were built before 1980 and nearly half before 1940, an inspector will find work, so the fifth is worth pricing. An owner should set an offer beside what the same home would net after preparation, after fees and after the cost of time, and beside the premium that a hot sale might bring.
Maison Off-Market buys luxury homes and estates directly from their owners and speaks only to sellers. It does not say that a private sale always beats a public listing, and in a market where the average home sells about 3% above list, an owner is right to compare carefully. If you would like a private, no-obligation offer for a home in Wicker Park, call 401-219-4207 or use the contact form on this site.
Sources as cited. Fee illustrations are arithmetic only and assume no commission rate.
Methodology and limitations
Each page's date, title and place were read before use. The Redfin page is for the three months ending August 2026, and covers the whole postal area. The Realtor.com page is for June 2026, three months older, with columns for one year and three years, and its neighborhood tables give figures for Wicker Park on their own. The Zillow page states that it was updated on February 28, 2026, so it is seven months old and is used only as a rough check. Only established data publishers and the Census are cited. The Census figures are five-year estimates for the postal area that the sheet lists for Wicker Park, which includes other neighborhoods. Percent changes were taken as printed, and ratios, sums, fee figures and year-earlier values are this brief's arithmetic.
Conclusion
The record for Wicker Park is a price near $0.7M, supply that has fallen by more than a quarter in a year, homes that sell in four to six weeks and mostly above list, and a stock in which almost half of homes were built before 1940 and most households rent. The useful number for an owner is a closed sale of a comparable home, and a private buyer can price the home in front of them and close on the owner's schedule.
Frequently Asked Questions
What is the median home price in Wicker Park?
Redfin shows a median sale price of $737,681 for the postal area for the three months ending August 2026, and Realtor.com shows a median listing price of $729,900 for Wicker Park for June 2026.
How long do homes take to sell in Wicker Park?
Redfin shows a median of 42 days on market for the postal area, and Realtor.com shows 24 days for Wicker Park for June 2026.
Do homes in Wicker Park sell above asking?
Often. Redfin shows 61.8% of homes sold above list and a sale-to-list ratio of 103.5%.
How old are Wicker Park homes?
The Census counts 13,013 of 28,216 housing units in the postal area, 46.1%, as built before 1940, with a median build year of 1952.
Can I sell my home in Wicker Park privately?
Yes. Maison Off-Market buys luxury homes and estates directly from their owners with no showings, flexible closing dates, no commission costs, no closing costs and no inspections or repairs. Call 401-219-4207 or use the contact form.
Compare your options before committing. Request a written private offer for your property, with no obligation, then weigh it against your listing plan.
Sources
- Redfin, 60622 housing market, 2026. 60622 Housing Market Trends. https://www.redfin.com/zipcode/60622/housing-market.
- Realtor.com, 60622 housing market, 2026. 60622 Housing Market Data. https://www.realtor.com/local/market/illinois/zipcode-60622.
- Zillow, Wicker Park home values, 2026. Wicker Park, IL Housing Market. https://www.zillow.com/home-values/7930/wicker-park-chicago-il/.
Related research

Seller Guide · October 6, 2026
How to Prepare Point Pleasant Beach Rental Records Before Selling
Separate rental approval, income history and booked stays before comparing sale terms.

Seller Guide · October 6, 2026
How to Prepare Rumson Flood and Waterfront Records Before Selling
Separate flood disclosure, elevation, repairs and waterfront rights before comparing sale terms.

Seller Guide · October 6, 2026
How to Prepare Sarasota Condo Inspection and Reserve Records Before Selling
Separate building condition, reserve funding and resale documents before comparing sale terms.