Market Brief · by Aidan Sowa · October 5, 2026
Is West Highland Really a Seller's Market? Reading Redfin, Realtor.com and the Census Mix of Houses and Apartments
Reading Redfin, Realtor.com and the Census Mix of Houses and Apartments for West Highland, CO, with each source dated and its limits noted, for owners weighing a listing against a direct sale.
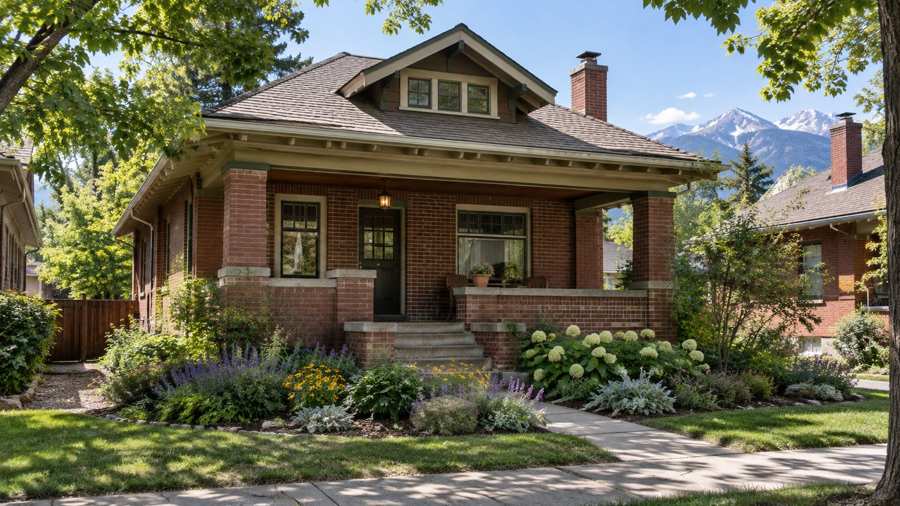
Is West Highland really a seller's market? The pages that describe it do not agree on that either. Redfin's page for West Highland calls the neighborhood very competitive, with a Compete Score of 84, a median sale price of $890,820 for the three months ending August 2026, up 0.4% in a year, and homes that go pending in about 13 days. Realtor.com's page for West Highland, with figures as of June 2026, shows a median sold price of $732,000, down 25.5%, and 38 days on market, up 26.67%. It calls the market a seller's market in one place and a buyer-favorable environment in another. The Redfin price is 21.7% above the Realtor.com one, computed here.
A fall of 25.5% in a sold median in a year is large enough to need a second look. It implies a median of about $982,550 a year earlier, which would be 10.3% above Redfin's current figure. Neither Redfin nor Zillow shows a fall of that size, and Zillow's value index is down 3.5%. Realtor.com's sold median for a single month in a neighborhood with about 59 sales a month can move a lot when a few larger or smaller homes close. That reading is an inference, not something the page states, but it is the simplest one.
Maison Off-Market speaks only to sellers, and this brief is written for an owner who has seen a number and wants to know how much weight to give it. West Highland shares its Census postal area with Berkeley, which has its own brief, so this one looks at a different cut of the same data: the mix of houses, townhomes and apartment buildings, and who lives in each. Every figure below is dated and linked, the arithmetic is shown, and inferences are labeled.
Key Findings
- Redfin's page for West Highland, for the three months ending August 2026, showed a median sale price of $890,820, up 0.4%, $446 per square foot, up 3.0%, 59 homes sold in August against 57, 13 days on market against 18, a Compete Score of 84, an average sale around list price and homes that sell above list going pending in about 4 days (Redfin, West Highland housing market).
- Realtor.com's page for West Highland, for June 2026, showed a median listing price of $849,000, down 2.97%, a median sold price of $732,000, down 25.5%, $451 per square foot, down 6.92%, 68 active listings, down 3.85%, 38 days on market, up 26.67%, a sale-to-list ratio of 99% and a median rent of $1,635, down 12.14% (Realtor.com, West Highland housing market).
- Zillow's page for West Highland, updated April 30, 2026, shows an average home value of $792,797, down 3.5% over the past year (Zillow, West Highland home values).
- Realtor.com's own page is mixed on direction. It calls the market a seller's market for June 2026, says its median listing price reflects strong buyer demand, and later describes buyer-favorable conditions with more room to negotiate.
- The Census postal area that includes West Highland has 10,735 housing units, 55.2% detached houses and 24.9% in buildings of two or more units, 66.8% of occupied homes owner-occupied, a median household income of $124,972, a median rent of $1,799 and a median owner value of $744,500, plus or minus $47,047 (U.S. Census Bureau, American Community Survey 2020-2024 five-year estimates, via Census Reporter).
Why do the West Highland medians differ so much?
Start with what each figure measures. Redfin's $890,820 is a median sale price across all home types for the three months ending August 2026. Realtor.com's $732,000 is a median sold price for June 2026. The first is 21.7% above the second, and the second is 17.8% below the first, both computed here. That is a bigger gap than the one between Redfin and Realtor.com in neighboring Berkeley, and it is a gap that comes from a single month on one side and a three-month window on the other.
Direction differs too. Redfin's rise of 0.4% implies a median of about $887,271 a year earlier, and Realtor.com's fall of 25.5% implies about $982,550. The year-earlier values are 10.7% apart, which is a lot for the same neighborhood a year before. Zillow's index, at $792,797, down 3.5%, implies about $821,551 a year earlier. Redfin says flat, Zillow says a modest decline and Realtor.com says a steep one. The simplest reading, offered as an inference, is that the Realtor.com figure is a one-month sample with a different mix of homes.
The listing median adds a sanity check. Realtor.com's $849,000 is 4.7% below Redfin's sold median and 16.0% above its own sold median, both computed here. A listing median below a nearby sold median is unusual, and it shows the pages do not share a base. Within the Realtor.com page, the 16.0% gap between listing and sold is the more usual relationship, and the sale-to-list ratio of 99% shows homes closing about 1.11% below asking.
Zillow's average of $792,797 sits between the two sold medians, closer to the Realtor.com one. It is an index of estimated values for all homes, and it moves slowly, so a drop of 3.5% over a year is a gentler signal than either sold median. The Census owner value of $744,500, plus or minus $47,047, is a rough check for the postal area and is below every price page but the Realtor.com sold median.
A seller can use the spread as a list of questions rather than a target. The sold figures run from $732,000 to $890,820, a span of $158,820, computed here. The right number for a home is the closed price of a similar home nearby in the same season, and no median page gives that.
The two readings of West Highland also lead to different mistakes. An owner who trusts the Redfin picture may expect a bidding contest and price above the closed sales nearby, and then wait while the listing ages. An owner who trusts the Realtor.com picture may expect a weak market and accept a low offer when a better one was a week away. In both cases the median did the harm, not the market. A seller who has the closed prices of three or four similar homes within a few blocks, sold in the last season, has a better guide than any of the five figures in the table above, and a private buyer who offers on the house itself is working from the same kind of evidence.
| Source | Figure | What it measures |
|---|---|---|
| Realtor.com | $732,000, down 25.5% | Median sold price, West Highland, June 2026 |
| Census Reporter | $744,500 | Median owner value, postal area |
| Zillow | $792,797, down 3.5% | Average home value, West Highland, April 2026 |
| Realtor.com | $849,000, down 2.97% | Median listing price, West Highland, June 2026 |
| Redfin | $890,820, up 0.4% | Median sale price, West Highland, August 2026 |
Sources as cited. Ratios and year-earlier values in this section are computed from the published figures and percentages.
How long do homes in West Highland take to sell, and how big are the discounts?
Speed is where the pages disagree most. Redfin shows 13 days on market for the three months ending August 2026, against 18 a year earlier, a fall of 5 days or 27.8%, computed here, and its page says homes sell in about 12.5 days. Realtor.com shows 38 days for June 2026, up 26.67%, which implies about 30 a year earlier. Even Realtor.com's year-earlier 30 days is more than double Redfin's 13. The pages probably count days differently, but neither explains its method in the text read here.
Redfin's competition notes are specific. It says many homes get multiple offers, some with waived contingencies, that the average home sells around list price and goes pending in about 13 days, and that a home that sells above list does so by about 2% and goes pending in about 4 days. On a $900,000 home, 2% is $18,000, computed here, and that is the size of the premium Redfin describes for the most sought-after homes.
Realtor.com describes a smaller discount. Its page says homes sold for 1.11% below asking on average in June 2026, with a sale-to-list ratio of 99%. On a $850,000 asking price, 1.11% is $9,435, computed here. The two pages agree that the typical home sells within a point or two of its asking price and that the premium and the discount are both small.
Counts agree with speed on the Redfin page. It shows 59 homes sold in August against 57 a year earlier, an increase of 2 or 3.5%, computed here. Realtor.com's inventory shows 68 active listings, down 3.85%, which implies about 71 a year earlier, and over three years it shows active listings up 47.06% and days on market up 72.73%. A market with more listings than three years ago and longer marketing times is not the same as one with bidding contests, and the three-year view fits Realtor.com's buyer-favorable text better than its seller's market label.
The Compete Score of 84 on a scale of 100 puts West Highland in the very competitive range on Redfin, higher than the 72 it shows for Berkeley next door. For a seller the practical point is that a fast market rewards preparation. A home priced near recent closed sales and presented well can draw offers in the first week. A home priced above them can sit, and then the days on market count against it. A private buyer removes both risks, since the sale does not depend on a week of showings.
There is one more reason to be careful with speed figures. A median of 13 days says that half of the homes that sold did so in less time, and it says nothing about the homes that were listed and withdrawn without selling. Neither page counts those. A seller who is told that homes sell in under two weeks should ask how many of the listings on the street over the last year ended in a sale and how many were taken down.
Sources as cited. Year-earlier values and dollar figures are computed from the published percentages.
What do per-foot prices and counts say about West Highland?
Per-foot prices reduce the size effect, and here they agree. Redfin shows $446 per square foot, up 3.0%, and Realtor.com shows $451, down 6.92%. The two current figures are 1.1% apart, computed here, while the medians are 21.7% apart. When per-foot prices match and medians do not, the likeliest cause is the size of the homes that sold, not a difference in what a square foot costs. That is an inference, and it is the most useful one in this brief.
The directions of the per-foot changes still differ. Redfin's rise of 3.0% implies about $433 a year earlier, and Realtor.com's fall of 6.92% implies about $485. Those year-earlier values are 12% apart, which echoes the gap in the medians, and it is another sign that the two pages used different samples a year ago too. A seller should not read either per-foot trend as settled.
Rental figures give a third reading. Realtor.com shows 38 rental listings, down 52.56%, and a median rent of $1,635, down 12.14%, which implies about $1,860 a year earlier. Over three years the page shows rent down 27.75% and rental listings down 56.98%. A sharp fall in rental listings with a falling rent can mean that fewer homes were listed for rent, and that those listed were smaller or less expensive. The Census median rent of $1,799 for the postal area is a steadier figure and sits above the Realtor.com one.
The three-year changes on the sale side are also negative on Realtor.com: the listing median is down 13.37%, the sold median down 18.21% and the per-foot price down 5.85%. Those are the figures of a neighborhood where prices have come back from a peak, and they sit next to Redfin's flat year. A reasonable summary is that West Highland is a stable, active market whose headline price depends on which month and which homes are counted.
For a seller the useful habit is to look at three things for a home like theirs: the closed prices of the last several nearby sales, the asking prices of homes still listed and the days those homes have been listed. These say more than a median. A private buyer looks at the same facts for one house, and can make an offer on that house alone.
Sources as cited. Year-earlier values and ratios are computed from the published percentages.
What do the mix of houses and apartments, ages and vacancy say about the postal area?
The Census describes a mixed place. The postal area that includes West Highland has 10,735 housing units, and 5,925 of them, 55.2%, are detached houses. Another 2,107, 19.6%, are attached houses such as townhomes and duplexes with a shared wall. Buildings with two or more units hold 2,675 homes, 24.9%, and the largest group within them is 807 units in buildings of fifty or more. Only 28 are mobile homes. This is a neighborhood with a house at its center and apartments around it.
The tenure by bedroom table shows how the mix is used. Of 6,821 owner-occupied homes, 4,696 have three or more bedrooms, which is 68.8%, and 2,143 have four or more, 31.4%. Of 3,391 rented homes, 1,343 have one bedroom or none, which is 39.6%, and 607 have three or more, 17.9%. Owners live in larger homes and renters in smaller ones, but about one rented home in six is a family-sized house. Some of those rented houses may come to market when an owner decides to sell.
The people are working-age. Of 20,746 residents, 15.9% are under 18, 3.3% are between 18 and 24, 22.5% are between 25 and 34, 18.8% are between 35 and 44, 25.7% are between 45 and 64 and 13.8% are 65 or older, computed here. The median household income is $124,972. The median build year is 1957, and 66.8% of homes were built before 1980, so the housing is old even though the residents are not.
Vacancy is small and unusual in its makeup. Of 523 vacant units, 168 are for rent, which is 32.1%, five are sold and not yet occupied and 350 are classed as other vacant, which is 66.9% of the vacant units and 3.3% of all homes. No units are held for seasonal use and none are listed as for sale only at the time of the survey. Other vacant homes are often homes between owners, under renovation or held off the market, and a quiet buyer can be a good fit for an owner of such a home.
A last point is the Census value. The median owner value of $744,500, plus or minus $47,047, is lower than Redfin's $890,820 and close to Zillow's $792,797 and Realtor.com's $732,000. Owner estimates tend to run behind recent sale prices, and the postal area includes parts of the city beyond West Highland, so the gap is expected. It is a reminder that a median across a wide area is a poor guide to a particular house on a particular block. Readers comparing markets can also read the Berkeley / West Highland brief and the University Hills brief.
Source: U.S. Census Bureau, American Community Survey 2020-2024 five-year estimates, tables B25024, B25042, B25004, B25035 and B01001, via Census Reporter. Shares are computed here.
What should an owner ask, and what does a private sale change?
Five questions are worth asking before choosing how to sell. The first is what similar homes nearby actually sold for, because a median is not a price. The second is how long the sale will take and what it costs to wait. The third is what the fees will be. The fourth is how much of the price survives the buyer's inspection. The fifth is who will see the house and who will know it is for sale.
Fees are simple arithmetic and no rate is assumed here. Each 1% of a $450,000 sale is $4,500, of a $725,000 sale is $7,250 and of a $1,200,000 sale is $12,000. Three percent is $13,500, $21,750 and $36,000, and five percent is $22,500, $36,250 and $60,000. A seller can put their own quoted costs into those rows. With sold medians on the pages from $732,000 to $890,820, each 1% in costs is between about $7,300 and $8,900.
Inspection is the fourth question. With a median build year of 1957 and two homes in three built before 1980, a buyer's inspector is likely to find work. A public sale can turn that into a repair list or a credit request after the price is agreed. A buyer who agrees to buy the home as it stands removes that step, and the seller can ask what an as-is price looks like before spending money on repairs.
Privacy is the fifth question. West Highland is a neighborhood where a house sits near other houses and apartment buildings, and a public listing puts photographs of the inside of the home online and brings strangers through it. Neighbors notice. Some owners do not mind. Others, particularly those selling after a change in the family, do. A private sale does not announce itself.
The benefits are plain. Maison Off-Market buys luxury homes and estates directly from their owners and speaks only to sellers. A private sale has no showings and no neighbors talking about it. It allows closing dates that give a seller time to find a new home. It has no commission costs and no closing costs, and it avoids inspection repairs. The company does not say that a private sale always beats a public listing, and in a market where one page shows $890,820 and another $732,000, an owner is right to ask what each route yields. If you would like a private, no-obligation offer for a home in West Highland, call 401-219-4207 or use the contact form on this site.
Sources as cited. Fee illustrations are arithmetic only and assume no commission rate.
Methodology and limitations
Each page's date, title and place were read before use. The Redfin page is for the three months ending August 2026, and the Realtor.com page is for June 2026, so they cover different periods. The Zillow page was updated on April 30, 2026. Additional blocks on the Redfin page that cover other areas were not used. Only established data publishers and the Census are cited. The Census figures are five-year estimates for the postal area that includes West Highland, shared with a sibling post on Berkeley. Percent changes were taken as printed, and ratios, sums, fee figures and year-earlier values are this brief's arithmetic.
Conclusion
The record for West Highland shows sold medians of $732,000 and $890,820, days on market from 13 to 38, homes selling within a point or two of list price, and a postal area where 24.9% of homes are in buildings of two or more units and 66.8% were built before 1980. The useful number for an owner is a closed sale of a similar home nearby, not a median, and a private buyer can price the house in front of them.
Frequently Asked Questions
What is the median home price in West Highland?
Redfin shows a median sale price of $890,820 for the three months ending August 2026, and Realtor.com shows a sold median of $732,000 and a listing median of $849,000 for June 2026.
How long do homes take to sell in West Highland?
Redfin shows 13 days on market and Realtor.com shows 38 days, and the two pages cover different months and measures.
What does the Census say about homes near West Highland?
The postal area has 10,735 housing units, 55.2% detached houses, 24.9% in buildings of two or more units and a median build year of 1957.
Is West Highland a seller's market?
Redfin gives it a Compete Score of 84 and calls it very competitive, while Realtor.com uses both seller's market and buyer-favorable language for June 2026.
Can I sell my home in West Highland privately?
Yes. Maison Off-Market buys luxury homes and estates directly from their owners with no showings, flexible closing dates, no commission costs, no closing costs and no inspections or repairs. Call 401-219-4207 or use the contact form.
Compare your options before committing. Request a written private offer for your property, with no obligation, then weigh it against your listing plan.
Sources
- Redfin, West Highland housing market, 2026. West Highland, Denver Housing Market: House Prices and Trends. https://www.redfin.com/neighborhood/121069/CO/Denver/West-Highland/housing-market.
- Realtor.com, West Highland housing market, 2026. West Highland Neighborhood of Denver, CO Housing Market. https://www.realtor.com/local/market/colorado/denver/west-highland.
- Zillow, West Highland home values, 2026. West Highland Denver, CO Housing Market: 2026 Home Prices and Trends. https://www.zillow.com/home-values/268777/west-highland-denver-co/.
Related research

Seller Guide · October 6, 2026
How to Prepare Point Pleasant Beach Rental Records Before Selling
Separate rental approval, income history and booked stays before comparing sale terms.

Seller Guide · October 6, 2026
How to Prepare Rumson Flood and Waterfront Records Before Selling
Separate flood disclosure, elevation, repairs and waterfront rights before comparing sale terms.

Seller Guide · October 6, 2026
How to Prepare Sarasota Condo Inspection and Reserve Records Before Selling
Separate building condition, reserve funding and resale documents before comparing sale terms.