Market Brief · by Aidan Sowa · October 5, 2026
Is the North Naples Market Down or Up? Reading Several Pages and Their Homes-for-Sale Counts
Reading Several Pages and Their Homes-for-Sale Counts for North Naples, FL, with each source dated and its limits noted, for owners weighing a listing against a direct sale.
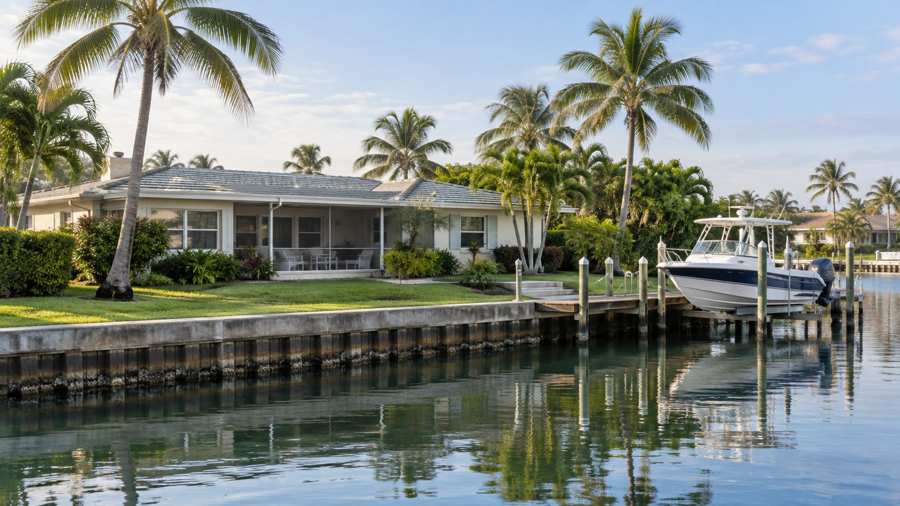
Is the North Naples market down 20.5% or up 10.8%? Both numbers are published for 2026. Realtor.com shows a median sold price of $672,500 for April, down 20.51% on the year, for the postal area the sheet pairs with North Naples. A broker's account of the Naples Area Board of Realtors' June report says single-family sales in the North Naples area rose 22.8% and the median closed price rose 10.8% to $1,030,000 from $930,000. The two cover different areas, home types and months, and they are not in conflict, though a seller who reads one of them will be misled about the other.
The supply counts are further apart. Realtor.com shows 658 active listings for the postal area in April, Sell123 shows 420 for August and Resideline shows 126 for September. Sell123 also shows an average price of $1,148,070 against a median of $694,900, a ratio of 1.65. A seller who wants to know how many competing homes are for sale has three answers, and the pages do not explain the gap.
Maison Off-Market buys luxury homes and estates directly from their owners and speaks only to sellers. We do not appraise homes, and nothing here is a valuation. This brief sets the published figures side by side, shows what each one measures, adds Census counts on age and value that differ from the cut used in the neighboring Vineyards brief, and states what a percentage of a price is worth in dollars. Every figure is attributed, every calculation is this brief's own arithmetic and every inference is labeled as one.
Key Findings
- Realtor.com showed, as of April 2026, a median listing price of $670,000 (down 10.55% on the year), a median sold price of $672,500 (down 20.51%), 658 active listings, 68 days on market and a median rent of $3,800 for the postal area (Realtor.com, North Naples postal area market data).
- Sell123, citing Realtor.com for August 2026, showed 420 active listings (down 18.9%), 111 pending sales, a median price of $694,900 (down 3.5%), an average of $1,148,070 and 99 days on market (Sell123, market update for the postal area).
- Resideline, with a data snapshot of September 21, 2026, showed 126 active listings, 16 pending, a median asking price of $689,999, a six-month median sold price of $610,000 and a middle half of sold prices from $418,000 to $1,000,000 (Resideline, housing market for the postal area).
- PropertyIQ showed a median home value of $645,000, down 3.1%, and 99 days on market, with data through August 2026 (PropertyIQ, housing market for the postal area).
- A broker's August 10, 2026 market watch said single-family sales in the North Naples area rose 22.8% in June and the median closed price rose 10.8% to $1,030,000 (Market Watch, August 2026).
- The Naples Area Board of Realtors' August report showed a median closed price of $575,000 for all of Naples (down 1.7%), 99 days on market and 5.4 months of supply (Naples Area Board of Realtors, August 2026 report).
- The Census shows 36,807 residents in the postal area, 18,592 homes and a median year built of 2005 (Census Reporter, American Community Survey profile).
Which North Naples number is the median?
The pages disagree because they measure different things. For the postal area, the median sold price is $672,500 (Realtor.com, April), $610,000 (Resideline, six months to September) and a median home value of $645,000 (PropertyIQ, August). The median asking price is $670,000 in April, $694,900 in August and $689,999 in September. These are within 14% of one another, and the sold medians are close to the asking medians, which is not what a market with large discounts looks like. The sold figure of $672,500 is down 20.51% on the year on Realtor.com, while the asking figure on the same page is down 10.55%.
Resideline's six-month sold median is 9.3% below Realtor.com's April sold median, a gap this brief computes, and the first covers 679 tracked sales while the page says that is a sample and not a market total. Its middle half of sold prices runs from $418,000 to $1,000,000, a spread of 2.4 times. A median of $610,000 in a range that wide describes the middle of two different markets, the condominiums and villas at the bottom and the estates at the top.
The June figure of $1,030,000 is from a different place and a different kind of home. The broker's account of the board's June report says the North Naples area, which it defines as three postal areas, was one of the strongest in June, with single-family sales up 22.8% and the median closed price up 10.8% to $1,030,000 from $930,000. That is single-family homes only, over a larger area, and one month. It is 1.7 times the postal-area sold median of $610,000, a ratio this brief computes. The page suggests that new luxury developments in North Naples may be part of the reason, which is the broker's reading.
The all-Naples figures give the third frame. The board's August report shows a median closed price of $575,000, down 1.7% from $585,000, and year to date the median is down 0.8%. A blog on the report says the average closed price rose 8.6% to $1,017,608 and the single-family median fell 1.7% to $717,500 while its average rose 9.4% to $1,340,161. That is a mean 1.9 times the median for single-family homes. The August 2022 median was also $575,000, according to the board's page, so the headline median is back where it was four years earlier.
The mean and median of the postal area show the same gap. Sell123 shows a median of $694,900, down 3.5%, and an average of $1,148,070, down 10.9% from $1,287,900. The average is 1.65 times the median. When the average falls by three times as much as the median, the high end of the market is where the change happened. A seller of an estate is reading a different market from a seller of a villa, and one median cannot describe both.
| Source | Figure | What it measures |
|---|---|---|
| Naples Area Board of Realtors | $575,000 | Median closed price, all Naples, August |
| Resideline | $610,000 | Median sold price, six months, postal area |
| PropertyIQ | $645,000 | Median home value, August |
| Realtor.com | $672,500 | Median sold price, postal area, April |
| Sell123 | $694,900 | Median price, postal area, August |
| Broker account of board report | $1,030,000 | Median closed price, single-family, North Naples area, June |
| Sell123 | $1,148,070 | Average price, postal area, August |
Sources as cited. The measures differ and the figures are not directly comparable. Commercial content; not independently verified.
How many homes are for sale, and how long do they take to sell?
The count of active listings for the postal area is 658 on Realtor.com in April, 420 on Sell123 in August and 126 on Resideline in September. The first two cite Realtor.com, and the third is a different feed. The change from 658 to 420 is a fall of 36%, a ratio this brief computes, over four months in which Sell123 says inventory was down 18.9% on the year. The 126 on Resideline is 19% of the April count. The page counts only what it has been seeing, which may be a subset, and the pages do not explain the difference. A seller should not take any one of them as the count of competing homes.
The pending figures vary too. Sell123 shows 111 pending sales, which is 26% of its 420 active listings, and Resideline shows 16 pending against 126 active, a ratio of 0.13. Realtor.com's median listing age is not given for April, but its median days on market is 68, and Sell123 and PropertyIQ show 99. Sell123 compares that with 101 a year earlier, which is a 2% fall. Resideline shows a median listing age of 77 days for current listings. The longest is 1.5 times the shortest.
The wider Naples data are more consistent. The board's August report shows 4,093 homes in inventory, down 16.3% on the year, 792 new listings, down 15.5%, 622 closed sales, up 1.1%, 769 pending sales, up 1.9%, and 5.4 months of supply, down from 8.1. The market watch for June shows sellers receiving an average of 94.5% of their most recent list price, and the blog on the August report shows 94.8%, up from 93.8%. A median asking price of $694,900 at 94.8% is about $658,800, an illustration this brief computes and not a forecast.
The luxury segment behaves differently. The blog on the August report says that over the trailing 12 months homes above $5 million took 156 days to go under contract, up from 150, while sellers received 92.7% of their asking price, up from 92.0%. It says this is the only price range where the percentage improved, and that a longer wait at the top does not mean more room to negotiate. That is the blog's reading of one range across all of Naples, and it has not been tested for North Naples.
One more clock matters. The market watch says some areas of Naples have a year and a half of inventory, and that new listings are down 11.4% since January. The August report puts the fall in new listings at 15.5%. A market in which fewer homes are listed but the ones that are listed take 99 days is not tight for sellers. It is a market where the right price sells and the wrong one sits.
Why is the median rent $3,800 and the Census rent $2,073?
Realtor.com shows a median rent of $3,800 a month for the postal area in April, down 20.83% on the year and down 24% over three years, with 297 rental properties. The Census shows a median gross rent of $2,073 for the postal area, or $24,876 a year. The advertised rent is 1.83 times the Census figure. The first is what is asked on homes listed for rent, which are mostly larger homes and seasonal rentals, and the second is what tenants pay across all rented homes. The reason is an inference, and the pages do not give it.
Only 2,459 of 15,033 occupied homes are rented (16.4%), and 12,574 (83.6%) are owner-occupied. Of 18,592 homes, 3,559 (19.1%) are vacant, which the Census definition includes seasonal and occasional-use homes among. In a market with seasonal owners, a vacancy rate near a fifth is not a sign of distress. The median household income is $113,391, and the Census median owner-occupied value is $716,400, with a margin of error of $36,828.
That Census value is within 0.2% of the single-family median of $717,500 for all of Naples in August, a coincidence this brief notes and does not lean on, since the two cover different areas and different definitions. It is 17% above the six-month sold median of $610,000 for the postal area, which is what one would expect when the Census counts owner-occupied single-family homes and the sold median includes condominiums.
The stock is new, and this is the main fact about the postal area. Of 18,592 homes, 8,071 were built in the 2000s (43.4%), 4,671 in the 2010s (25.1%) and 662 since 2020 (3.6%). Another 3,418 were built in the 1990s. Only 736 homes (4.0%) were built before 1980, and none are recorded before the 1950s. The median year built is 2005. That means an owner here is selling a home that is 20 years old or less, with newer systems than a typical coastal home, and the pages that describe sales of older homes with aging roofs and seawalls do not apply.
A new stock changes the questions. Buyers ask about the community, the association, fees, any special assessments, the insurance cost and the age of the roof and air conditioning. The market watch says condo buyers have faced mandatory structural reserve studies, rising insurance costs and special assessments in recent years. A seller who knows the answers about the association has less to explain.
Source: Census Reporter, American Community Survey 2020-2024 five-year estimates, tables B25034, B25077, B25003, B25002, B19013 and B25064. Percentages and ratios are this brief's arithmetic.
Do the communities inside the postal area price alike?
They do not. The Realtor.com page lists median listing prices for a handful of communities inside the postal area, as of April 2026: $448,000 for one at $283 per listed square foot, $599,000 for another at $263, $675,000 at $327, $774,999 at $310, $837,500 at $339 and $1,300,000 at $484. The highest is 2.9 times the lowest, a ratio this brief computes, and the price per square foot differs by 1.8 times. A postal-area median of $670,000 sits in the middle of that list, and none of the communities on it is a typical home.
The same table shows median monthly rents that do not line up with prices. One community shows $5,000 a month and another $1,850, and the community with the lowest median listing price has the highest rent on the table. The rent column rests on a few rental listings in each community, and the page does not give the counts, so the figures should be read as examples and not as medians that mean anything on their own. A median from two or three listings is a number that moves when one listing is added.
The Sell123 page lists the communities in the postal area by name, more than twenty of them, and it describes the market as a seller's market while showing 99 days on market and a median price down 3.5%. That label is the page's, and it sits beside figures that a reader might take as a sign of a slower market. The same postal area is also described as a cool market on Realtor.com, with homes selling in a median of 68 days. A label tells a seller what the page's author chose to say, and the figures tell the seller what the data show.
For an owner the practical point is that the comparison that matters is with homes in the same community and of the same type. The board's report, which covers all of Naples, breaks sales out by price range and geography, and the market watch says that Naples is not a market where one statistic tells the entire story. A seller who can show how a home compares with others in the same community answers a buyer's first question, and a seller who cannot may find the buyer using the postal-area median instead. Readers comparing markets can also read the Rio Vista brief and the Vineyards brief.
What should an owner ask, and what does a private sale change?
Ask whether a figure is for the postal area, for the three-area North Naples grouping or for all of Naples. Ask whether it covers single-family homes, condominiums or both, and which months. Ask whether a count of listings is a live feed or a sample. A seller who has the answers can read a page, and a seller who does not will find that three pages give three counts of homes for sale.
A private sale changes how a home reaches a buyer. With Maison Off-Market there are no showings and no neighbors talking about a sale, the closing date can be flexible so that an owner has time to find a new home, there are no commission costs, there are no closing costs and there are no inspections or repairs. For an owner whose home sits in a community with many similar homes, a quiet sale keeps the price from being compared with the home next door. This brief does not claim that a private sale always brings a higher price than a public listing.
Fee arithmetic shows what the commission point means in dollars, without assuming any rate. Each 1% of a sale price is $6,100 at $610,000, $6,949 at $694,900 and $10,300 at $1,030,000. At 3% those amounts are $18,300, $20,847 and $30,900. At 5% they are $30,500, $34,745 and $51,500. These are illustrations of what a percentage means on the figures in this brief, and they are not a statement of what any agent charges or what any sale would cost.
Privacy is often the first thing owners raise. A public listing puts photographs, a price and every price change in front of anyone, and in a community of similar homes the neighbors read it too. A private sale keeps those details out of view. That is a matter of preference and not a claim about price.
Timing is the other thing an owner controls. A public listing starts a clock, and the pages above show 68 to 99 days, with 156 days for homes above $5 million across Naples. A private sale lets the owner choose the closing date, which matters most to people who need to find the next home first, or who would rather close before the winter season.
If you are weighing a sale of a North Naples home, one conversation costs nothing and obliges you to nothing. We ask about the home, the timing you would like and what you would need from a buyer, and we say plainly whether a private sale fits.
If you would like a private, no-obligation offer for a North Naples home, call 401-219-4207 or use the contact form on this site.
Methodology and limitations
Prices, days on market, counts and ratios come from a Realtor.com page with indicators as of April 2026, a Sell123 page citing Realtor.com for August 2026, a Resideline snapshot of September 21, 2026, a PropertyIQ page with data through August 2026, a broker's market watch dated August 10, 2026 that is headed July in its title and August in its heading, and the Naples Area Board of Realtors' August 2026 report. The pages cover different periods and boundaries, and most are commercial pages, so they are not independent of each other. The June figures for North Naples come from a broker's account of the board's report and have not been checked against the report.
Census figures come from the American Community Survey 2020-2024 five-year estimates for the postal area the sheet pairs with North Naples, through Census Reporter. The neighboring Vineyards brief uses the tenure and income cut of the same data. Percentages, gaps, ratios and fee amounts are this brief's own arithmetic and are labeled as such. Where a reading goes beyond what a page says, it is called an inference. No agent names, contact details or street addresses from the pages are reproduced.
Conclusion
The North Naples record shows sold medians of $610,000 and $672,500 for the postal area, a single-family median of $1,030,000 for a larger area, counts of 126 to 658 homes for sale and waits of 68 to 99 days. The numbers differ because the pages measure different areas, home types and months, and because the average runs 1.65 times the median.
It does not fix a price for any one home. The choice between a public listing and a private sale comes down to whether an owner would rather meet showings, inspections and a public clock, or sell quietly on a date that suits them. Maison Off-Market speaks only to sellers, and a conversation costs nothing.
Frequently Asked Questions
What is the median home price in North Naples?
Pages differ. Realtor.com shows a median sold price of $672,500 for April 2026, Resideline shows $610,000 over six months, and a broker reports a single-family median of $1,030,000 for the wider North Naples area in June.
How many homes are for sale in North Naples?
Three pages for the same postal area show 658, 420 and 126 active listings, in April, August and September 2026.
How long do North Naples homes take to sell?
Pages show 68 days (Realtor.com, April) and 99 days (Sell123 and PropertyIQ, August).
How old are the homes in North Naples?
The Census shows a median year built of 2005 for the postal area, and 4.0% of homes were built before 1980.
What is the difference between a private sale and a public listing?
A private sale with Maison Off-Market has no showings, a flexible closing date, no commission costs, no closing costs and no inspections or repairs. A public listing exposes the home to a wider group of buyers. This brief does not claim either always gets a higher price.
Compare your options before committing. Request a written private offer for your property, with no obligation, then weigh it against your listing plan.
Sources
- Realtor.com, 2026. Housing Market Data for the North Naples Postal Area. https://www.realtor.com/local/market/florida/zipcode-34119.
- Sell123, 2026. Naples Real Estate Market Update. https://sell123.com/real-estate-market-update-34119.
- Resideline, 2026. Naples Housing Market 2026: Prices and Trends. https://resideline.com/market/34119/.
- PropertyIQ, 2026. Naples Housing Market Overview. https://www.propertyiq.app/markets/zip/34119-naples-fl.
- Local brokerage, 2026. Market Watch, August 2026. https://www.buynaples.net/blog/market-watch-august-2026/.
- Naples Area Board of Realtors, 2026. August Home Sales Heat Up as Inventory Tightens Ahead of Winter Season. https://nabor-blog.ghost.io/august-home-sales-heat-up-as-inventory-tightens-ahead-of-winter-season/.
- U.S. Census Bureau, 2026. American Community Survey 2020-2024 five-year estimates, the North Naples area (via Census Reporter). https://censusreporter.org/profiles/86000US34119-34119/.
Related research

Seller Guide · October 6, 2026
How to Prepare Point Pleasant Beach Rental Records Before Selling
Separate rental approval, income history and booked stays before comparing sale terms.

Seller Guide · October 6, 2026
How to Prepare Rumson Flood and Waterfront Records Before Selling
Separate flood disclosure, elevation, repairs and waterfront rights before comparing sale terms.

Seller Guide · October 6, 2026
How to Prepare Sarasota Condo Inspection and Reserve Records Before Selling
Separate building condition, reserve funding and resale documents before comparing sale terms.