Market Brief · by Aidan Sowa · October 5, 2026
Is the Incline Village Median a House Price or a Condominium Price? Reading Single-Family Homes Apart From a Condominium Surge
Reading Single-Family Homes Apart From a Condominium Surge for Incline Village, NV, with each source dated and its limits noted, for owners weighing a listing against a direct sale.
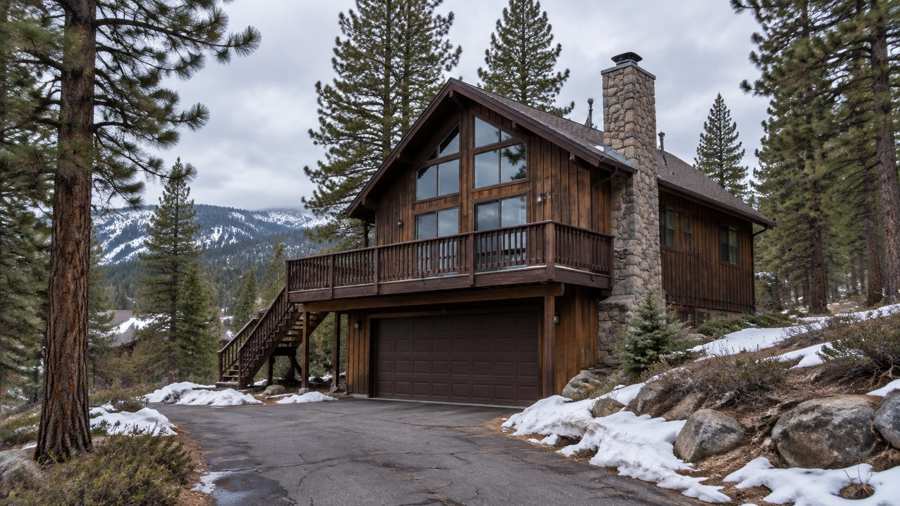
Is the Incline Village median $1,235,000, $1,550,000 or $2,987,500? All three are published for 2026, and each is a median of recent sales. A local report for July shows a combined median sale price of $1,235,000 for Incline Village and Crystal Bay, down 20.1% on the year. A brokerage update for August shows a combined median of $1,550,000 for the year to date and a single-family median of $2,987,500 for the month. Another source puts the August single-family median at $2,275,000. Realtor.com shows a median sold price of $1,800,000 for June, up 49.69% on the year, and Redfin shows $1.3 million for the three months to August, down 12.4%. A seller who wants to know what a home in Incline Village sold for will find a range that spans a factor of 2.4.
The explanation is in the mix. The brokerage update says that through August 2026 there were 105 condominium closings, against 27 in the same eight months of 2025, and that 50 of them were below $1 million, against 8 a year earlier. It says that adding 78 more condominium sales to an active single-family market pulls the combined median down without any home losing value. On the same page the single-family median for the eight months is up 7.5%, to $2,510,000. One town, then, is falling by one measure and rising by another.
Maison Off-Market buys luxury homes and estates directly from their owners and speaks only to sellers. We do not appraise homes, and nothing here is a valuation. This brief sets the published figures side by side, shows what each one measures, adds a Census cut on when owners moved in and on how many homes are held for seasonal use, and states what a percentage of a price is worth in dollars. Every figure is attributed, every calculation is this brief's own arithmetic and every inference is labeled as one.
Key Findings
- Realtor.com showed, as of June 2026, a median listing price of $1,310,000 (down 11.97% on the year), a median sold price of $1,800,000 (up 49.69%), $846 per square foot, 190 active listings, 57 days on market, a sale-to-list ratio of 97% and a median rent of $3,500 (Realtor.com, Incline Village market data).
- Redfin showed a median sale price of $1.3 million for the three months to August 2026, down 12.4%, $715 per square foot, 62 days on market against 78 a year earlier, and 103 homes sold in August against 104 (Redfin, Incline Village housing market).
- A brokerage's single-family report showed a median sold price of $2,275,000 for August (down 11.3%), 16 homes sold (down 30.4%), 95 days on market and an average sold price of $3,411,531 (Local brokerage, Incline Village housing market report).
- Another brokerage's September update showed 32 closings for August (up 18.5%), a single-family median of $2,987,500 (up 7.7%), 105 condominium closings through August against 27, and a single-family median of $2,510,000 for the eight months (Local brokerage, Incline Village market update, September 2026). A July report showed a combined median of $1,235,000 and a single-family median of $2,175,000 on 12 sales (Local brokerage blog, Incline Village market report, July 2026).
- The Census describes a postal area where 3,240 of 7,758 homes (41.8%) are held for seasonal, recreational or occasional use and 48.2% of homes are vacant.
Why do Incline Village medians run from $1.2 million to $3.0 million?
Because the pages count different homes over different periods. The July report counts all property types, single-family homes, condominiums and planned developments, in Incline Village and Crystal Bay, and shows a median of $1,235,000 on 32 closed sales. The same report's single-family section shows $2,175,000 on 12 sales, down 13.0% on the year. The combined median is 43% below the single-family median, a gap this brief computes, and 12 of the 32 sales were single-family homes. The brokerage update for August gives $1,550,000 for the year to date and $2,510,000 for single-family homes over the same eight months, a ratio of 1.6.
The Realtor.com figures are not in step with either. Its median sold price is $1,800,000 for June and is up 49.69% on the year, while its median listing price is $1,310,000 and is down 11.97%. The sold median is 37.4% above the listing median, a ratio this brief computes, and the opposite of what a sale-to-list ratio of 97% would suggest if both described the same homes. Working back from the changes, a rise of 49.69% to $1,800,000 implies a year-earlier sold median of about $1,202,000, and a fall of 11.97% to $1,310,000 implies a year-earlier listing median of about $1,488,000. Those are this brief's calculations and not published figures.
A rise of nearly 50% in a sold median for a town of this size is more likely to reflect a change in which homes sold than a change in value. This is an inference, and the brokerage update supplies the support: it says the mix of sales shifted and that overall price metrics are being influenced by a change in market composition and not by appreciation or decline. Over three years Realtor.com shows a listing median down 33.72% and a sold median down 4%. The two medians cannot both describe the same homes.
Redfin shows a median sale price of $1.3 million for the three months to August, down 12.4%, and a price per square foot of $715, down 7.3%. This agrees with the July report's direction for the combined median, a fall of 20.1% on the year, and disagrees with the Realtor.com rise. A seller who read only the Realtor.com figure would think prices jumped by half. A seller who read only the other would think they fell by a fifth. This brief takes neither as a trend.
| Source | Figure | What it measures |
|---|---|---|
| Local blog (July) | $1,235,000 | Median sale price, all property types, July |
| Redfin | $1.3 million | Median sale price, three months to August |
| Local brokerage update | $1,550,000 | Median, all property types, January to August |
| Realtor.com | $1,800,000 | Median sold price, June |
| Local blog (July) | $2,175,000 | Median, single-family, July, 12 sales |
| Local brokerage report | $2,275,000 | Median, single-family, August, 16 sales |
| Local brokerage update | $2,987,500 | Median, single-family, August |
Sources as cited. The measures, areas and months differ and the figures are not directly comparable. Commercial content; not independently verified.
What did the condominium surge do to every headline number?
The brokerage update says the condominium market came back to life in 2026 in a way not seen in its dataset. Through August there were 105 condominium closings, against 27 in the same eight months of 2025, a rise of 3.9 times that this brief computes. Fifty of the 105 were priced below $1 million and spread over 47 complexes, against 8 in the same tier a year earlier. The update says many sold between $550,000 and $875,000 and that this was the pace of entry-level condominium sales not seen since 2020.
The effect on the combined median is arithmetic. Add 78 extra sales at the lower prices to a market where single-family homes sell for millions, and the middle sale moves down. The update puts the combined median for the eight months at $1,550,000 and says it reflects the mix shift and is not a price trend. Meanwhile the single-family median for the eight months is $2,510,000, up 7.5% from $2,335,000. On this account a seller of a single-family home should not read the combined median at all, and a seller of a condominium should not read the single-family one.
The update adds that even the single-family median needs care. It says price per square foot, the more like-for-like measure, is roughly flat for homes between $2 million and $5 million and 4% to 6% below last year for homes under $2 million. The single-family median rose partly because the sales moved toward higher-value homes. The update's own description is more activity at higher price points, not a rise in the value of the same home. These are the update's statements, and it is a brokerage's marketing page, not a statistical release.
The Realtor.com neighborhood table shows how mixed the market is. West Incline Village has 38 homes for sale with a median listing price of $2,195,000 and $877 per square foot. McCloud Condominiums has 12 for sale at $949,000 and $854 per square foot. The condominium building's price per square foot is within 3% of the single-family area's, a ratio this brief computes, which shows that a condominium here is priced for its place and not for its size. Of the 190 homes for sale, the 15 named areas account for 81, or 42.6%.
The update also notes that August produced one home at $8.5 million that closed in 53 days at full asking, and three more above $5 million. A single sale at $8.5 million moves the average a long way and leaves the median where it was, which is why the two measures differ. The brokerage that reports 16 single-family sales for August shows an average sold price of $3,411,531 against a median of $2,275,000, a ratio of 1.5. The average is a poor guide to a typical home when a handful of homes sell for several times the median.
Source: the brokerage update and Realtor.com page cited above. Percentages and ratios are this brief's arithmetic. Commercial content; not independently verified.
Do the pages agree on what a single-family home sold for in August?
They do not. A brokerage's single-family report shows a median sold price of $2,275,000 for August on 16 homes sold, down 11.3% on the year, with a count of homes sold down 30.4%. Another brokerage's update shows a single-family median of $2,987,500 for August, up 7.7% on $2,775,000 a year earlier, with 32 closings in the month, up 18.5%. The second median is 31.3% above the first, a gap this brief computes, and the two move in opposite directions on the year.
Part of the gap may be a matter of what is counted. This brief infers that the second update's 32 closings include condominiums, since the page says August produced 32 closings and that condominium activity is the year's story, while the first counts only single-family homes. Even so, a median of 16 sales can swing by hundreds of thousands of dollars on one or two sales, and neither page lists its sales. This brief cannot say which figure is closer to what a single-family home brought, and it flags the difference.
Redfin adds a third count. It says 103 homes sold in August, against 104 a year earlier, which is flat, while the first brokerage says single-family sales fell 30.4% and the second says closings rose 18.5%. Redfin's count of 103 is more than three times the second update's 32 for the same month. The boundaries are likely different, since Redfin's city page may include more of the surrounding area, and this is an inference. The practical point is that a sales count is not a fact that every page shares.
| Measure | Brokerage report | Brokerage update |
|---|---|---|
| Median sold price | $2,275,000 | $2,987,500 |
| Change on the year | -11.3% | 7.7% |
| Sales in the month | 16 single-family | 32 closings |
| Change in sales | -30.4% | 18.5% |
| Median days on market | 95 | 95 |
Sources as cited. Commercial content; not independently verified.
How long does a sale take, and how much supply is there?
The clocks run from 34 to 95 days. Realtor.com shows a median of 57 days on market for June, down 18.52% on the year, and calls the market warm. Redfin shows 62 days on average for the three months to August, against 78 a year earlier, and says homes sell in 77 days. The July report shows a median of 65.5 days for all types and 34 days for single-family homes. The August brokerage report shows 95 days for single-family homes, 14 days more than a year earlier, and the update shows 95 days against 81. Both August figures are 95, which agrees, and both differ from July's 34 by 61 days for the same kind of home.
The supply figures show a market moving. The brokerage update says that single-family supply was 3.7 months in May and 6.1 months in August, which it describes as moving from a seller's market to a balanced one, and notes that six months is the conventional boundary. It adds that active single-family inventory rose from 53 listings in January to 87 in July and 86 in August. The July report shows 89 single-family listings and 4.9 months of supply, and 175 listings of all types at 5.5 months. The July counts of 87 and 89 differ slightly, and both describe the same direction.
The counts of homes for sale agree in direction. Realtor.com shows 190 homes for sale in June, down 7.11% on the year, and the July report shows 175 active listings of all types, down 8.4% on the year. The two cover different months and may cover different boundaries, and neither page explains the difference of 15.
The sale-to-list ratios agree more closely. Realtor.com shows 97%, with homes selling 3.17% below the asking price. The July report shows 97.8% for all types and 97.7% for single-family homes. The brokerage update shows 95.9% against the final asking price and 92.2% against the original asking price. A ratio of 92.2% against the original means the typical home sold 7.8% below where it was first listed, and on a $2,987,500 home that is about $233,000. This brief computes that as an illustration, and no page states it.
| Source | Figure | What it measures |
|---|---|---|
| July report | 34 days | Median, single-family, July |
| Realtor.com | 57 days | Median days on market, June |
| Redfin | 62 days | Average, three months to August |
| July report | 65.5 days | Median, all property types, July |
| Redfin | 77 days | Stated for the city, method not given |
| Brokerage report and update | 95 days | Median, single-family, August |
Sources as cited. Commercial content; not independently verified.
What does the Census say about homes held for seasonal use?
The Census describes a postal area where much of the housing is not lived in all year. Of 7,758 homes, 4,021 are occupied and 3,737 (48.2%) are vacant. Of the vacant homes, 3,240 are classed as held for seasonal, recreational or occasional use, which is 41.8% of all homes and 86.7% of the vacant ones, ratios this brief computes. Only 20 homes are vacant because they are for sale and 78 because they are for rent. The postal area has 9,285 people, a median household income of $166,509 and a median rent of $1,961.
Among the 2,860 owner-occupied homes, 133 (4.7%) have owners who moved in in 1989 or earlier, 432 (15.1%) in the 1990s, 440 (15.4%) in the 2000s, 1,203 (42.1%) in the 2010s, 512 (17.9%) in 2020 to 2022 and 140 (4.9%) in 2023 or later. Owners who moved in since 2010 number 1,855, or 64.9%. The 2010s are the largest group, and it fits with the brokerage account of the recent years. Among the 1,161 rented homes, 550 (47.4%) have renters who moved in since 2020, and 500 (43.1%) in the 2010s.
The count of seasonal homes matters for a seller because it changes who the buyers are. A home held for occasional use is bought by someone who lives elsewhere, and the pages say little about how that buyer decides. The Census count shows almost one vacant home for every occupied one. A public listing of such a home is a signal to the neighborhood, since the owner is often away, and a seller may prefer that the sale not be visible.
The Census median owner-occupied value is $1,461,200, with a margin of error of $169,105, or 11.6%. It is 19% below the Realtor.com sold median of $1,800,000, 35.8% below the August single-family median of $2,275,000 and 42% below the combined year-to-date single-family median of $2,510,000, ratios this brief computes. It is also 18% above the July combined median of $1,235,000. The Census figure is owners' own estimate over five years and lags the market, and it sits among the published medians, which is another reminder that none of them describes a particular house.
The age of the homes is mixed. The median year built is 1981, and 3,661 of 7,758 homes (47.2%) were built before 1980. The largest groups are the 1970s with 2,435 homes and the 1980s with 2,003. A town of mountain homes from the 1970s and 1980s has roofs, decks, septic or sewer connections and wood stoves of the same age, which a buyer's inspection raises. Readers comparing markets can also read the Reno brief and the Summerlin South brief.
Source: Census Reporter, American Community Survey 2020-2024 five-year estimates, tables B25038, B25004, B25034, B25077, B25003, B25002 and B19013. Percentages and ratios are this brief's arithmetic.
What should an owner ask, and what does a private sale change?
Ask whether a figure is for single-family homes, condominiums or both. Ask which months it covers, and how many sales are behind it. Ask whether a page's price change compares the same homes or a different mix. A seller who has the answers can read a page, and a seller who does not will find that five pages give five medians and opposite directions.
A private sale changes how a home reaches a buyer. With Maison Off-Market there are no showings and no neighbors talking about a sale, the closing date can be flexible so that an owner has time to find a new home, there are no commission costs, there are no closing costs and there are no inspections or repairs. For an owner of a home in a postal area where 47.2% of homes were built before 1980, a sale without inspections or repairs removes a list of work that a buyer would otherwise raise. This brief does not claim that a private sale always brings a higher price than a public listing.
Fee arithmetic shows what the commission point means in dollars, without assuming any rate. Each 1% of a sale price is $12,350 at $1,235,000, $22,750 at $2,275,000 and $29,875 at $2,987,500. At 3% those amounts are $37,050, $68,250 and $89,625. At 5% they are $61,750, $113,750 and $149,375. These are illustrations of what a percentage means on the figures in this brief, and they are not a statement of what any agent charges or what any sale would cost.
Timing is the other thing an owner controls. A public listing starts a clock, and the pages above show 34 to 95 days, with single-family supply moving from 3.7 to 6.1 months between May and August. A private sale lets the owner choose the closing date, which matters most to owners who need to find the next home first, or who would rather close before winter.
Privacy is often the first thing owners raise. A public listing puts photographs, a price and every price change in front of anyone, and in a town where 41.8% of homes are held for occasional use a visible sale tells the neighborhood that a house is changing hands. A private sale keeps those details out of view. That is a matter of preference and not a claim about price.
If you are weighing a sale of an Incline Village home, one conversation costs nothing and obliges you to nothing. We ask about the home, the timing you would like and what you would need from a buyer, and we say plainly whether a private sale fits.
If you would like a private, no-obligation offer for an Incline Village home, call 401-219-4207 or use the contact form on this site.
Methodology and limitations
Prices, days on market, counts and ratios come from a Realtor.com page with indicators as of June 2026, a Redfin page with data to August 2026, a brokerage single-family report for August 2026, a brokerage update dated September 2026 with data through August 31, and a brokerage blog report for July 2026. The pages cover different periods, property types and boundaries, and most are commercial pages, so they are not independent of each other. Two August single-family medians, $2,275,000 and $2,987,500, cannot be reconciled from the pages, and Realtor.com's rise of 49.69% sits against Redfin's fall of 12.4%; both are flagged above. The Census figures are five-year estimates for a postal area.
Conclusion
The Incline Village record shows medians from $1,235,000 for all property types to $2,987,500 for single-family homes, a Realtor.com rise of 49.69% beside a Redfin fall of 12.4%, and waits of 34 to 95 days. The pages differ because a surge in condominium sales changed the mix, and because the Census counts 3,240 homes held for seasonal use.
Frequently Asked Questions
What is the median home price in Incline Village?
Pages differ. A July report shows $1,235,000 for all property types, Realtor.com shows $1,800,000 sold for June, and two August single-family medians are $2,275,000 and $2,987,500.
Are Incline Village home prices rising or falling?
Realtor.com shows a sold median up 49.69% on the year and Redfin shows a median down 12.4%. A brokerage says a surge in condominium sales changed the mix and that single-family homes for the eight months are up 7.5%.
How long do homes take to sell in Incline Village?
Realtor.com shows a median of 57 days on market and Redfin shows 62 days. A brokerage shows 95 days for single-family homes in August, and a July report shows 34 days.
How much is 1% of an Incline Village home price?
It is $12,350 at $1,235,000 and $22,750 at $2,275,000. At 3% those amounts are $37,050 and $68,250. This is arithmetic and not an agent's rate.
Can I sell my Incline Village home privately?
Yes. Maison Off-Market buys luxury homes and estates directly from their owners with no showings, flexible closing dates, no commission costs, no closing costs and no inspections or repairs. Call 401-219-4207 or use the contact form.
Compare your options before committing. Request a written private offer for your property, with no obligation, then weigh it against your listing plan.
Sources
- Realtor.com, 2026. Incline Village Housing Market and Rental Trends. https://www.realtor.com/local/market/nevada/washoe-county/incline-village.
- Redfin, 2026. Incline Village Housing Market. https://www.redfin.com/city/31207/NV/Incline-Village/housing-market.
- Local brokerage, 2026. Incline Village Housing Market Report. https://www.nevadarealestategroup.com/market-report/cities/incline-village/.
- Local brokerage, 2026. Incline Village Market Update, September 2026. https://mingpoonrealestate.com/blog/incline-brief-september-2026.
- Local brokerage blog, 2026. Incline Village Market Report, July 2026. https://renorealtyblog.com/incline-village-market-report-july-2026/.
Related research

Seller Guide · October 6, 2026
How to Prepare Point Pleasant Beach Rental Records Before Selling
Separate rental approval, income history and booked stays before comparing sale terms.

Seller Guide · October 6, 2026
How to Prepare Rumson Flood and Waterfront Records Before Selling
Separate flood disclosure, elevation, repairs and waterfront rights before comparing sale terms.

Seller Guide · October 6, 2026
How to Prepare Sarasota Condo Inspection and Reserve Records Before Selling
Separate building condition, reserve funding and resale documents before comparing sale terms.