Market Brief · by Aidan Sowa · October 5, 2026
Is Bethesda a Seller's Market or a Balanced One? Reading a Sold Median and a Three-Month Median
Reading a Sold Median and a Three-Month Median for Bethesda, MD, with each source dated and its limits noted, for owners weighing a listing against a direct sale.
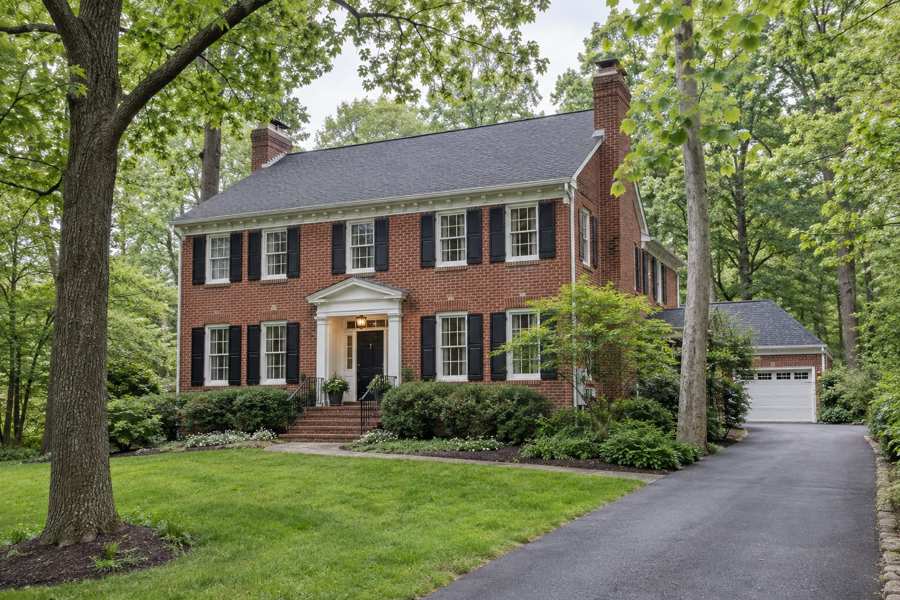
Is Bethesda a seller's market or a balanced one? The pages that cover it disagree. Realtor.com's Bethesda page, in the version available for this brief, shows a median sold price of $1,290,000, a sale-to-list ratio of 100% and the words seller's market. A September summary of the same page, as reported by a Washington brokerage, shows a median asking price of $1,212,450, down 8.01% on the year, and calls the market balanced. Redfin shows $1,349,107 for the three months to August and a typical home that sold in 35 days. Zillow shows a typical value of $1,121,468 and homes going to pending in 28 days. The span from the lowest to the highest figure is 20%, a ratio this brief computes.
The disagreement is mostly about what each number measures. A typical value is an estimate across all homes, whether or not they sell. A sold median is what closed in a window. A listing median is what sellers asked. Bethesda is also a place where the same name covers condominiums beside the Metro, 1950s houses near Chevy Chase and large houses on wooded lots, so a single figure for the city describes very few of them.
Maison Off-Market buys luxury homes and estates directly from their owners and speaks only to sellers. We do not appraise homes, and nothing here is a valuation. This brief sets the published figures side by side, notes where pages are stale or conflict, adds a Census cut on the age of the homes and how long owners have stayed, and shows what a percentage of a price is worth in dollars. Every calculation is this brief's own arithmetic and every inference is labeled as one.
Key Findings
- Realtor.com showed a median listing price of $1,299,000 (down 12.20% on the year), a median sold price of $1,290,000 (up 3.82%), $455 per square foot, 466 active listings, 38 days on market, a sale-to-list ratio of 100% and a median rent of $3,735, with indicators dated June 2026 in the version of the page fetched (Realtor.com, Bethesda market data).
- Redfin showed a median sale price of about $1.3 million for the three months to June 2026, 22 days on market, 271 homes sold in June against 230 a year earlier, a sale-to-list ratio of 99.8%, 34.4% of homes sold above list and 31.6% with price drops (Redfin, Bethesda housing market).
- Zillow showed a typical home value of $1,121,468 as of August 31, 2026, up 0.7% on the year, with homes going to pending in around 28 days (Zillow, Bethesda home values).
- A Washington brokerage's September 30 snapshot reported a Redfin median of $1,349,107 for the three months to August, 222 sales in August against 234 a year earlier, a Realtor.com median asking price of $1,212,450 with 416 active listings and a Zillow count of 277 listings (Local brokerage blog, Bethesda three-source snapshot).
- The Census describes a postal area of 37,454 people where 65.9% of homes were built before 1980, the median year built is 1969, 81.4% of occupied homes are owner-occupied and 15.6% of owners moved in in 1989 or earlier.
Is Bethesda a seller's market or a balanced one?
Realtor.com's page, in the version fetched for this brief, says that homes in Bethesda sold for about the asking price in June 2026 with a sale-to-list ratio of 100%, that the Hotness Index shows a warm market with homes selling in a median of 38 days and that Bethesda was a seller's market. Redfin's June figures point the same way: it calls the market very competitive, with 2 offers on average and sales in around 22 days, and its compete score is high. Redfin also shows that 34.4% of homes sold above list in June and that 31.6% had price drops, so about one home in three sold above its asking price and about one in three cut it.
The brokerage's September snapshot gives a different label. It reports that Realtor.com's September summary describes Bethesda as balanced, with a median asking price of $1,212,450, down 8.01% on the year, 416 active listings and 57 days of listing time. It reports Redfin's three-month window to August at 35 days and Zillow's days to pending at 28. The three clocks, 28, 35 and 57 days, measure three different things: the time to a contract, the time on the market of homes that sold and the age of the listings that were still for sale.
The June and September readings can both be true. The inference is that Bethesda moved from a market where sellers got their price in June toward a market with more homes and longer waits by September. The supporting figures are the Realtor.com active count of 466 in June against 416 in September (the page and the snapshot may count differently) and the Realtor.com median asking price falling from $1,299,000 to $1,212,450, which is 6.7% and is this brief's computation. A fall in the asking median can come from a change in the mix of homes for sale as much as from price cuts, so the figure does not prove that any home lost value.
The Realtor.com page also says that specific market metrics for Bethesda are not available and that the reader should look at Montgomery County, while it shows a full table for Bethesda directly above. That sentence is boilerplate, and the table is the page's real content. The page is also stale in the version fetched here: its indicators are dated June 2026, while the brokerage reports the page's September summary. A reader who opens a cached copy gets the June reading.
| Measure | Value | One-year change | Three-year change |
|---|---|---|---|
| Median listing price | $1,299,000 | -12.20% | 1.77% |
| Median sold price | $1,290,000 | 3.82% | 1.88% |
| Price per square foot | $455 | 0.96% | 0.90% |
| Active listings | 466 | 8.39% | 116.27% |
| Median days on market | 38 | 15.87% | 38.46% |
| Rental properties | 332 | 27.02% | -35.45% |
| Median rent | $3,735 | -1.06% | 26.61% |
Source: Realtor.com Economic Research, as shown on the page. Commercial content; not independently verified.
Which Bethesda price is the real one?
Six published figures run from $1,121,468 to $1,349,107. Zillow's $1,121,468 is a home value index, an estimate of the typical value across all homes in the city on August 31. Realtor.com's $1,212,450 is a September median asking price and its $1,290,000 is a June median sold price. Redfin's $1,349,107 is a median sale price for the three months to August, and its earlier figure of about $1.3 million is for the three months to June. The highest is 20.3% above the lowest, a ratio this brief computes.
Two of the numbers deserve attention. First, the Redfin median of $1,349,107 is 11.3% above Realtor.com's $1,212,450 asking median, which means that homes sold for more than the median home was offered for. That can only be true if the homes that sold were larger or better than the ones listed, or if the windows differ. The snapshot warns against averaging the figures for the same reason. Second, Redfin's median sale price of about $1.3 million was down 0.054% on the year in June, while the August window was up 0.7%. Both are flat. A market whose sold median moves by less than 1% in a year is not a market in which sellers got a large premium or took a large cut.
The Census owner value in the same postal area, $1,183,600 with a margin of error of $25,688, sits between the Zillow figure and the Realtor.com median. It is 8.2% below the June sold median and 12.3% below Redfin's August figure, ratios this brief computes. The Census asks owners what they think their home is worth, and the five-year average lags a flat market. The gap is not large, and it tells a seller that owners in the postal area already think of their homes as worth more than $1.1 million.
The scale of the percentages is large in dollars. One percent of $1,290,000 is $12,900, and one percent of $1,349,107 is $13,491. The $136,657 gap between the Redfin sold median of $1,349,107 and the Realtor.com asking median of $1,212,450 equals 11.3 percent of the Realtor.com figure. A seller who reads the wrong page for the home's segment can be off by more than most commissions.
| Source | Figure | What it measures |
|---|---|---|
| Zillow | $1,121,468 | Typical home value index, August 31 |
| Realtor.com | $1,212,450 | Median asking price, September summary |
| Realtor.com | $1,290,000 | Median sold price, June |
| Realtor.com | $1,299,000 | Median listing price, June |
| Redfin | About $1,300,000 | Median sale price, three months to June |
| Redfin | $1,349,107 | Median sale price, three months to August |
Sources as cited. The measures and periods differ and the figures are not directly comparable. Commercial content; not independently verified.
How uneven are the places the Bethesda page lists?
Realtor.com's neighborhood table for Bethesda is a reminder of how loosely the name is used. It lists Chevy Chase at a median listing price of $1,685,000 and $503 per square foot, American University Park at $1,750,000 and $577, Barnaby Woods at $1,749,900 and $487, Chevy Chase-DC at $1,499,000 and $523 and Friendship Heights at $1,049,000 and $642. It also lists Friendship Village at $395,000 and $380. The highest listing median is 4.4 times the lowest, a ratio this brief computes, while the highest price per square foot is 1.7 times the lowest.
Several of those names do not look like Bethesda neighborhoods. The page lists Chevy Chase-DC and Tenleytown, and its own text points readers to a group of postal areas, so the table appears to cover a wider search area than the city. This is an inference from the labels. A seller in Bethesda should not read rows for places outside the city as a description of their street, and this brief does not use them to value any home.
The counts and clocks differ too. The page shows 54 homes for sale in Chevy Chase, 54 in Friendship Village, 54 in Chevy Chase-DC, 20 in Friendship Heights and 14 in American University Park, with days on market of 32, 46, 24, 42 and 25. The ranking by speed does not follow the ranking by price. Friendship Village, the cheapest, takes 46 days, while Chevy Chase-DC at $1,499,000 takes 24, so the cheapest homes did not sell fastest in these rows.
The practical point is that a Bethesda median is a blend of condominiums, 1950s houses and larger homes on the Chevy Chase edge, and the right comparison for a particular house is the same street type, the same size and the same year of construction. None of the pages supply that.
Source: Realtor.com, as cited above. Ratios are this brief's arithmetic. Commercial content; not independently verified.
How long does a Bethesda sale take, and who competes?
The clocks in the snapshot are 28, 35 and 57 days, and the 22 days on Redfin's June page is a fourth. Redfin's June page says homes receive 2 offers on average and that the market is very competitive. Its three-month figure for August of 35 days is 59% longer than the 22 days of June, a change this brief computes. Sales also fell: Redfin counted 222 in August against 234 a year earlier, a drop of 5.1%, after 271 in June against 230 a year earlier, a rise of 17.8%.
Supply moved at the same time. The snapshot reports 416 active listings on Realtor.com in September and 277 on Zillow on August 31 with 83 new listings. Their ratio is 1.5, a figure that shows how the counts depend on the provider. Zillow's 83 new listings on 277 means that 30% of its inventory was new, so the stock turned over. Realtor.com's June count of 466 was 8.39% above a year earlier and 116.27% above three years earlier.
Sale-to-list is the figure with the most direct meaning. Redfin's June ratio of 99.8% means that the median sale was 0.2% below the asking price. On a $1,290,000 sale that is about $2,600. The 34.4% of homes sold above list shows that the middle of the market did well, and the 31.6% with price drops shows that a third did not. Redfin's own comparison shows the ratio down 0.51 points from the year before.
None of this tells a seller how long a particular house will take. The snapshot says as much: city data cannot establish value or leverage for a specific house or unit, and a decision needs comparable sales and an address-level review.
| Source | Figure | What it measures |
|---|---|---|
| Redfin | 22 days | Median days on market, three months to June |
| Zillow | 28 days | Around the time to pending, August 31 |
| Redfin | 35 days | Median days on market, three months to August |
| Realtor.com | 38 days | Median days on market, June |
| Realtor.com | 57 days | Listing days on market, September, as reported |
| Realtor.com | 416 | Active listings, September, as reported |
| Zillow | 277 | For-sale listings, August 31, as reported |
Sources as cited. Commercial content; not independently verified.
What does the Census say about the homes and the owners?
The Census describes a postal area of 37,454 people and 14,357 homes with a median household income of $249,332 and a median rent of $3,185. Of the homes, 9,462 (65.9%) were built before 1980, and the median year built is 1969. By decade, 3,487 homes (24.3%) date from the 1950s, 2,909 (20.3%) from the 1960s, 1,902 (13.2%) from the 1970s, 1,614 (11.2%) from the 1980s and 520 (3.6%) from the 1990s. Newer homes are fewer: 1,293 (9.0%) from the 2000s, 1,129 (7.9%) from the 2010s and 339 (2.4%) since 2020. Homes built in the 1950s and 1960s together number 6,396, or 44.5%.
The stock matters because most buyers of a home from the 1950s or 1960s expect to inspect it, price its roof, windows and mechanical systems and often plan to renovate or rebuild. A sale on the open market puts those items in front of an inspector and a negotiation. This is an inference about how buyers behave, and the Census does not measure it.
Of 13,660 occupied homes, 11,113 (81.4%) are owner-occupied and 2,547 (18.6%) are rented, and 697 homes (4.9%) are vacant. The vacant homes include 199 for sale only, 55 for rent, 56 held for seasonal or occasional use, 22 rented but not occupied, 23 sold but not occupied and 342 in other categories. The 342 in other categories are 2.4% of all homes, and they are the group a seller might wonder about, since the Census does not say what they are.
The Census also asks when owners moved in. Of the 11,113 owners, 3,979 (35.8%) moved in in the 2010s, 2,332 (21.0%) in the 2000s, 1,731 (15.6%) in 1989 or earlier, 1,623 (14.6%) in the 1990s, 1,237 (11.1%) in 2020 to 2022 and 211 (1.9%) in 2023 or later. Owners who moved in before 2000 number 3,354, or 30.2%, and many of them bought before the long rise in prices.
The Census median owner-occupied value is $1,183,600, with a margin of error of $25,688, or 2.2%. Owners who have lived in their homes for a generation sit on a large gain, and the figures show that decisions about whether and when to sell are theirs to make, with no deadline from the market. Readers comparing markets can also read the Chevy Chase brief and the Vineyards brief.
Source: Census Reporter, American Community Survey 2020-2024 five-year estimates, tables B25034, B25038, B25004, B25077, B25003, B25002 and B19013. Percentages and ratios are this brief's arithmetic.
What should an owner ask, and what does a private sale change?
Ask which Bethesda a figure covers: the city, the postal area, a neighborhood or a set that includes places outside the city. Ask which period and how many sales are behind it. Ask whether a price is a listing price, a sold price or an estimate. A seller who has the answers can read a page, and a seller who does not will find that three providers give three prices and two labels for the market.
A private sale changes how a home reaches a buyer. With Maison Off-Market there are no showings and no neighbors talking about a sale, the closing date can be flexible so that an owner has time to find a new home, there are no commission costs, there are no closing costs and there are no inspections or repairs. For an owner of a 1950s house, the last point matters, because an older home is where an inspection list tends to grow. This brief does not claim that a private sale always brings a higher price than a public listing.
Fee arithmetic shows what the commission point means in dollars, without assuming any rate. Each 1% of a sale price is $12,900 at $1,290,000, $13,491 at $1,349,107 and $12,124 at $1,212,450. At 3% those amounts are $38,700, $40,473 and $36,374. At 5% they are $64,500, $67,455 and $60,622. These are illustrations of what a percentage means on the figures in this brief, and they are not a statement of what any agent charges or what any sale would cost.
Timing is the other thing an owner controls. A public listing starts a clock, and the pages above show 22 to 57 days. A private sale lets the owner choose the closing date, which matters most to people who need to find the next home first or who want to close after a school year.
Privacy is often the first thing owners raise. A public listing puts photographs, a price and every price change in front of anyone, and Redfin shows that 31.6% of homes had price drops in June, a fact neighbors can read. A private sale keeps those details out of view. That is a matter of preference and not a claim about price.
If you are weighing a sale of a Bethesda home, one conversation costs nothing and obliges you to nothing. We ask about the home, the timing you would like and what you would need from a buyer, and we say plainly whether a private sale fits.
If you would like a private, no-obligation offer for a Bethesda home, call 401-219-4207 or use the contact form on this site.
Methodology and limitations
Prices, days on market, counts and ratios come from a Realtor.com page whose fetched version shows indicators as of June 2026 (a brokerage reports the page's September summary), a Redfin page whose fetched version shows data to June 2026, a Zillow page updated August 31, 2026 and a brokerage snapshot dated September 30, 2026 that reports figures from all three. Several figures here, including the Redfin August window and the September Realtor.com figures, are known only through that snapshot and are attributed to it. The pages cover different periods and boundaries and are commercial, so they are not independent of each other. The Realtor.com page lists neighborhoods that look wider than the city and says metrics for Bethesda are unavailable while showing them. The Census figures are five-year estimates for a postal area.
Conclusion
The Bethesda record shows sold medians from $1,290,000 to $1,349,107, a typical value of $1,121,468, a seller's market label on one page and a balanced label on another, waits from 22 to 57 days, and a stock where 65.9% of homes predate 1980. The pages differ because they measure different things in different months, and because the name covers very different homes.
Frequently Asked Questions
What is the median home price in Bethesda?
Pages differ. Realtor.com showed a median sold price of $1,290,000 in June 2026, Redfin showed $1,349,107 for the three months to August as reported by a brokerage, and Zillow shows a typical value of $1,121,468.
Is Bethesda a seller's market?
Realtor.com's June page called it a seller's market with a sale-to-list ratio of 100%, while a brokerage reports that its September summary called it balanced. Redfin's June page called it very competitive.
How long do homes take to sell in Bethesda?
Redfin showed 22 days in June and 35 days for the window to August, Zillow shows around 28 days to pending, and a brokerage reports 57 listing days on Realtor.com in September.
How much is 1% of a Bethesda home price?
It is $12,900 at $1,290,000 and $13,491 at $1,349,107. At 3% those amounts are $38,700 and $40,473. This is arithmetic and not an agent's rate.
Can I sell my Bethesda home privately?
Yes. Maison Off-Market buys luxury homes and estates directly from their owners with no showings, flexible closing dates, no commission costs, no closing costs and no inspections or repairs. Call 401-219-4207 or use the contact form.
Compare your options before committing. Request a written private offer for your property, with no obligation, then weigh it against your listing plan.
Sources
- Realtor.com, 2026. Bethesda, MD Housing Market and Rental Trends. https://www.realtor.com/local/market/maryland/montgomery-county/bethesda.
- Redfin, 2026. Bethesda Housing Market. https://www.redfin.com/city/21534/MD/Bethesda/housing-market.
- Zillow, 2026. Bethesda Home Values. https://www.zillow.com/home-values/37406/bethesda-md/.
- Local brokerage blog, 2026. Bethesda Three-Source Housing Snapshot: August and September 2026. https://lizlavetteshorb.com/research/bethesda-three-source-market-snapshot-august-september-2026.
Related research

Seller Guide · October 6, 2026
How to Prepare Point Pleasant Beach Rental Records Before Selling
Separate rental approval, income history and booked stays before comparing sale terms.

Seller Guide · October 6, 2026
How to Prepare Rumson Flood and Waterfront Records Before Selling
Separate flood disclosure, elevation, repairs and waterfront rights before comparing sale terms.

Seller Guide · October 6, 2026
How to Prepare Sarasota Condo Inspection and Reserve Records Before Selling
Separate building condition, reserve funding and resale documents before comparing sale terms.