Market Brief · by Aidan Sowa · October 5, 2026
Is Bellevue One Market or Many? Reading Different Home Counts and Different Waits
Reading Different Home Counts and Different Waits for Bellevue, WA, with each source dated and its limits noted, for owners weighing a listing against a direct sale.
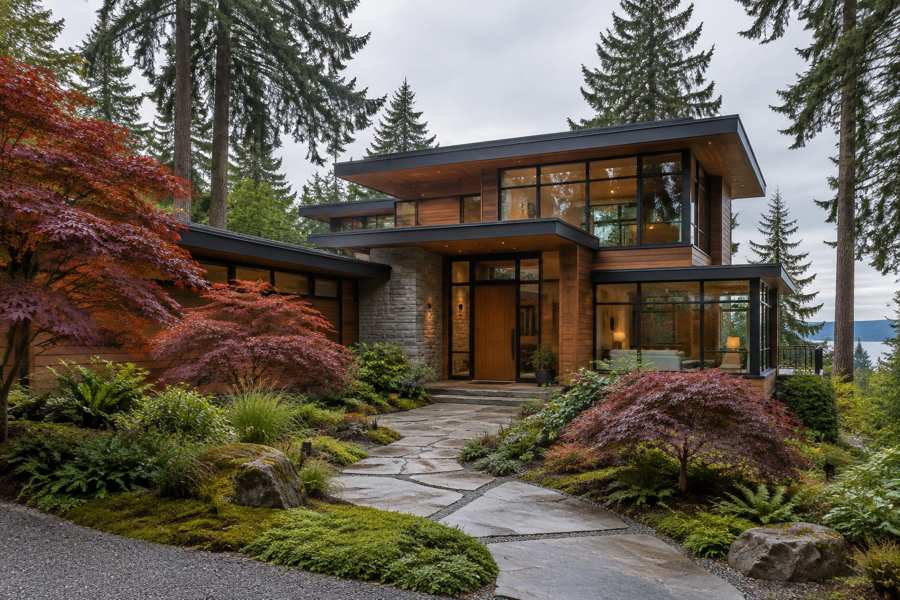
How many homes are for sale in this part of Bellevue? Realtor.com counts 113 for September 2026, up 55.81% on the year. A second page that draws on Realtor.com data counts 115. RealtyTrac, a property data site, counts 836 for July, up 19.94% on August 2025. The first two are close, and the third is seven times as large. Something different is being counted, and the difference matters to a seller who is trying to judge how crowded the field is.
The wait splits in the same way. Realtor.com reports a median of 34 days on the market, down 12.82% on the year. Redfin reports that homes sell in around 14 days, against 8 a year earlier, and calls the area very competitive, with an average of two offers per home. Prices agree better: a sold median of $1,498,000 on one page and $1.5 million on the other. The Census adds a fact that none of the market pages mention. Of the 10,117 homes in the postal area, 7,358, or 72.7%, were built before 1980.
This brief reads the Realtor.com page, the Redfin page, a second local report and the RealtyTrac page side by side, adds the Census profile of the postal area and the Seattle area series, and asks what the numbers mean for an owner who is choosing between a public listing and a private sale.
Key Findings
- Realtor.com reported, as of September 2026, a median listing price of $1,600,000 for this part of Bellevue (down 3% on the month and up 2.56% on the year), a median sold price of $1,498,000 (down 2.25% and down 3.35%), $683 per square foot (up 3.77% and down 0.59%), 113 homes for sale (up 8.94% and up 55.81%) and a median of 34 days on market (down 5.56% and down 12.82%).
- The same page gave a sale-to-list ratio of 99%, with homes selling 1.36% below the asking price, called September 2026 a balanced market and a warm one, and counted 15 rentals (down 38.10% on the year) at a median rent of $4,050 a month (up 3.85%).
- Redfin reported, for the three months to August 2026, a median sale price of $1.5 million (down 3.8% on the year), $652 per square foot (down 1.8%), 14 days on market against 8 a year earlier and 89 homes sold in August against 96. It called the market very competitive.
- In the Census postal area, 9,431 of 10,117 housing units are occupied, 686 (6.8%) are vacant, owners hold 6,792 of the occupied homes (72.0%), the median household income is $184,583 and the owner-estimated median home value is $1,206,200 (Census Reporter, American Community Survey profile).
- In the Seattle-Tacoma-Bellevue area the median days on market was 34 in April 2026 and 45 in August (Realtor.com, days on market).
Why is the count of homes for sale 113 on one page and 836 on another?
The two Realtor.com based pages agree, within two homes. The first says 113 active listings, up 55.81% on the year. The second says 115 active, up 35.3% from 85 a year earlier, with 26 pending sales, which it describes as a pending ratio of 23%. The year-ago figures differ, since 113 up 55.81% implies about 73, and the second page says 85. They are likely to be using different counting dates.
RealtyTrac says something else. Its summary table shows 697 homes for sale in August 2025 and 836 in July 2026, a rise of 19.94%, and 197 homes sold in the first month against 151 in the second, a fall of 23.35%. Its text says that 829 homes are currently listed, that 429 were sold in the past twelve months, and that prices range from $5,000 to $6,595,000. A listing at $5,000 is not a house. It is likely a land parcel, a lot share or an error, and the range hints at what the page counts.
The likely explanation is that RealtyTrac counts a wider group of properties: land, condominiums, manufactured homes, pre-foreclosure notices or listings from other sources. It also may cover a wider area than the Realtor.com page. The pages do not say, so the reason is an inference. What is plain is that 836 is 7.4 times 113, and that no owner of a single family home faces 836 rivals.
A buyer reading the 836 figure might think the area was flooded with homes and might offer low. A seller reading it might panic. Neither would be right. The 113 figure describes a market that has grown by about 40 homes in a year, which is a real change but a modest one, and which still leaves a buyer choosing among fewer than 120 houses.
The sensible reading is that the Realtor.com figures describe homes on the market and the RealtyTrac figures describe something broader. For a seller, the count that matters is the number of comparable homes that a buyer might choose instead, and that is much closer to 113 than to 836, and probably smaller still once condominiums and different price bands are set aside.
| Source and month | Homes for sale | Change on the year | Homes sold |
|---|---|---|---|
| Realtor.com, September 2026 | 113 | +55.81% | not stated |
| Second local report using Realtor.com data, September 2026 | 115 | +35.3% | 26 pending |
| RealtyTrac, July 2026 | 836 | +19.94% | 151 in the month |
| Redfin, August 2026 | not stated | not stated | 89 in the month |
Source: Realtor.com, Redfin, RealtyTrac and a local report as cited. The 73, 7.4 and 23% figures are this brief's arithmetic from the stated changes and counts. The explanation of what RealtyTrac counts is this brief's inference and not a statement of any page. Commercial content; not independently verified.
Is the wait 34 days or 14?
Realtor.com gives a median of 34 days for homes that are for sale, which implies about 39 days a year earlier. The second local report gives 40 days now and 40 last year. Redfin gives 14 days for the three months to August, up from 8, and a competitiveness score that says homes sell in 12 days. The range is 12 to 40 days.
The measures differ. Redfin's 14 days is the median time to go under contract for homes that sold. A home that is priced well and gets two offers leaves the market within two weeks. Realtor.com's 34 days counts homes that are still listed, and it includes the ones that have been there a while. Both are right. They answer different questions: how fast does a good listing sell, and how long has the typical listing waited?
The direction is a warning, though. On Redfin, the wait rose by 75%, from 8 days to 14, in a year. The count of homes sold fell from 96 to 89, a drop of 7.3%. Sales that take longer, in smaller numbers, in a stock that has grown by half, are signs of a market that is loosening, even if it is still quick by most standards.
The Seattle area is slower. Its median days on market was 45 in August, so Realtor.com's 34 for this area is 11 days, or 24%, quicker than the region. A seller here has an edge over the region, and a seller who prices wrongly loses it fast.
Source: Realtor.com, Redfin and a local report as cited, and Realtor.com series for the Seattle area. The 39 day, 75%, 7.3%, 11 day and 24% figures are this brief's arithmetic. The explanation of the measures is this brief's reasoning. Commercial content; not independently verified.
What do the prices say once the labels are straightened out?
The two Realtor.com based pages give the same figure of $1,498,000 and call it different things. The main page calls it the median sold price, down 3.35% on the year. The second page calls it the median listing price, down 5.1% from $1,579,250. The main page's listing median is $1,600,000. One of the two labels is wrong, or the pages measure different months. Sellers should not rely on a label without checking the page that it came from.
Redfin's sale median of $1.5 million, down 3.8%, agrees with $1,498,000 as a sold figure. RealtyTrac's median sales price of $1,459,857 and a median sold price of $1.4 million for both August 2025 and July 2026 are lower by about $40,000 to $100,000, and flat on the year. The sold median is therefore near $1.5 million, give or take 5%, and flat or down a little.
The asking price runs about $100,000 above it. The listing median of $1,600,000 is $102,000, or 6.4%, above the sold median. The sale-to-list ratio of 99% and the 1.36% discount imply that a typical $1,498,000 sale gave up about $20,400 from its asking price. The gap between the medians is larger than the discount because the medians describe different groups of homes.
There is a point about timing too. The Realtor.com page is for September, Redfin's is for the three months to August, and RealtyTrac's is for July. Each source lags the one before it by a month or so, and in a market that is changing, a month matters. The stock was up 8.94% in the month to September alone, so a figure from July would have been lower.
The year-ago figures are close. A listing median of $1.6 million up 2.56% implies about $1,560,000 a year earlier, and a sold median down 3.35% implies about $1,550,000. Price per square foot barely moves: $683 on listings, up 3.77% on the month, and $652 on sales on Redfin, down 1.8%. This is a market in which the price is steady and the pace has softened.
| Measure | Realtor.com, September | Redfin, three months to August |
|---|---|---|
| Median sold price | $1,498,000 (-3.35%) | $1.5 million (-3.8%) |
| Median listing price | $1,600,000 (+2.56%) | not stated |
| Price per square foot | $683 (-0.59%) | $652 (-1.8%) |
| Days on market | 34 (-12.82%) | 14 (8 a year earlier) |
| Homes sold | not stated | 89 in August (96 a year earlier) |
Source: Realtor.com, Redfin, RealtyTrac and a local report as cited. The $102,000, 6.4%, $20,400, $1,560,000 and $1,550,000 figures are this brief's arithmetic. The remark about the labels is this brief's observation. Commercial content; not independently verified.
What does the Census say about a stock that is mostly ramblers and split levels?
The postal area has 10,117 homes, and they are old. The Census counts 3,229 homes from the 1960s (31.9%) and 2,100 from the 1950s (20.8%), 1,738 from the 1970s (17.2%) and 244 from 1939 or earlier (2.4%). Together, the three decades from 1950 to 1979 hold 7,067 homes, 69.9%. Only 1,722 homes were built since 1990, which is 17.0%, and the median year built is 1968.
That stock is a fact for any seller. A home from 1965 is 61 years old, and a buyer at $1.5 million for a house of that age is often paying for the lot and the location. The value of the land is large, and many such homes in the area are bought for rebuilding or remodeling. The Census cannot say how many, and this brief does not claim to know, but the age is plain.
An inspection of a house from the 1960s has a known list. Roof, sewer line, oil tank history, wiring, windows, crawlspace moisture and insulation are common subjects. A public sale lets the buyer make an inspection contingent and ask for repairs, a credit or a lower price. A seller whose house is 60 years old should expect that list to be long, and may prefer a sale with no inspections and repairs.
In the postal area, 6,792 of 9,431 occupied homes are owner occupied, 72.0%, and 2,639 are rented, 28.0%. The 686 vacant homes are 6.8%, a low share. The median household income is $184,583 and the owner-estimated median home value is $1,206,200, with a margin of error of $44,207. The sold median of $1,498,000 is 8.1 times the income and is $291,800, or 24.2%, above the Census value.
The tenure figures help to read the stock. About 28% of occupied homes are rented, so a share of the homes that come up for sale have been rentals, and a landlord who sells is often motivated by a date or a tax year, not a feeling about the market. Such a seller may value a fixed closing date more than a top price.
The rent gap is notable. The Census median gross rent is $2,565, and the Realtor.com median asking rent is $4,050, 57.9% higher. The asking rent is up 3.85% on the year, which implies about $3,900 a year earlier. The rentals on offer are fewer, 15, and down 38.10%, so the asking figure rests on a small number of listings.
Source: U.S. Census Bureau, American Community Survey 2020-2024, and Realtor.com as cited. Ratios, shares and gaps are this brief's arithmetic. The remarks on rebuilding and on inspection lists are this brief's general reasoning and not statements of the Census.
What does the Seattle series add?
The neighborhood figures are for the summer and autumn. The Seattle-Tacoma-Bellevue series show the direction of the region through the year. The median days on market was 34 in April 2026, 36 in May, 37 in June, 44 in July and 45 in August, a rise of 11 days or 32.4%. Active listings rose from 6,427 in February to 11,644 in June (Realtor.com, active listings), a gain of 81.2%.
New listings were 5,088 in March, 6,100 in May and 5,326 in July (Realtor.com, new listings). Homes with a price cut rose from 1,786 in February to 4,714 in June (Realtor.com, price reduced listings), which is 40.5% of the 11,644 active homes in June.
The regional median listing price was $783,250 in June and $749,970 in September (Realtor.com, median listing price), a fall of 4.2%. The listing median of $1,600,000 in this part of Bellevue is 2.1 times the regional figure.
The regional price cut figure is a useful reminder for sellers. When 40.5% of the active homes in a region have already cut, a buyer who sees a high price will often wait for the cut. An owner who prices at the top of the range and waits for a bidding war is betting against that habit, and the bet costs weeks of carrying costs if it fails.
The region has loosened through the year, and this area has loosened with it, with its stock up more than half on the year. A seller here should price for a market where the buyer has more homes to compare than a year ago and where the average buyer expects a discount of a percent or two.
Source: Realtor.com series published by the Federal Reserve Bank of St. Louis as cited. The 11 day, 32.4%, 81.2%, 40.5%, 4.2% and 2.1 figures are this brief's arithmetic. The comparison with the area is this brief's reasoning.
What should an owner ask before accepting any offer?
Whether an offer is public or private, a seller can test it with a few plain questions. What is the price, and is any part of it conditional on an inspection, a loan or the sale of another home? What will I take home after every charge? When will the sale close, and can that date move? Who pays for any repair the buyer asks for? What proof is there that the money exists?
For a house built in the 1950s or 1960s there are more. What would an inspector find in the sewer line, the roof, the wiring and the crawlspace, and what would a buyer ask for? Is the buyer buying the house, or the lot with a plan to rebuild, and does that change the price that is fair? What does the closing date do to the cost of carrying a house that may need work?
The comparison should include the cost of waiting. At 34 days a home carries taxes, insurance and upkeep for more than a month before a buyer is found, and the sale then takes weeks to close. A fixed date and a known price remove the uncertainty, and some owners value that as much as the price. Readers comparing markets can also read the Kirkland brief and the Bellevue brief.
Source: this brief's general reasoning. The 34 day figure is from Realtor.com as cited. Commercial content; not independently verified.
What does a private sale change?
Maison Off-Market buys homes directly from their owners. It does not list a home, hold showings or put a home on a public listing. For a Bellevue owner, the five benefits are plain. There are no showings and no neighbors talking about the sale. The closing date can be flexible, which gives time to find a new home. There are no commission costs and no closing costs for the seller, and there are no inspections and repairs.
A little arithmetic shows what that is worth. Each 1% of a $1,498,000 sale is $14,980. A seller who gives up 3% gives up $44,940, and one who gives up 5% gives up $74,900. This brief does not claim that those are the costs of any sale, since the real figures depend on the agreement the seller signs. It shows how quickly a percentage becomes a sum.
The trade is that a private buyer may offer a price that differs from what a public sale could bring. In a market where homes draw two offers and sell in two weeks, a public sale may well fetch more. The useful comparison is the price after every cost and every week of waiting, and after the repairs a buyer's inspector would ask for, set against a closing date the seller picks.
Maison Off-Market speaks only to sellers. An owner who wants to know what a direct offer would look like can use the contact form below, or call 401-219-4207, and ask for a figure with no showings, no listing and no obligation.
Source: Maison Off-Market. The fee figures are this brief's arithmetic and not claims about any sale.
Methodology and limitations
Prices, price per square foot, days on market, listing and rental counts come from four commercial pages: a national listing site page dated September 2026, a national brokerage page with figures to August 2026, a property data site page with figures to July 2026 and a local report dated September 2026. They count different things and are not independently verified.
Age, tenure, vacancy, income, rent and owner-estimated value come from the American Community Survey 2020-2024 five-year estimates for the postal-code area that includes this part of Bellevue. Shares are calculated from published counts, and owner-estimated value carries a margin of error.
Days on market, active and new listings, median listing price and price reduced counts are Realtor.com series published by the Federal Reserve Bank of St. Louis for the Seattle-Tacoma-Bellevue metropolitan area. They describe the region and not the area. The brief makes no forecast and values no home.
Conclusion
The record for this part of Bellevue shows 113 homes for sale on one page and 836 on another, a wait of 34 days or 14, a sold median near $1.5 million that is flat to slightly down, a stock stated by the Census to be 72.7% older than 1980 and a region that is loosening.
It does not fix a price for any one home. The choice between a public listing and a private sale comes down to whether an owner would rather compete in that market or take privacy, a flexible closing date, no commission, no closing costs and no inspections or repairs. To see what a direct offer would look like for your home, use the contact form below or call 401-219-4207.
Frequently Asked Questions
What is the median home price in this part of Bellevue?
Realtor.com reports a median sold price of $1,498,000 for September 2026, down 3.35%. Redfin reports a median sale price of $1.5 million for the three months to August, down 3.8%.
How long do homes take to sell here?
Redfin reports around 14 days for the three months to August 2026, and Realtor.com reports a median of 34 days for September.
Is it a buyer's or a seller's market?
Realtor.com calls September 2026 balanced, with a sale-to-list ratio of 99%. Redfin calls it very competitive.
Why do the counts of homes for sale differ so much?
Realtor.com counts 113 and RealtyTrac counts 836. The pages do not say why. RealtyTrac's range of prices starts at $5,000, which suggests it counts more than houses.
Does a private sale always beat a public listing?
No. A public listing can attract competing bids. A private sale offers privacy, a flexible closing date, no commission, no closing costs and no inspections or repairs.
Compare your options before committing. Request a written private offer for your property, with no obligation, then weigh it against your listing plan.
Sources
- Realtor.com, 2026. Bellevue Postal Area Housing Market Data. https://www.realtor.com/local/market/washington/zipcode-98008.
- Redfin, 2026. Bellevue Postal Area Housing Market. https://www.redfin.com/zipcode/98008/housing-market.
- SELL123, 2026. Bellevue Real Estate Market Update. https://www.sell123.com/real-estate-market-update-98008.
- RealtyTrac, 2026. Bellevue Postal Area Real Estate Market Trends and Home Values. https://www.realtytrac.com/market-trends/bellevue-wa-98008/.
- U.S. Census Bureau, 2026. American Community Survey 2020-2024 five-year estimates, the Bellevue area (via Census Reporter). https://censusreporter.org/profiles/86000US98008-98008/.
- Realtor.com, 2026. Housing Inventory: Median Days on Market in Seattle-Tacoma-Bellevue, WA (CBSA). https://fred.stlouisfed.org/series/MEDDAYONMAR42660.
- Realtor.com, 2026. Housing Inventory: Active Listing Count in Seattle-Tacoma-Bellevue, WA (CBSA). https://fred.stlouisfed.org/series/ACTLISCOU42660.
- Realtor.com, 2026. Housing Inventory: New Listing Count in Seattle-Tacoma-Bellevue, WA (CBSA). https://fred.stlouisfed.org/series/NEWLISCOU42660.
- Realtor.com, 2026. Housing Inventory: Price Reduced Count in Seattle-Tacoma-Bellevue, WA (CBSA). https://fred.stlouisfed.org/series/PRIREDCOU42660.
- Realtor.com, 2026. Housing Inventory: Median Listing Price in Seattle-Tacoma-Bellevue, WA (CBSA). https://fred.stlouisfed.org/series/MEDLISPRI42660.
Related research

Seller Guide · October 6, 2026
How to Prepare Point Pleasant Beach Rental Records Before Selling
Separate rental approval, income history and booked stays before comparing sale terms.

Seller Guide · October 6, 2026
How to Prepare Rumson Flood and Waterfront Records Before Selling
Separate flood disclosure, elevation, repairs and waterfront rights before comparing sale terms.

Seller Guide · October 6, 2026
How to Prepare Sarasota Condo Inspection and Reserve Records Before Selling
Separate building condition, reserve funding and resale documents before comparing sale terms.