Market Brief · by Aidan Sowa · October 5, 2026
Is an Old Town Scottsdale Home a City Median Home? Reading a Median Listing, a City Median and the Rental Count
Reading a Median Listing, a City Median and the Rental Count for Old Town Scottsdale, AZ, with each source dated and its limits noted, for owners weighing a listing against a direct sale.
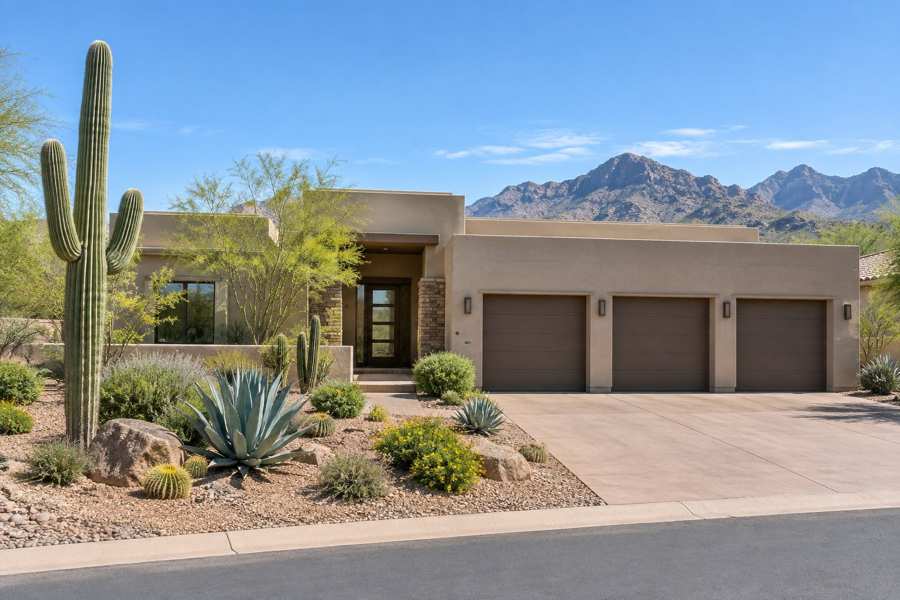
What does a home in Old Town Scottsdale cost? Realtor.com publishes a neighborhood table for the city, and it puts the median Old Town listing at $525,000. Its citywide median listing is $899,000. The neighborhood median is $374,000 lower, or 58% of the city figure, so any figure for Scottsdale as a whole is a poor guide to Old Town.
The citywide pages disagree with each other as well. Redfin says the Scottsdale median sale price is $944,527, up 7.9% on the year, with homes taking 75 days to sell against 68 a year ago. Realtor.com says the median listing price is down 10.09% on the year and the median wait is down 6.98%. One page has the wait rising and the other has it falling.
This brief reads the two commercial pages together with the Census profile of the postal area that includes Old Town Scottsdale and the Realtor.com series for the Phoenix area. It asks what the neighborhood table can and cannot tell an owner, why the Census shows a vacancy rate of 16.8%, and why Old Town has almost twice as many rentals as homes for sale. It then sets out what a private sale changes.
Key Findings
- Redfin reported a Scottsdale median sale price of $944,527 for the three months to July 2026 (up 7.9%), $419 per square foot (up 4.2%), 75 days on market against 68 a year earlier, 1,544 homes sold in July against 1,331 (up 16.0%) and 1 offer per home on average, and called the market somewhat competitive (Redfin, Scottsdale).
- Redfin put the sale-to-list ratio at 96.3% (up 0.2 points), the share of homes sold above list price at 5.6% and the share with price drops at 35.8% (down 4.4 points) (same Redfin page).
- Realtor.com reported a Scottsdale median listing price of $899,000 (down 10.09% on the year), a median sold price of $885,000 (up 7.06%), $444 per square foot (down 2.92%), 2,779 active listings (down 1.89%), a median of 78 days on market (down 6.98%), 3,396 rentals (down 3.79%) and a median rent of $2,409 (up 1.52%), and for Old Town a median listing price of $525,000, $363 per square foot, 607 homes for sale, 1,181 rentals, 80 days on market and a median rent of $2,194 (Realtor.com, Scottsdale).
- In the Census postal area, 13,823 of 26,458 housing units (52.2%) were built before 1980, 4,440 units (16.8%) are vacant, owners occupy 10,684 of 22,018 occupied homes (48.5%) and the owner-estimated median home value is $554,400 (U.S. Census Bureau, 2020-2024).
- In the Phoenix-Mesa-Scottsdale area the median days on market was 60 in May 2026 and 62 in September (Realtor.com, days on market).
What does the Old Town table say, and what does it not say?
The Realtor.com table lists eight Scottsdale areas. Old Town has a median listing price of $525,000 and $363 per square foot. North Scottsdale is at $1,300,000, Central Scottsdale at $1,225,000, South Scottsdale at $750,000, Indian Bend at $634,900 and Monterey Arcadia at $399,495. Desert Mountain, at $3,295,000, is above them all. Old Town sits in the lower half of the table, and its price per foot is the second lowest of the eight, above only Monterey Arcadia.
The table is useful because it shows how wide the spread is inside one city. The same page that says $899,000 for Scottsdale says $399,495 in one corner and $3,295,000 in another. A seller in Old Town who reads that the median Scottsdale home costs $899,000 is reading a figure that mixes in estates in the hills.
The table also has limits. It gives listing prices and not sale prices, so it shows what owners are asking and not what buyers have paid. It does not say what types of home are listed, whether condominiums, townhouses or houses. It gives one figure for each area and not a range. And it is a figure for the whole Old Town area as Realtor.com draws it, which may be wider or narrower than the area an owner has in mind.
For a seller, the lesson is to start from the neighborhood and then from the street. The citywide median is a distraction. The Old Town median is a start. A comparison of homes of the same type, size and age within a few blocks is the figure that matters, and none of these pages provides it.
| Area | Median listing price | Per square foot | Median rent |
|---|---|---|---|
| North Scottsdale | $1,300,000 | $485 | $2,509 |
| Central Scottsdale | $1,225,000 | $452 | $2,130 |
| South Scottsdale | $750,000 | $442 | $3,395 |
| Indian Bend | $634,900 | $379 | $2,200 |
| Old Town | $525,000 | $363 | $2,194 |
| Via Linda Corridor | $505,000 | $377 | $2,054 |
| Monterey Arcadia | $399,495 | $345 | $2,249 |
Sources: Realtor.com page as cited. The 58% and $374,000 figures are this brief's arithmetic. Commercial content; not independently verified.
Why do the city pages disagree on direction?
Redfin says the typical sale price rose 7.9% and the price per foot rose 4.2%. Realtor.com says the median listing price fell 10.09% and the price per foot fell 2.92%. Redfin says the wait lengthened from 68 days to 75. Realtor.com says the wait fell 6.98% to 78. Almost every direction is opposite.
The explanation lies in what is measured. Redfin's figures are for homes that sold, over three months. Realtor.com's listing figures are for homes that are for sale now. If the dearer homes sold in the spring and the homes that remain are cheaper, the sold median rises while the listing median falls, and both are true at once. Realtor.com's own sold median agrees with Redfin on direction, with a rise of 7.06% on the year.
The sold medians are not far apart in direction but are apart in level. Redfin has $944,527 and Realtor.com has $885,000, a gap of $59,527, or 6.3% of the Redfin figure. Neither page lists the homes behind the figure, so the gap cannot be traced.
The practical reading is that sellers' prices rose and asking prices fell. Buyers have paid more than a year ago for the homes that sold, and the homes now on the market are being asked for less. A seller who prices at last spring's sales may be above what the listings around them are asking.
Sources: Redfin and Realtor.com pages as cited. The $59,527 and 6.3% figures are this brief's arithmetic. The explanation is this brief's reasoning and not a statement of either page. Commercial content; not independently verified.
What do 607 homes for sale and 1,181 rentals say about Old Town?
Old Town has 607 homes for sale, up 2.95% on the year, and 1,181 rentals, down 6.60% on the month. It accounts for 21.8% of the 2,779 active listings in the city and 34.8% of the 3,396 rentals. There are almost twice as many rentals as homes for sale, a ratio of about 1.9.
That is a sign of a neighborhood in which many homes are rented. The Census agrees. In the postal area that includes Old Town, renters occupy 11,334 of 22,018 occupied homes, which is 51.5%, and owners 10,684, which is 48.5%. Median gross rent is $1,867 a month. The Realtor.com median for Old Town listings is $2,194, which is $327 higher, and the two measure different things, since the Census covers all renters and the page covers current listings.
For a seller, the rental count matters in two ways. A large rental market is a sign that many buyers are investors, who judge a home by its rent and not by its comfort, and an investor's price depends on the rent. Second, a rental is an alternative for an owner who does not want to sell at today's price. A rent near $2,194 against a price near $525,000 is a gross yield of about 5.0% a year before costs. That is arithmetic only, and it leaves out taxes, insurance, vacancy and repairs.
The median wait for Old Town listings is 80 days, two days longer than the city. A listing in Old Town that is not priced to the neighborhood can expect to sit for close to three months before any cut.
Sources: Realtor.com and U.S. Census Bureau as cited. The 21.8%, 34.8%, 1.9, $327 and 5.0% figures are this brief's arithmetic and illustrations. Commercial content; not independently verified.
How far do asking prices sit from sale prices?
Two pages give a view of the gap between what owners ask and what buyers pay. Redfin's sale-to-list ratio for Scottsdale is 96.3%, which means that the average home sold for about 3.7% under its list price. Realtor.com says homes sold for 3.0% below the asking price on average in September, with a ratio of 97%. The two figures are within 0.7 points of each other and come from different periods.
On a home asked at $525,000, a discount of 3.7% is $19,425, and a discount of 3.0% is $15,750. On $944,527, the city median sale price, the same discounts are $34,947 and $28,336. These are illustrations of the arithmetic and not predictions. They show that the typical discount is a sum of real money at either level.
The share of homes that sold above their ask is 5.6% on Redfin, about one in eighteen. The share with a price cut is 35.8%, a little over one in three. So a seller is about six times as likely to cut as to sell above the ask. Those are the odds on the page, and they apply to the city and not to a given street.
The lesson is that the first price matters. A home that starts too high either sells for less than the ask, after weeks of waiting, or takes a cut that every buyer can see. A home priced to the neighborhood from the start meets buyers when interest is highest, which is the first few weeks. A private offer removes the question of the first price, because the figure is agreed in private and there is no listing history.
Sources: Redfin and Realtor.com pages as cited. The $19,425, $15,750, $34,947, $28,336, one in eighteen and six times figures are this brief's arithmetic and illustrations; the last two compare 35.8% with 5.6%. Commercial content; not independently verified.
Why does the Census show 16.8 percent of homes vacant?
The Census profile covers the postal area that includes Old Town Scottsdale. It counts 40,780 people and 26,458 housing units, of which 22,018 are occupied and 4,440 are vacant. That is a vacancy rate of 16.8%, much higher than the 5.7% in the Redmond area or 8.0% in the Bellevue area in this series. Median household income is $92,851.
The table I used does not say why homes are vacant. Vacancy in the Census includes homes for rent, homes for sale, homes sold and not yet occupied, homes held for occasional or seasonal use and others. In a place where many owners live elsewhere for part of the year, seasonal use is one likely part of the answer, but the table here does not break it out, so I do not claim it.
Owners estimate the median home at $554,400, with a margin of error of $39,653, or 7.2%. That is $29,400 above the Realtor.com Old Town median listing price of $525,000, a gap of 5.6%, and well within the margin of error. The two are close, which is a useful agreement between a pooled survey and a current asking price.
The homes are of the 1960s and 1970s. The median year built is 1979. The largest group, 5,305 homes (20.1%), dates from the 1970s, followed by 4,533 (17.1%) from the 1960s and 3,887 (14.7%) from the 2010s. In all, 13,823 homes, 52.2%, were built before 1980. A group of 3,465 homes, 13.1%, dates from the 1950s.
| Indicator | Value | Note |
|---|---|---|
| Population | 40,780 | Whole postal area |
| Housing units | 26,458 | All units |
| Vacant units | 4,440 | 16.8% of units |
| Built before 1980 | 13,823 | 52.2% of units |
| Owner occupied | 10,684 | 48.5% of occupied homes |
| Renter occupied | 11,334 | 51.5% of occupied homes |
| Median household income | $92,851 | Whole postal area |
| Median home value | $554,400 | Owner estimate, margin of error $39,653 |
Source: U.S. Census Bureau as cited. The $29,400, 5.6% and 7.2% figures are this brief's arithmetic. The Census table used does not give the reasons for vacancy. Census figures cover the postal area, not the city.
What does a house from the 1960s or 1970s face in an inspection in the desert?
A home of the 1960s or 1970s in the Phoenix area is now 50 to 65 years old. In the postal area, 9,838 homes, 37.2%, come from those two decades. The roof, the cooling system, the windows, the plumbing and the wiring have usually been replaced or have reached the end of their life, and a buyer's inspector will note each of them.
Heat is the feature of the climate that works on these parts. Cooling systems run for much of the year, roofs take direct sun, and sealants and pipes age. The sources here do not measure how often these items appear in Old Town homes, and I do not estimate costs.
What matters to a seller is the sequence. The offer is made, the inspection follows, and the findings become a request for a credit, a repair or a lower price. With 35.8% of Scottsdale homes already carrying a price cut, a request after the inspection is a second cut to a price that has already fallen. A buyer who takes the home as it is does not make one.
Sources: U.S. Census Bureau and Redfin as cited. The 9,838 and 37.2% figures are this brief's arithmetic. The points about the climate and inspections are this brief's general reasoning and not findings about Old Town homes.
What should an Old Town owner ask before accepting any offer?
Whether the offer is public or private, an owner can compare it with a short list of questions. What is the price, and is any part of it contingent on an inspection, a loan or the sale of another home? What will I receive at closing after every charge? On what date will the sale close, and can the date move? Who pays for any repair a buyer asks for? What is the buyer's evidence that the money is there?
These questions matter more in a market in which the pages disagree about direction. When one commercial page says prices rose 7.9% and another says asking prices fell 10.09%, a figure on a page cannot settle the value of a home. A written offer, with its terms, can be compared with the net from a listing, using the same arithmetic on both.
The comparison should include the cost of waiting. A home that sits for 80 days carries taxes, insurance, upkeep and the cost of the next home that is not yet bought. A listing can end in a better price, and it can end in a cut. A fixed date and a known price remove the uncertainty, and some owners value that as much as the price.
An owner can also ask what happens if the buyer withdraws. In a public sale the home returns to the market with a record that it was under contract, and later buyers may wonder why the first deal failed. In a private sale the question does not arise in public.
Source: this brief's general reasoning. The 7.9%, 10.09% and 80 days figures are from the pages cited above. Commercial content; not independently verified.
What does the Phoenix series add?
The Realtor.com series for the Phoenix-Mesa-Scottsdale area shows the region and not the city. Its median days on market was 60 in May, 64 in June, 67 in July and August and 62 in September. The wait grew by seven days from May to July and then eased by five.
Active listings in the area (Realtor.com, active listings) were 19,517 in May, 18,731 in June, 17,661 in July, 17,707 in August and 18,437 in September, so the count fell by 9.5% and then rose. New listings (Realtor.com, new listings) fell from 8,670 in March to 5,854 in July, a drop of 32%, which is the usual slowing after spring.
Listings with a price reduction (Realtor.com, price reduced listings) fell from 10,902 in March to 8,348 in July, a drop of 23%. The area median listing price (Realtor.com, median listing price) went from $498,000 in May to $475,000 in September, a fall of 4.6%. The Scottsdale median listing price of $899,000 is 1.9 times the area figure, and the Old Town figure of $525,000 is 1.1 times it, which puts Old Town close to the middle of the wider region.
The regional pattern is steady, with waits in the sixties, falling asking prices and a count of listings that is stable. None of it fixes the price of one home, and the series makes no forecast. Readers comparing markets can also read the Lake Havasu City brief and the North Scottsdale brief.
Sources: Realtor.com series on FRED as cited, for the Phoenix-Mesa-Scottsdale metropolitan area. The 9.5%, 32%, 23%, 4.6%, 1.9 and 1.1 figures are this brief's arithmetic. Series are not seasonally adjusted. Commercial content; not independently verified.
What does a private sale change in Old Town?
On a home that sells near $525,000, each 1% of the price is $5,250. On a home at the city's sale median of $944,527 it is $9,445. That is arithmetic and not a claim about any commission or cost. It shows how a percentage turns into dollars, and why the amount an owner keeps, and not the headline price, is the figure to compare.
A private sale offers five things that a public listing cannot. There is privacy, because there are no showings and no neighbors talking about you selling. The closing date can be flexible, which gives you time to find a new home. There are no commission costs. There are no closing costs. And there are no inspections or repairs for the buyer to ask for.
Privacy matters in a neighborhood with this many listings. Old Town has 607 homes for sale and 1,181 for rent. A listing in that crowd is one of many, and a home that sits for 80 days or more becomes a listing history that every later buyer can read. A private sale leaves none.
A flexible date matters to owners who spend part of the year elsewhere, which the high Census vacancy may suggest, though the table does not say so. An owner who needs a closing in the spring, or in the autumn, can name it and a buyer who wants the home can agree.
None of this means that a private offer will always beat the market. A well-priced home in a good week can still draw several bids. The question for an owner is whether the chance of that outcome is worth the wait, the showings, the inspection and the public listing.
Source: this brief's arithmetic and reasoning. The benefits are those offered by Maison Off-Market. Commercial content; not independently verified.
Methodology and limitations
Prices, price per square foot, days on market, offers, sale-to-list ratio, price drops, listing counts, rentals and the neighborhood table for Scottsdale and Old Town come from two commercial pages: a national brokerage page for the whole city and a national listing site page that includes the neighborhood table. They measure different things and were not independently verified. The Realtor.com page labels its change columns as month over month and one year; the brief uses the one year column for year on year changes.
Age, tenure, vacancy, income, rent and owner-estimated value come from the American Community Survey 2020-2024 five-year estimates for the postal-code area that includes Old Town Scottsdale. Shares are calculated from published counts, and owner-estimated value carries a margin of error.
Days on market, active and new listings, median listing price and price reduced counts are Realtor.com series published by the Federal Reserve Bank of St. Louis for the Phoenix-Mesa-Scottsdale metropolitan area. They describe the region and not the city. The brief makes no forecast and values no home.
Conclusion
The Old Town record shows a median listing of $525,000 beside a city median of $899,000, city pages that disagree on whether prices and waits rose or fell, almost twice as many rentals as homes for sale and a Census vacancy rate of 16.8%.
It does not fix a price for any one home. The choice between a public listing and a private sale comes down to whether an owner would rather compete in that market or take privacy, a flexible closing date, no commission, no closing costs and no inspections or repairs. To see what a direct offer would look like for your home, use the contact form below or call 401-219-4207.
Frequently Asked Questions
What is the median home price in Old Town Scottsdale?
Realtor.com shows a median listing price of $525,000 for Old Town against $899,000 for the whole city; Redfin reports a Scottsdale sale median of $944,527.
How long do Old Town homes take to sell?
Realtor.com shows a median of 80 days on market for Old Town and 78 for the city; Redfin says 75 days for the city, up from 68.
Is Old Town a seller's market?
Redfin calls Scottsdale somewhat competitive and Realtor.com calls it warm and balanced; 35.8% of homes had a price cut.
Why is Old Town vacancy so high in the Census?
The postal area shows 16.8% vacant units, and the table used does not give the reasons.
Does a private sale always beat a public listing?
No. A public listing can attract competing bids. A private sale offers privacy, a flexible closing date, no commission, no closing costs and no inspections or repairs.
Compare your options before committing. Request a written private offer for your property, with no obligation, then weigh it against your listing plan.
Sources
- Redfin, 2026. Scottsdale Housing Market Trends. https://www.redfin.com/city/16660/AZ/Scottsdale/housing-market.
- Realtor.com, 2026. Scottsdale, AZ Housing Market and Rental Trends. https://www.realtor.com/local/market/arizona/maricopa-county/scottsdale.
- U.S. Census Bureau, 2026. American Community Survey 2020-2024 five-year estimates, the Old Town Scottsdale area (via Census Reporter). https://censusreporter.org/profiles/86000US85251-85251/.
- Realtor.com, 2026. Housing Inventory: Median Days on Market in Phoenix-Mesa-Scottsdale, AZ (CBSA). https://fred.stlouisfed.org/series/MEDDAYONMAR38060.
- Realtor.com, 2026. Housing Inventory: Active Listing Count in Phoenix-Mesa-Scottsdale, AZ (CBSA). https://fred.stlouisfed.org/series/ACTLISCOU38060.
- Realtor.com, 2026. Housing Inventory: New Listing Count in Phoenix-Mesa-Scottsdale, AZ (CBSA). https://fred.stlouisfed.org/series/NEWLISCOU38060.
- Realtor.com, 2026. Housing Inventory: Price Reduced Count in Phoenix-Mesa-Scottsdale, AZ (CBSA). https://fred.stlouisfed.org/series/PRIREDCOU38060.
- Realtor.com, 2026. Housing Inventory: Median Listing Price in Phoenix-Mesa-Scottsdale, AZ (CBSA). https://fred.stlouisfed.org/series/MEDLISPRI38060.
Related research

Seller Guide · October 6, 2026
How to Prepare Point Pleasant Beach Rental Records Before Selling
Separate rental approval, income history and booked stays before comparing sale terms.

Seller Guide · October 6, 2026
How to Prepare Rumson Flood and Waterfront Records Before Selling
Separate flood disclosure, elevation, repairs and waterfront rights before comparing sale terms.

Seller Guide · October 6, 2026
How to Prepare Sarasota Condo Inspection and Reserve Records Before Selling
Separate building condition, reserve funding and resale documents before comparing sale terms.