Market Brief · by Aidan Sowa · October 5, 2026
Is a Virginia-Highland Home Selling at Its Asking Price? Reading a Falling Sold Median and a Rising Listing Median
Reading a Falling Sold Median and a Rising Listing Median for Virginia-Highland, GA, with each source dated and its limits noted, for owners weighing a listing against a direct sale.
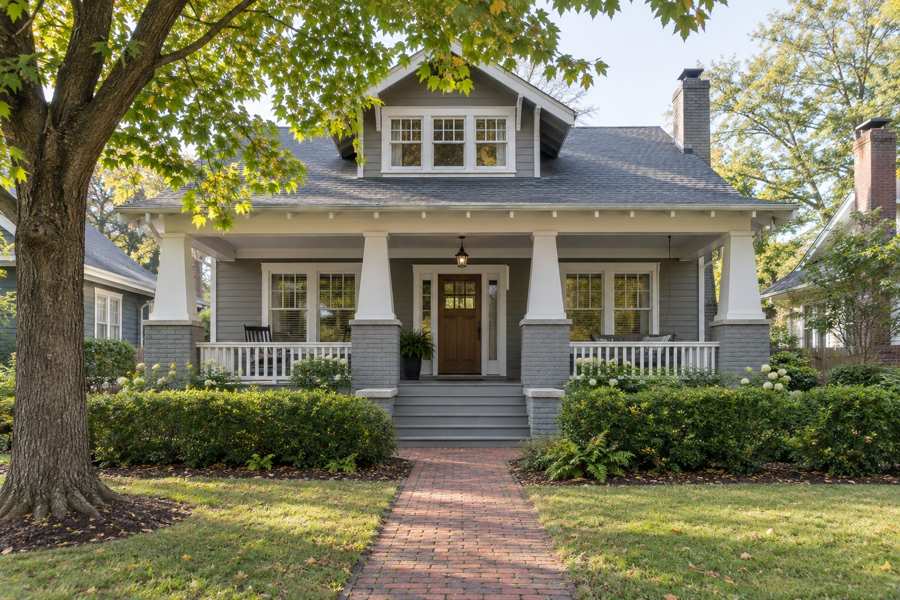
What is the typical Virginia-Highland home worth? Realtor.com says the median sold price is $502,500, down 47.11% on the year. In the same table the median listing price is $578,250, up 14.32%, and homes are said to sell for about 99% of their asking price. A sold median that is nearly half of what it was and a sale-to-list ratio that is nearly perfect cannot both describe the same homes.
Redfin adds a different picture. Its page for the neighborhood showed a median sale price of $559,000 for February 2026, up 19.9% on the year, and called the market very competitive, with many homes receiving several offers. One page shows prices falling by almost half. The other shows them rising by a fifth. Both are based on small counts: Redfin's figure rests on 20 sales in a month.
This brief reads the two pages with the Census profile of the postal area and the Realtor.com series for the Atlanta region. It asks which numbers an owner can rely on, what a median of a few dozen homes can say and what a private sale changes for a seller in a neighborhood where buyers have a lot of choice and a lot of noise to read.
Key Findings
- Realtor.com reported, as of June 2026, a median listing price of $578,250 for Virginia-Highland (up 14.32% on the year, up 30.18% on the month and down 33.35% on three years), a median sold price of $502,500 (down 47.11% and down 49.50%), $429 per square foot (down 5.61% and down 2.59%), 44 active listings (up 37.21% and up 34.09%) and a median of 49 days on market (up 19.74% and up 12.50%). The table headers on that page read 1Y Change and 3Y Change (Realtor.com, Virginia-Highland).
- The same page gave a sale-to-list ratio of 99%, called June 2026 a balanced market and a warm one, and counted 36 rentals (up 23.68%) at a median rent of $1,625 a month (down 29.35%).
- Redfin reported for February 2026 a median sale price of $559,000 (up 19.9% on the year), $415 per square foot (down 6.8%), 44 days on market against 39 a year earlier and 20 homes sold against 24. It called the market very competitive, with many homes receiving multiple offers, some with waived contingencies (Redfin, Virginia-Highland).
- In the Census postal area that includes Virginia-Highland, 11,606 of 12,269 housing units are occupied, 663 (5.4%) are vacant, owners hold 6,738 of the occupied homes (58.1%), renters hold 4,868 (41.9%), 7,890 units (64.3%) were built before 1980 and the owner-estimated median home value is $799,800 (U.S. Census Bureau, 2020-2024).
- In the Atlanta-Sandy Springs-Roswell area the median days on market rose from 50 in May 2026 to 60 in September (Realtor.com, days on market).
Can a sold median fall 47 percent while homes sell at 99 percent of list?
Only if the homes that sold were much cheaper than the homes that are listed. The sale-to-list ratio says that a typical home sold for about 99% of its asking price. If the typical sale was $502,500, the typical asking price of the homes that sold was about $507,600, which is arithmetic and not a figure from the page. The median asking price of the homes now on the market is $578,250. The homes that sold were, on average, priced about $70,000 below the homes that are available.
A year earlier the pattern was the opposite. A fall of 47.11% means that the sold median in June 2025 was about $950,000, and a listing median up 14.32% implies about $505,800 for the list. The typical sold home was then far dearer than the typical listing. Within a year the two have swapped places. The likeliest cause is the mix: a small number of large and costly sales in the earlier month, and a month of smaller homes and condominiums in the later one.
A median of a few dozen sales is easily bent. Realtor.com does not say how many homes sold in the month. Redfin counted 20 sales in February and 24 a year before. At that level, three or four homes in a different price bracket will move the median by tens of thousands of dollars. So the fall of 47% is a fact about the sample and not a measure of the value of a Virginia-Highland house.
An owner can still learn something from the pair of figures. The sale-to-list ratio of 99% says that sellers who priced their homes in line with the market got close to what they asked. The long wait says that it took them seven weeks to do so. A seller who prices well and is willing to wait is served by the page, and a seller who needs a fixed date is not.
The three year change is similar. A fall of 49.50% implies a sold median of about $995,000 three years ago. That is not a plausible fall in the value of homes, because the price per square foot fell only 2.59% over three years. A price per foot that is almost flat beside a price that has halved means that the homes selling are much smaller than before.
| Indicator | Level | 1Y change | 3Y change |
|---|---|---|---|
| Median listing price | $578,250 | 14.32% | -33.35% |
| Median sold price | $502,500 | -47.11% | -49.50% |
| Price per square foot | $429 | -5.61% | -2.59% |
| Active listings | 44 | 37.21% | 34.09% |
| Median days on market | 49 | 19.74% | 12.50% |
| Rentals | 36 | 23.68% | 56.67% |
| Median rent | $1,625 a month | -29.35% | -27.78% |
Source: Realtor.com page as cited. The $507,600, $70,000, $950,000, $505,800 and $995,000 figures are this brief's arithmetic from the stated ratio and changes. The explanation of the mix is this brief's reasoning and not a statement of the page. Commercial content; not independently verified.
Why does a listing median move 30 percent in a month?
The Realtor.com page shows the median listing price up 14.32% on the year and up 30.18% on the month. A rise of 30.18% in one month would mean the median was about $444,200 in May and $578,250 in June, a jump of about $134,000. No house gained that much value in a month. What changed was the set of homes on the market.
With only 44 homes for sale, a handful of costly listings entering and a handful of cheaper ones leaving will do it. The page shows the stock up 9.26% on the month, which is about four more homes. Four large houses added to a list of 40 will lift the middle of the list by a long way.
The price per square foot is steadier and tells the opposite story. It is $429, down 5.61% on the year. If the homes on the list were truly worth 14% more, the price per foot would be rising. It is falling. So the new listings are larger, not dearer per foot, and a seller should not read the jump as a sign that prices are climbing.
For an owner, the point is that monthly medians in a small neighborhood are weather and not climate. The figures worth watching are the ones that change slowly: the price per foot, the wait and the count of homes for sale.
Source: Realtor.com page as cited. The $444,200 and $134,000 figures are this brief's arithmetic from the stated change. The explanation is this brief's reasoning. Commercial content; not independently verified.
What does the Redfin page add, and what does it leave out?
Redfin's page for the neighborhood is for February 2026, four months before the Realtor.com page. It puts the median sale price at $559,000, up 19.9% on the year, which implies about $466,200 a year earlier. Realtor.com's implied figure for the same year earlier is about $950,000. The two pages disagree about the past by a factor of two, and that is a reminder that the neighborhood boundaries and the homes counted are not the same on both.
Redfin's price per square foot is $415, down 6.8%. Realtor.com's listing price per foot is $429, down 5.61%. Those are close to each other, and they move in the same direction. A price per foot that falls by about 6% on both pages is the most consistent signal in this brief. The medians contradict each other, while the price per foot agrees.
The wait is 44 days on Redfin against 39 a year before, and 49 days on Realtor.com against about 41 a year before, which is arithmetic from the 19.74% change. Both are longer, by roughly the same amount. Redfin also says that homes go pending in about 21 days and sell for about 1% below list, with many receiving several offers. The two waits are different measures, and 21 days is for homes that attract an offer quickly.
The gap between February and June is $56,500, or 10.1% of the Redfin figure, and it is in the wrong direction for a market that was rising. It shows again that medians of 20 sales are unstable. An owner can use the Redfin page as evidence that the neighborhood was competitive in the winter, and the Realtor.com page as evidence that it had loosened by June.
Source: Redfin and Realtor.com pages as cited. The $466,200, $950,000, $56,500, 10.1% and 41 day figures are this brief's arithmetic. Commercial content; not independently verified.
What do the neighbors show about Virginia-Highland?
The Realtor.com page shows eleven nearby areas with a median listing price. Virginia-Highland, at $578,250 and $429 per square foot, sits in the middle. Morningside and Lenox Park is far above at $1,325,000, and Ansley Park is $1,050,000. Candler Park is $849,000 and Piedmont Heights $768,000. Inman Park is $575,000, close to Virginia-Highland, while Poncey-Highland, Northeast Atlanta, Midtown, Old Fourth Ward and SoNo are all below $400,000.
The price per foot places the neighborhood nearer the top. Only Inman Park ($442) and 12th and Midtown ($500) are higher. Virginia-Highland's $429 is 13.5% above the Poncey-Highland figure of $378 and 18.5% above the Old Fourth Ward figure of $362, though a few of those lines are for condominiums and small areas. A foot of floor space costs more here than in most of the places around it.
The count of homes for sale puts the market in scale. Virginia-Highland has 44, which is 4.9% of the 890 homes for sale in Northeast Atlanta, the wider area. Morningside and Lenox Park has 53, and Inman Park 31. A buyer who looks for a bungalow near the park can see about 130 homes across the three. That is a small pool, and it is why one new listing can move a median.
The wait varies as well. Realtor.com shows 49 days in Virginia-Highland, 46 in Piedmont Heights, 49 in Ansley Park, 30 in Woodland Hills and 80 in Lindbergh and Morosgo. The neighborhood is in the middle of the pack, and an owner should not expect the quickest waits that the best streets in the city see.
| Area | Median listing price | Price per sq ft |
|---|---|---|
| Morningside and Lenox Park | $1,325,000 | $424 |
| Ansley Park | $1,050,000 | $393 |
| Candler Park | $849,000 | $328 |
| Piedmont Heights | $768,000 | $317 |
| Virginia-Highland | $578,250 | $429 |
| Inman Park | $575,000 | $442 |
Source: Realtor.com page as cited. The 13.5% and 18.5% comparisons and the 4.9% and 130 home figures are this brief's arithmetic. Commercial content; not independently verified.
What does the Census say about a neighborhood of old homes and renters?
In the postal area that includes Virginia-Highland, 4,921 of the 12,269 homes, 40.1%, were built before 1940. Another 760 date from the 1940s, 788 from the 1950s and 1,013 from the 1960s. In all, 7,890 homes, 64.3%, are from before 1980. The median year built is 1956. Only 2,598, 21.2%, were built in 2000 or later. This is one of the oldest housing stocks in this series of briefs.
Renters hold 4,868 of the 11,606 occupied homes, 41.9%, and owners 6,738, 58.1%. Only 663 homes, 5.4%, are vacant. The population is 24,236, or about 2.09 per occupied home, and the median household income is $123,077. A neighborhood with this many small households and renters is one in which many homes are apartments and condominiums as well as bungalows, and the sold median reflects both.
The owner-estimated median value in the Census is $799,800, with a margin of error of $62,574. That is $297,300 above the Realtor.com sold median of $502,500 and $221,550 above the median listing price of $578,250. The Census figure is an average over 2020 to 2024 across the whole postal area and rests on what owners believe. The gap shows that the sold median on the page is well below what the owners of the area think their homes are worth, and it is another sign that the sold median is not a measure of the typical house.
Rents give another gap. The Census median gross rent is $1,833 a month, and Realtor.com's median asking rent is $1,625, which is $208 or 11.3% lower. The asking rent is down 29.35% on the year, which implies about $2,300 a year earlier. A fall of that size in a year is another figure that should be read with care.
Source: U.S. Census Bureau, American Community Survey 2020-2024, and Realtor.com as cited. Shares and gaps are this brief's arithmetic.
What does the Atlanta series add?
The neighborhood figures end in June. The Atlanta-Sandy Springs-Roswell series cover the region and run to the autumn. They do not describe Virginia-Highland, but they show the direction of the market around it.
The median days on market in the region was 50 in May 2026, 52 in June, 56 in July, 59 in August and 60 in September, a rise of 10 days or 20.0%. Active listings rose from 27,670 in May to 29,735 in September (Realtor.com, active listings), a gain of 2,065 or 7.5%. New listings fell from 10,732 in April to 8,982 in July (Realtor.com, new listings), a fall of 16.3%.
Homes with a price cut rose from 9,140 in April to 11,608 in August (Realtor.com, price reduced listings), a gain of 27.0%. As a share of active listings it was 35.4% in May and 39.2% in August. The regional median listing price slipped from $425,000 in May to $415,000 in September (Realtor.com, median listing price), a fall of 2.4%.
The region had more homes, slower sales and more price cuts through the summer. A neighborhood with 44 homes for sale and a wait of 49 days sits inside that, and the 14% rise in its listing median runs against the regional drift, which is another reason to treat it as a product of the small sample.
Source: Realtor.com series published by the Federal Reserve Bank of St. Louis as cited. The 10 day, 20.0%, 2,065, 7.5%, 16.3%, 27.0%, 35.4%, 39.2% and 2.4% figures are this brief's arithmetic. The comparison with the neighborhood is this brief's reasoning.
What should an owner ask before accepting any offer?
Whether an offer is public or private, a seller can test it with a few plain questions. What is the price, and is any part of it conditional on an inspection, a loan or the sale of another home? What will I take home after every charge? When will the sale close, and can that date move? Who pays for any repair the buyer asks for? What proof is there that the money exists?
In a neighborhood of old homes, there are more. Is the offer unchanged if the inspection finds old wiring, a failing foundation or a clay sewer line, all common in houses from before 1940? Who bears the cost of a historic district review or of permits left open by past work? A sale that falls through at inspection costs the seller weeks and often the next buyer's confidence.
The comparison should include the cost of waiting. At a median of 49 days, a home carries taxes, insurance and upkeep for seven weeks before a buyer is found, and the sale then takes a month to close. A fixed date and a known price remove the uncertainty, and some owners value that as much as the price. Readers comparing markets can also read the Sandy Springs brief and the Morningside-Lenox Park brief.
Source: this brief's general reasoning. The 49 day figure is from Realtor.com as cited. Commercial content; not independently verified.
What does a private sale change?
Maison Off-Market buys homes directly from their owners. It does not list a home, hold showings or put a home on a public listing. For a Virginia-Highland owner, the five benefits are plain. There are no showings and no neighbors talking about the sale. The closing date can be flexible, which gives time to find a new home. There are no commission costs and no closing costs for the seller, and there are no inspections and repairs.
A little arithmetic shows what that is worth. Each 1% of a $502,500 sale is $5,025. A seller who gives up 3% gives up $15,075, and one who gives up 5% gives up $25,125. This brief does not claim that those are the costs of any sale, since the real figures depend on the agreement the seller signs. It shows how quickly a percentage becomes a sum.
The trade is that a private buyer may offer a price that differs from what a public sale could bring. The useful comparison is the price after every cost and every week of waiting, set against a closing date the seller picks. A public sale may fetch more or less. A private offer tells an owner the number before any of that begins.
Maison Off-Market speaks only to sellers. An owner who wants to know what a direct offer would look like can use the contact form below, or call 401-219-4207, and ask for a figure with no showings, no listing and no obligation.
Source: Maison Off-Market. The fee figures are this brief's arithmetic and not claims about any sale.
Methodology and limitations
Prices, price per square foot, days on market, listing and rental counts, and the nearby-area tables for Virginia-Highland come from two commercial pages: a national listing site page dated June 2026 and a national brokerage page whose latest figures are for February 2026. They cover different months and are not independently verified, and the counts of homes behind them are small.
Age, tenure, vacancy, income, rent and owner-estimated value come from the American Community Survey 2020-2024 five-year estimates for the postal-code area that includes Virginia-Highland. Shares are calculated from published counts, and owner-estimated value carries a margin of error.
Days on market, active and new listings, median listing price and price reduced counts are Realtor.com series published by the Federal Reserve Bank of St. Louis for the Atlanta-Sandy Springs-Roswell metropolitan area. They describe the region and not the neighborhood. The brief makes no forecast and values no home.
Conclusion
The Virginia-Highland record shows a sold median down 47% and a listing median up 14% on the same page, a Redfin median up 20%, a price per square foot that is down about 6% on both, a stock of homes from before 1980 and a region where waits are lengthening.
It does not fix a price for any one home. The choice between a public listing and a private sale comes down to whether an owner would rather compete in that market or take privacy, a flexible closing date, no commission, no closing costs and no inspections or repairs. To see what a direct offer would look like for your home, use the contact form below or call 401-219-4207.
Frequently Asked Questions
What is the median home price in Virginia-Highland?
Realtor.com reports a median sold price of $502,500 for June 2026, down 47.11%, and a median listing price of $578,250. Redfin reported $559,000 for February 2026, up 19.9%.
How long do Virginia-Highland homes take to sell?
Realtor.com reports a median of 49 days, up 19.74% on the year. Redfin reported 44 days for February 2026.
Is Virginia-Highland a buyer's or a seller's market?
Realtor.com calls June 2026 balanced, with a sale-to-list ratio of 99%. Redfin called February 2026 very competitive.
Why do the two pages disagree about prices?
The pages cover different months and use different boundaries and counts. Both rest on small numbers of sales, which makes a median unstable.
Does a private sale always beat a public listing?
No. A public listing can attract competing bids. A private sale offers privacy, a flexible closing date, no commission, no closing costs and no inspections or repairs.
Compare your options before committing. Request a written private offer for your property, with no obligation, then weigh it against your listing plan.
Sources
- Realtor.com, 2026. Virginia Highland Neighborhood of Atlanta, GA Housing Market. https://www.realtor.com/local/market/georgia/atlanta/virginia-highland.
- Redfin, 2026. Virginia-Highland Housing Market. https://www.redfin.com/neighborhood/148551/GA/Atlanta/Virginia-Highland/housing-market.
- U.S. Census Bureau, 2026. American Community Survey 2020-2024 five-year estimates, the Virginia-Highland area (via Census Reporter). https://censusreporter.org/profiles/86000US30306-30306/.
- Realtor.com, 2026. Housing Inventory: Median Days on Market in Atlanta-Sandy Springs-Roswell, GA (CBSA). https://fred.stlouisfed.org/series/MEDDAYONMAR12060.
- Realtor.com, 2026. Housing Inventory: Active Listing Count in Atlanta-Sandy Springs-Roswell, GA (CBSA). https://fred.stlouisfed.org/series/ACTLISCOU12060.
- Realtor.com, 2026. Housing Inventory: New Listing Count in Atlanta-Sandy Springs-Roswell, GA (CBSA). https://fred.stlouisfed.org/series/NEWLISCOU12060.
- Realtor.com, 2026. Housing Inventory: Price Reduced Count in Atlanta-Sandy Springs-Roswell, GA (CBSA). https://fred.stlouisfed.org/series/PRIREDCOU12060.
- Realtor.com, 2026. Housing Inventory: Median Listing Price in Atlanta-Sandy Springs-Roswell, GA (CBSA). https://fred.stlouisfed.org/series/MEDLISPRI12060.
Related research

Seller Guide · October 6, 2026
How to Prepare Point Pleasant Beach Rental Records Before Selling
Separate rental approval, income history and booked stays before comparing sale terms.

Seller Guide · October 6, 2026
How to Prepare Rumson Flood and Waterfront Records Before Selling
Separate flood disclosure, elevation, repairs and waterfront rights before comparing sale terms.

Seller Guide · October 6, 2026
How to Prepare Sarasota Condo Inspection and Reserve Records Before Selling
Separate building condition, reserve funding and resale documents before comparing sale terms.