Market Brief · by Aidan Sowa · October 5, 2026
Is a Highland Village Seller Reading a Renter Market as a Buyer Market? Reading Realtor.com, Redfin and the Census Tenant Turnover
Reading Realtor.com, Redfin and the Census Tenant Turnover for Highland Village, TX, with each source dated and its limits noted, for owners weighing a listing against a direct sale.
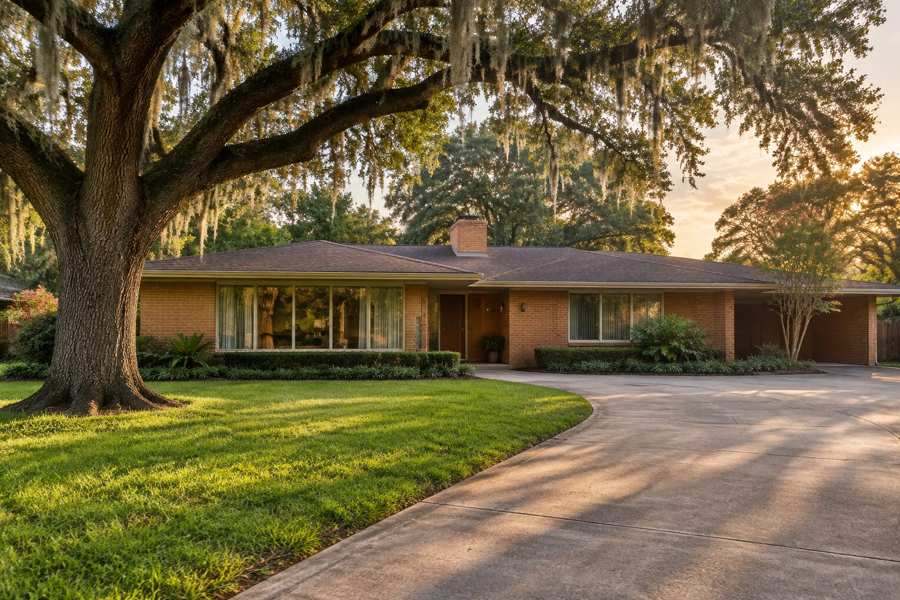
Is a Highland Village seller reading a renter market as a buyer market? Realtor.com's page for Highland Village, with key indicators as of March 2026, shows 3 active listings, down 50%, and 1 rental listing, down 75%, and says in its own text that specific market metrics for the neighborhood are not currently available. There is no median price, no days on market and no sale-to-list ratio for Highland Village itself. An owner who wants a price has to look at the postal area around it, and that area is a different kind of market.
The postal area is mostly rented. The Census counts 12,173 occupied homes, of which 8,493, or 69.8%, are rented, and 62.7% of those renters moved in since 2020. Realtor.com's page for the postal area, for June 2026, shows a median sold price of $730,000, a median listing price of $714,500, down 13.64%, 149 active listings, 275 rental listings, down 55.19%, and homes selling 6.29% below the ask. Redfin's page for the postal area shows that 34.6% of listings had price drops. A seller of a house here is selling into a market whose buyers and renters are largely apartment households.
Maison Off-Market speaks only to sellers, and this brief is for an owner in Highland Village. It shares its Census postal area with Afton Oaks, which has its own brief on housing types and owners, so this one takes the cut on renters, rents and age. Every figure below is dated and linked, the arithmetic is shown, and inferences are labeled.
Key Findings
- Realtor.com's page for Highland Village, with key indicators as of March 2026, showed 3 active listings, down 50% in a year and down 66.67% in three, and 1 rental listing, down 75% and down 80%. The page says that specific market metrics for the neighborhood are not currently available (Realtor.com, Highland Village housing market).
- Realtor.com's page for the postal area that includes Highland Village, for June 2026, showed a median listing price of $714,500, down 13.64% in a year and down 21.98% in three, a median sold price of $730,000, up 22.95%, $341 per square foot, up 1.72% and down 16.75% in three years, 149 active listings, down 9.94% and up 15.60%, 45 days on market, up 19.54%, 275 rental listings, down 55.19% and down 64.74%, and a median rent of $1,800, down 16.36% and down 19.86%. Homes sold for 6.29% below the asking price, a ratio of 94%, and the page called it a buyer's market (Realtor.com, postal area housing market).
- Redfin's page for the postal area, for the three months ending June 2026, showed a median sale price of $734,834, down 37.9%, $321 per square foot, down 10.6%, 62 homes sold in June against 52, 39 days on market against 55, a Compete Score of 45, a sale-to-list ratio of 96.0%, 10.0% of homes sold above list and 34.6% of listings with price drops. The average home sold about 3% below list and went pending in around 47 days, and hot homes sold around list in around 13 days (Redfin, postal area housing market). The page title says as of July.
- The Realtor.com sold median of $730,000 and the Redfin median of $734,834 are 0.7% apart, computed here, but their changes, up 22.95% and down 37.9%, are far apart and are not relied on.
- In the Census postal area that includes Highland Village, 69.8% of occupied homes are rented, 62.7% of renters moved in since 2020, the median rent is $1,865, the median household income is $103,812 and 31.0% of residents are between 25 and 34 (U.S. Census Bureau, American Community Survey 2020-2024 five-year estimates, via Census Reporter).
What can an owner learn when the neighborhood has no published numbers?
Be plain about what is missing. Realtor.com's Highland Village page prints three active listings and one rental, with percent changes, and nothing else. Three listings a year after six, and three years after nine, is a small count, and it says that very few homes come to market in the neighborhood at a time. It does not say what they sold for. The page also says, in its own words, that metrics for Highland Village are not currently available.
That gap matters. A seller who is told a price for Highland Village by a website is being given the postal area's figure, or the city's, and neither is the neighborhood's. The postal area median of $730,000 comes from a market in which 22.0% of homes are houses and 74.7% are in apartment buildings of five or more units, as the sibling brief on Afton Oaks shows. A house in Highland Village, whatever its size, will not be priced by that median.
There is a way to bracket the answer. The sibling neighborhood of Afton Oaks has a Redfin median of $1,599,228 and a Zillow index of $1,553,564, and the postal area has a sold median near $730,000. A Highland Village house sits somewhere between the two, and where it falls depends on the lot, the size and the street. That is an inference from the neighbors, not a measured figure, and it is a wide range, about $0.73M to $1.6M, which is useful only to show that the postal area median is not the answer.
The best evidence is local and specific. It is the closed sale of a comparable house in the same few streets in the last year, which a seller can ask a local appraiser or a buyer to produce. With three listings at a time, there may be only a few such sales, and each deserves close reading. A private buyer works from the property itself, which avoids the dependence on thin data.
Think about what three listings means in practice. A buyer who wants a house in Highland Village has almost nothing to choose from, and a seller whose house comes to market is one of very few. That favors a seller on supply. But a market this thin also means that a house that sits for weeks stands out, and buyers read a long run as a sign of a problem. The usual advice is to price to the closed sales and not to the neighbors' asking prices, and with so little history a private buyer's firm offer is a useful piece of evidence in its own right.
The Zillow search page for Highland Village, Houston, lists more than 600 homes for sale under that name, but it is a listing feed under that name, and it prints no market statistics. It is not used here as evidence of the neighborhood's market.
Sources as cited. Ratios in this section are computed from the published figures.
What do the postal area price pages say, and where do they conflict?
The postal area has two price pages that nearly agree on level and wholly disagree on change. Realtor.com's sold median of $730,000 is up 22.95%, which implies about $593,737 a year earlier. Redfin's median of $734,834 is down 37.9%, which implies about $1,183,308 a year earlier. A year-earlier figure of $594,000 and one of $1,183,000 for the same area cannot both be right, and the difference is again the mix of homes that sold, which in an area of houses and apartments swings widely.
The listing side is steadier. Realtor.com's median listing price of $714,500 is down 13.64%, which implies about $827,351 a year earlier, and down 21.98% in three years, which implies about $915,700. The sold median is 2.2% above the listing median, computed here, which is unusual, since homes in a buyer's market normally sell below their listing prices. Again the mix is the likely reason, and that is an inference.
Per-foot prices are closer. Realtor.com shows $341, up 1.72%, which implies about $335 a year earlier, and down 16.75% in three years, which implies about $410. Redfin shows $321, down 10.6%, which implies about $359. Both show lower per-foot values than three years ago, which fits a market in which supply has grown: active listings are 149, up 15.60% in three years, which implies about 129 in 2023.
The pace is moderate. Redfin shows 39 days on market against 55, a fall of 16 days, and the average home goes pending in around 47 days, while hot homes sell around list in around 13 days. Realtor.com shows 45 days, up 19.54%, which implies about 38 a year earlier. The two pages disagree about direction again, and a seller should trust the level, about six weeks, more than the change.
The discount is steady. Realtor.com shows homes selling 6.29% below the ask, a ratio of 94%, and Redfin shows a ratio of 96.0%, with 10.0% of homes selling above list and 34.6% of listings with price drops. On a $730,000 sale, a gap of 6.29% is about $45,900, computed here. In a buyer's market, the price gap is the cost that sellers pay for time.
The price drops tell their own story. Redfin shows that 34.6% of postal area listings had price drops, which is more than one in three, while only 10.0% of homes sold above list. A market with many cuts and few bids above the ask is one in which sellers have been overreaching. In the Afton Oaks sibling brief the comparable figures are 25.7% cuts and 44.3% above list for the neighborhood, so the difference between a house market and an apartment market shows in the postal area's own numbers. A Highland Village house owner should read the neighborhood-style figures, not the postal area ones.
| Source | Figure | What it measures |
|---|---|---|
| Realtor.com | $714,500, down 13.64% | Median listing price, June 2026 |
| Realtor.com | $730,000, up 22.95% | Median sold price, June 2026 |
| Redfin | $734,834, down 37.9% | Median sale price, three months to June 2026 |
| Census Reporter | $859,500 | Median owner value |
Sources as cited. Ratios and year-earlier values in this section are computed from the published figures and percentages.
How fast do tenants turn over, and what does it mean for a landlord?
The Census count shows tenants who move often. Of 8,493 renter households, 1,229, or 14.5%, moved in during 2023 or later and 4,094, or 48.2%, between 2020 and 2022, so 5,323, or 62.7%, moved in since 2020. Another 3,016, 35.5%, moved in between 2010 and 2019, and only 154, 1.8%, before 2010. In all, 98.2% of renter households arrived since 2010. This is a postal area of short stays.
Rents are modest next to incomes. The Census median rent is $1,865, which is 21.6% of the median household income of $103,812 over a year, computed here. Of 8,147 renter households with a computed burden, 2,540, or 31.2%, spent less than 20% of income on rent, 2,639, or 32.4%, spent between 20% and 30%, and 2,968, or 36.4%, spent 30% or more, including 1,336, or 16.4%, who spent half or more.
Realtor.com shows that rents have fallen. The postal area's median rent of $1,800 is down 16.36%, which implies about $2,152 a year earlier, and down 19.86% in three years, which implies about $2,246. Rental listings are 275, down 55.19%, which implies about 614, and down 64.74% in three years, which implies about 780. Fewer rentals at lower rents looks odd, and it may reflect a change in which units are listed, not a change in the market. The Census figure, $1,865, is 3.6% above Realtor.com's, computed here.
Homes are small. Of 8,493 renter households, 1,076, or 12.7%, live in a home with no bedroom, 4,157, or 48.9%, in a one-bedroom, 2,598, or 30.6%, in a two-bedroom and 662, or 7.8%, in a home with three or more bedrooms. So 61.6% of renters live in a home with none or one bedroom. The rental stock is mostly apartments, and the houses that are rented are few.
For a landlord who owns a house or a small building here, the numbers raise a question. A tenant who has been in place since 2020 is a relative veteran, and a vacancy can last. If rents are soft and the sale market is a buyer's market, a landlord might compare the income from letting with the proceeds from selling. A direct buyer can take the property with or without tenants, and can close on a date that suits the lease.
Turnover has a cost for owners of rental property, and the figure is easy to compute. If a unit rents at the Census median of $1,865 and sits empty for two months between tenants, the lost rent is $3,730, before cleaning, repairs and marketing. With 62.7% of renter households arriving since 2020, an average tenancy of about three or four years is plausible, which is an inference, and a landlord could face that gap many times over a decade. A sale ends the cycle, and a buyer who wants the tenants as they are can make it simple.
Source: U.S. Census Bureau, American Community Survey 2020-2024 five-year estimates, tables B25003, B25038, B25070, B25042, B25064 and B19013, via Census Reporter, with Realtor.com rent figures as cited. Shares are computed here.
What do vacancy and age say about demand?
Vacancy is high, at 13.8%. Of 14,123 housing units, 1,950 are vacant. Of those, 1,304, or 66.9%, are for rent, 180, 9.2%, are rented and not yet occupied, 130, 6.7%, are for sale only, 82, 4.2%, are sold and not yet occupied, 127, 6.5%, are held for seasonal use and 127, 6.5%, for other reasons. The 1,304 homes for rent, set against 8,493 rented homes, give a rental vacancy of about 13.3% when counted as vacant-for-rent over rented plus vacant-for-rent, computed here.
A rental vacancy of that size means that landlords compete for tenants, which fits the fall in rents on Realtor.com. It also fits the newness of the buildings: 5,279 units, 37.4%, were built in the 2010s and 760, 5.4%, in 2020 or later, so 6,039 units, 42.8%, were built since 2010, and new buildings spend months filling. The median build year for the postal area is 2004.
Homes for sale are rare in the Census count. Only 130 homes were vacant and for sale only, against 3,680 owner-occupied homes, a rate of 3.5%, computed here. The Realtor.com count of 149 active listings is of the same order. A small supply of houses and a large supply of apartments explain why house prices in the neighborhood differ so much from the postal area median.
The residents are young. Of 20,317 people, 9.5% are under 18, 7.7% are 18 to 24, 31.0% are 25 to 34, 12.9% are 35 to 44, 22.6% are 45 to 64 and 16.4% are 65 or older. Nearly a third are in their late twenties and early thirties, the age of renters who move often and may later buy. They are not the buyers of a luxury house, but a part of them will be in a few years.
What does this mean for a seller of a house? It means that the surrounding market of apartments and tenants does not set the price of the house, and it does not supply the buyer. The buyer may well come from outside the postal area, and the sale is set by the property. A seller who understands that will look for evidence from houses, and not from the area's rent or turnover.
Income gives a final check on who lives here. A median household income of $103,812 against an owner value of $859,500 is a ratio of 8.3, computed here, and the Census margin on that owner value is plus or minus $129,053, which is large because the owner sample is small, with only 3,680 owner households. A median based on so few owners moves a good deal from year to year, and a seller should not treat it as exact. It is one more reason to rely on a closed sale of a comparable house nearby. Readers comparing markets can also read the Afton Oaks brief and the Memorial Villages brief.
Source: U.S. Census Bureau, American Community Survey 2020-2024 five-year estimates, tables B25004, B25034, B25003 and B01001, via Census Reporter. Shares are computed here.
What should a Highland Village owner ask, and what does a private sale change?
Five questions are worth asking. What did comparable houses in my few streets close for in the last year? Is the value in the house or in the lot? How long will a sale take, and what does waiting cost? What will the fees be? How much of the price survives the buyer's inspection?
Fees are simple arithmetic, and no rate is assumed here. Each 1% of a $450,000 sale is $4,500, of a $725,000 sale is $7,250 and of a $1,200,000 sale is $12,000. Three percent is $13,500, $21,750 and $36,000, and five percent is $22,500, $36,250 and $60,000. A seller can put their own quoted costs into those rows. On the Realtor.com postal area sold median of $730,000, 1% is $7,300.
With three listings at a time, a listing is conspicuous, and a house that sits unsold is known to the neighborhood. A private sale has no showings and no neighbors talking about it, which is the first benefit, and a closing date that suits the seller, which is the second. With homes in the postal area selling 6.29% below the ask on average, the ability to avoid a long public run has real value.
The third and fourth benefits are no commission costs and no closing costs, and the fifth is no inspection repairs. For an owner who also lets the property, a direct buyer can accept it as it stands, with the tenants and the condition as they are.
Maison Off-Market buys luxury homes and estates directly from their owners and speaks only to sellers. It does not say that a private sale always beats a public listing, and where the published figures for the neighborhood are this thin, an owner is right to compare an offer with what the same home would net after costs. If you would like a private, no-obligation offer for a home in Highland Village, call 401-219-4207 or use the contact form on this site.
Sources as cited. Fee illustrations are arithmetic only and assume no commission rate.
Methodology and limitations
Each page's date, title and place were read before use. The Realtor.com Highland Village page carries key indicators as of March 2026 and says that specific neighborhood metrics are not available, so only its listing counts are reported. The Realtor.com postal area page is for June 2026, and the Redfin postal area page is for the three months ending June 2026 and is titled as of July. Their changes conflict and are not relied on. A Zillow search page for Highland Village was read and not used because it carries no market statistics. Only established data publishers and the Census are cited. The Census figures are five-year estimates for the postal area that includes Highland Village, shared with a sibling post on Afton Oaks. Percent changes were taken as printed, and ratios, sums, fee figures and year-earlier values are this brief's arithmetic.
Conclusion
The record for Highland Village shows almost no published neighborhood numbers, a postal area sold median near $730,000 that includes many apartments, a buyer's market with homes selling about 6% below the ask and a renter base in which 62.7% moved in since 2020. The useful number for an owner is a closed sale of a comparable house nearby, and a private buyer can price the property in front of them.
Frequently Asked Questions
What is the median home price in Highland Village?
Realtor.com does not publish a median for Highland Village itself. For the postal area it shows $730,000 sold in June 2026, and Redfin shows $734,834 for the three months ending June 2026.
How long do homes take to sell near Highland Village?
Redfin shows 39 days on market for the postal area, and Realtor.com shows 45 days.
Do homes near Highland Village sell below asking?
Realtor.com shows homes selling 6.29% below the ask, a ratio of 94%, and Redfin shows a ratio of 96.0%.
What does the Census say about renters near Highland Village?
In the postal area, 69.8% of occupied homes are rented, and 62.7% of renters moved in since 2020.
Can I sell my home in Highland Village privately?
Yes. Maison Off-Market buys luxury homes and estates directly from their owners with no showings, flexible closing dates, no commission costs, no closing costs and no inspections or repairs. Call 401-219-4207 or use the contact form.
Compare your options before committing. Request a written private offer for your property, with no obligation, then weigh it against your listing plan.
Sources
- Realtor.com, Highland Village housing market, 2026. Highland Village Neighborhood of Houston, TX Housing Market. https://www.realtor.com/local/market/texas/houston/highland-village.
- Realtor.com, postal area housing market, 2026. Housing Market Data, Houston, TX Home Prices and Rental Trends. https://www.realtor.com/local/market/texas/zipcode-77027.
- Redfin, postal area housing market, 2026. Housing Market: House Prices and Trends. https://www.redfin.com/zipcode/77027/housing-market.
Related research

Seller Guide · October 6, 2026
How to Prepare Point Pleasant Beach Rental Records Before Selling
Separate rental approval, income history and booked stays before comparing sale terms.

Seller Guide · October 6, 2026
How to Prepare Rumson Flood and Waterfront Records Before Selling
Separate flood disclosure, elevation, repairs and waterfront rights before comparing sale terms.

Seller Guide · October 6, 2026
How to Prepare Sarasota Condo Inspection and Reserve Records Before Selling
Separate building condition, reserve funding and resale documents before comparing sale terms.