Market Brief · by Aidan Sowa · October 5, 2026
How Much Do Biscayne Park Homes Really Sell For? Reading Several Medians
Reading Several Medians for Biscayne Park, FL, with each source dated and its limits noted, for owners weighing a listing against a direct sale.
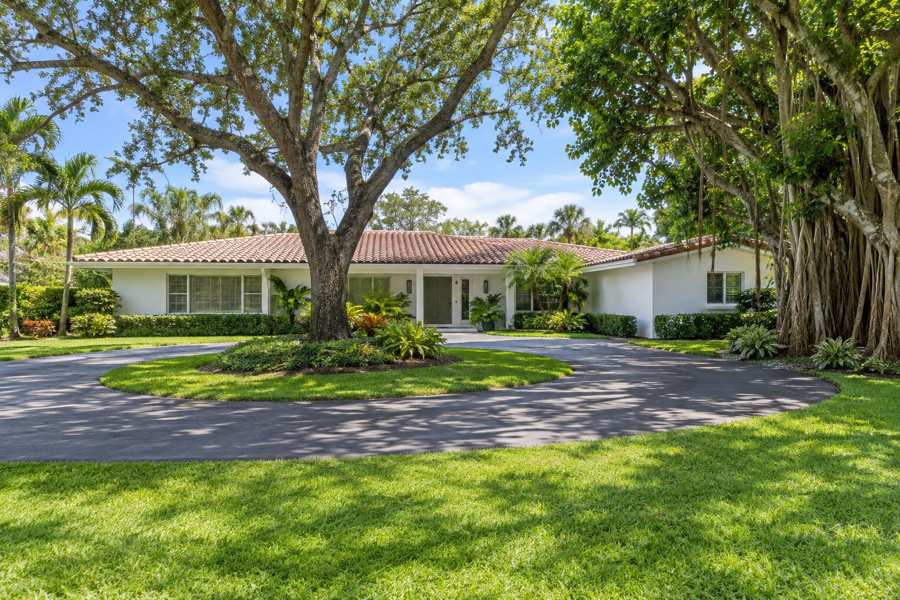
How much does a house in Biscayne Park sell for? Realtor.com's page for the town, with key indicators as of June 2026, gives a median sold price of $1,450,000. A real estate firm's statistics page, updated September 25, 2026, gives $1,245,000 for the trailing twelve months and $1,212,000 for August. A third firm's market report, refreshed October 1, 2026, gives $1,235,000. The three are within 17% of one another, and each describes a market of a few dozen sales a year.
The other numbers diverge more. Realtor.com counts 32 homes for sale, the firm's page counts 23 houses, and the third report counts 12. Realtor.com says homes sold 3.79% below asking, a ratio of 96%. The firm says houses sold at 93.0% of final asking in August. The third report says 91.4%, or about 9% off asking. The town is small enough that a few sales or listings change every figure.
This brief reads the Realtor.com page for Biscayne Park, a real estate statistics page for the town, a market report page from a third brokerage and the Census profile side by side, tests the neighborhood table against the headline count and asks what the figures mean for an owner who is choosing between a public listing and a private sale.
Key Findings
- Realtor.com reported, with key indicators as of June 2026, a median listing price of $1,312,500 for Biscayne Park (down 14.77% on the year and down 2.74% on three years), a median sold price of $1,450,000 (up 38.10% on three years, with no one-year change shown) and $821 per square foot (up 18.13% and up 7.04%).
- The same page reported 32 active listings (unchanged on the year and up 135.29% on three years), a median of 79 days on market (up 26.40% and down 5.95%), 25 rental properties (up 40.91% and up 34.78%) and a median rent of $3,550 a month (down 7.72% and up 1.43%). It said homes sold 3.79% below asking in June 2026, a sale-to-list ratio of 96%, and called the town a buyer's market.
- A real estate firm's statistics page, updated September 25, 2026, reported a median house sale of $1,212,000 in August 2026 (6 sales), a trailing twelve-month median of $1,245,000 on 47 sales against $960,000 on 35 sales a year earlier (up 29.7%), 23 houses for sale, 5 under contract and 5.9 months of supply. It reported that 34 houses sold from January 1 to August 31, 2026 against 17 a year earlier.
- The same page reported that houses sold at a median 93.0% of final asking in August, that sold houses took a median 75 days to go under contract in August (54 days over twelve months) and that houses still for sale had been listed a median 82 days. The county median house sale was $680,000, and its median wait was 39 days.
- A third brokerage's report, refreshed October 1, 2026, gave a median sold price of $1,235,000 (up 1.6% on the year, from 29 sales, with its confidence marked low), $559 per square foot, a sale at 91.4% of asking, 57 days to contract, 12 homes for sale and 3 pending.
- In the Census postal area that includes Biscayne Park, 56.0% of occupied homes are rented and the median household income is $58,325.
Why do three sources give three medians?
Each source uses a different set of sales. Realtor.com's median of $1,450,000 is a June 2026 key indicator, and the page shows a three-year change of 38.10% but no one-year change, which means the one-year comparison was not available. The firm's statistics page uses a trailing twelve-month window of 47 house sales, and its August median uses 6 sales. The third report uses 29 sales and marks its own confidence as low.
The firm explains its method: it uses the shortest window with at least five sales, and it says that monthly and trailing medians compare different homes and not repeat sales of the same home. The page also says that moves between windows partly reflect what happened to sell. With 6 sales in a month, one house at $2 million or at $700,000 can move the median by $100,000.
The gaps are worth stating. Realtor.com's $1,450,000 is 16.5% above the firm's $1,245,000 and 17.4% above the third report's $1,235,000. The firm's own January to August median is $1,275,000 on 34 sales, against $1,015,000 on 17 sales in the same months of 2025, which is a rise of 25.6%. The firm's twelve-month rise is 29.7%, and the third report's rise is 1.6%. A seller who hears a rise of 1.6% from one source and 29.7% from another is hearing about different windows.
The count of sales matters as much as the median. The firm reports 47 house sales in the twelve months to August 2026 against 35 in the twelve months before, a rise of 34.3%, and 34 sales from January to August against 17, a doubling. The third report analyzed 29 sales. A rise of 12 sales a year is a large change in a town where a single street may change hands once a decade, and it may reflect owners who chose to sell in a year when prices had risen.
A fair reading is that a typical sold house in the town has brought around $1.2 to $1.45 million over the past year, and that nobody can say more with 29 to 48 sales. The price per foot gives a second check. At $605 per foot over twelve months (the firm) and $559 per foot (the third report), a $1,245,000 house is about 2,060 square feet and a $1,235,000 house about 2,210. At Realtor.com's $821 per foot, the $1,450,000 median is about 1,770 square feet.
| Source | Median sold price | Price per sq ft | Sale vs asking |
|---|---|---|---|
| Realtor.com, June | $1,450,000 | $821 (listing basis not stated) | 96% (3.79% below) |
| Real estate firm, twelve months to August | $1,245,000 (47 sales) | $605 | 93.0% in August (6 sales) |
| Third brokerage, twelve months | $1,235,000 (29 sales, low confidence) | $559 | 91.4% |
Source: Realtor.com and two brokerage pages as cited. The 16.5%, 17.4%, 25.6% and implied square footage figures are this brief's arithmetic from the stated figures. Commercial content; not independently verified.
How many homes are really for sale?
Realtor.com counts 32 active listings for the town. The firm's page counts 23 houses for sale and 5 under contract on September 25, 2026, and no condominiums or townhouses for sale. The third report counts 12 for sale and 3 pending on October 1. The numbers are for different dates, June, late September and early October, and they could all be right.
They could also differ in what they count. Realtor.com's count is for the town and may include condominiums, townhouses and land, while the firm counts houses. The firm says that only one condominium or townhouse sold in twelve months, which is why it does not report a median for them. The third report counts homes in five of eight communities it tracks.
At 3.9 sales a month, 23 houses is 5.9 months of supply, the firm says, against 5.1 months for the county. Realtor.com's 32 listings are 135.29% more than three years ago, which implies about 14 listings in 2023. Even the lowest count of 12 is below that, so the stock is plainly more than it was, but the exact number depends on the source and the day.
The firm adds that 9 houses came to market in August. At that pace a month's new listings are 39% of the whole stock, which turns over fast. A seller who lists in a month when several others list has more competition than the stock suggests, and a seller who lists in a quiet month has less.
| Source | Date | Homes for sale | Other counts |
|---|---|---|---|
| Realtor.com | June | 32 | 25 rentals |
| Real estate firm | September 25 | 23 houses | 5 under contract, 9 new in August |
| Third brokerage | October 1 | 12 | 3 pending |
Source: Realtor.com and two brokerage pages as cited. The 14 listings, 39% and 3.9 sales a month are this brief's arithmetic from stated figures. Commercial content; not independently verified.
Does the neighborhood table cover the town?
The Realtor.com neighborhood table lists homes for sale in seven areas: Biscayne Park Estates 5, Griffings Biscayne Park Estates 3, Biscayne Lawn 2, Biscayne Boulevard Park 2, Richards Miami Shores 1, Biscayne Terrace 1 and Miami Shores Heights 1. The sum is 15, which is 47% of the headline of 32. Six further areas are named with no homes for sale.
The rentals are better covered. The table lists Biscayne Lawn 8, Biscayne Boulevard Park 7, one each in Biscayne Park Estates, Adriatic and Bisc Park Village, which sum to 18 of the headline 25, or 72%. Biscayne Lawn's median rent is $2,800 a month, which is 21% below the town's $3,550.
Two of the names, Richards Miami Shores and Miami Shores Heights, point to the neighboring village of Miami Shores, which means that some of the homes in the table are not in Biscayne Park at all. This is an inference from the names and the page does not say it, but it shows how loose the boundary is. The town covers a small area, and its edges are crossed by other places that share the street grid.
The rental side of the table says something about who lives in the town. Eight rentals on one named area and seven on another are most of the 25 on the page, and the median rent of $3,550 a month is down 7.72% on the year. A landlord who thinks of renting a house out instead of selling it would see a yearly rent of $42,600, which is 3.4% of the twelve-month sold median of $1,245,000, before taxes, insurance, repairs and vacancy. That is a figure to weigh against a sale, not a recommendation.
For an owner, the table is a reminder that the name on a listing and the boundary on a page are not the same. A house in the Estates, on the boulevard or on the Lawn may be compared with different sales, and a buyer's agent will compare it with the homes nearest to it.
| Area | Homes for sale | Rentals |
|---|---|---|
| Biscayne Park Estates | 5 | 1 |
| Griffings Biscayne Park Estates | 3 | 0 |
| Biscayne Lawn | 2 | 8 |
| Biscayne Boulevard Park | 2 | 7 |
| Richards Miami Shores, Biscayne Terrace and Miami Shores Heights | 3 | 0 |
| Adriatic and Bisc Park Village | 0 | 2 |
Source: Realtor.com page as cited. The sums of 15 and 18, the 47%, 72% and 21% figures are this brief's arithmetic. The remark on neighboring boundaries is this brief's inference from the names. Commercial content; not independently verified.
What discount should a seller expect, and how long a wait?
Three sources give three discounts. Realtor.com says homes sold 3.79% below asking in June, a ratio of 96%. The firm says houses sold at 93.0% of final asking in August on 6 sales. The third report says 91.4% over twelve months, and says buyers negotiate roughly 9% off asking. The county's figure on the third report's page is 93.2%.
On the firm's median of $1,245,000, 93.0% implies a final asking price of about $1,339,000, and a gap of about $94,000. On the third report's figure of 91.4%, the gap for a $1,235,000 sale is about $116,000. On Realtor.com's 96%, the gap for $1,450,000 is about $60,400. The range is from about $60,000 to about $116,000.
The waits differ too. Realtor.com gives 79 days for listings, up 26.40% on the year. The firm gives 75 days to contract for August sales, 54 days over twelve months and 82 days for houses still for sale. The third report gives 57 days. The range is 54 to 82 days, or 28 days. The firm itself notes that the sold figure is shorter because homes that sell quickly leave the for-sale pool.
Across the Miami area the median days on market was 74 in March 2026 and 85 in July (Realtor.com, days on market), so the town's 79 days sits in the middle of the metro's range. A seller can reasonably plan for two to three months and a discount of several percent, and a house that lists too high can wait longer.
Source: Realtor.com, two brokerage pages and the Miami series as cited. The $1,339,000, $94,000, $116,000, $60,400 and 28 day figures are this brief's arithmetic. Commercial content; not independently verified.
What does the Census say, and why is it a different place?
The postal area that includes Biscayne Park is much larger than the town. It has 54,814 residents and 18,965 housing units, and the town is a small part of it. Its median household income is $58,325, its median gross rent is $1,611, and its owner-estimated median home value is $441,700, with a margin of error of $24,325, or 5.5%. The town's median sold price of about $1.2 to $1.45 million is 2.8 to 3.3 times that value.
Renters hold 9,690 of the 17,302 occupied homes in the postal area, 56.0%, and owners 7,612, 44.0%. There are 1,663 vacant homes, 8.8%. This is a renting area, and the town's single-family houses are a different segment from it. Realtor.com's own page for the postal area gives a median listing price of $550,000 and $390 per foot, which is 58% below the town's listing median of $1,312,500.
The stock is old. The median year built is 1965, and 15,082 homes, 79.5%, were built before 1980. Homes from the 1950s number 5,125, 27.0% of the total, and from the 1940s 2,061. A house built in the 1940s or 1950s is seventy years old or more, and its roof, wiring, plumbing and windows may have been replaced or not.
The Realtor.com page shows the same pattern in the town, where a median sold price is a house of about 1,700 to 2,200 square feet, a size typical of mid-century homes that have been enlarged. A buyer's inspection of such a house can produce a long list, and in a market where houses sell at 91% to 96% of asking, a seller has less room to refuse it.
Source: U.S. Census Bureau, American Community Survey 2020-2024 and Realtor.com as cited. Multiples, shares and gaps are this brief's arithmetic. The remark on enlarged mid-century homes and inspections is this brief's reasoning and not a statement of the Census.
What does the regional series add, and what should an owner ask?
In the Miami area, active listings fell from 43,929 in May 2026 to 41,277 in September (Realtor.com, active listings), a drop of 6.0%. New listings fell from 10,664 in April to 9,104 in August, a drop of 14.6%. The median listing price was $499,000 in May and $490,000 in September, a drop of 1.8%.
Homes with a price cut fell from 10,942 in March to 8,810 in July (Realtor.com, price reduced listings), a drop of 19.5%. The metro looks to be calming, with fewer listings and fewer cuts, while the town's own pages describe a buyer's market. The town's price level is about 2.7 times the metro's listing median.
An owner can test any offer, public or private, with plain questions. What is the price, and is any part of it conditional on an inspection, a loan or the sale of another home? What will I take home after every charge? When will the sale close, and can the date move? Who pays for the repairs a buyer asks for?
A small market has more. Which recent sales are true comparables for my street, size and age? How many days did they wait, and what did they close at against the final asking price? Do I know how much of my asking price I am likely to give up? What would I pay in taxes, insurance and upkeep if the sale takes another two or three months? Readers comparing markets can also read the Davis Islands brief and the Downtown Sarasota brief.
Source: Realtor.com series published by the Federal Reserve Bank of St. Louis as cited. The 6.0%, 14.6%, 1.8%, 19.5% and 2.7 figures are this brief's arithmetic. The questions are this brief's general reasoning and not statements of any source.
What does a private sale change?
Maison Off-Market buys homes directly from their owners. It does not list a home, hold showings or put a home on a public listing. For a Biscayne Park owner, the five benefits are plain. There are no showings and no neighbors talking about the sale. The closing date can be flexible, which gives time to find a new home. There are no commission costs and no closing costs for the seller, and there are no inspections and repairs.
A little arithmetic shows what that is worth. Each 1% of a $1,245,000 sale is $12,450. A seller who gives up 3% gives up $37,350, and one who gives up 5% gives up $62,250. This brief does not claim that those are the costs of any sale, since the real figures depend on the agreement the seller signs. It shows how quickly a percentage becomes a sum, and how it compares with a gap of $60,000 to $116,000 between the final asking price and the sale price.
The benefit that fits a town of this size is privacy. In a place with a few dozen sales a year, a listing is visible to most of the buyers' agents and many of the neighbors, and a price that has to be cut is cut in public. The last benefit matters for older houses. A buyer's inspection of a seventy-year-old house leads to a repair list, and a direct sale to a buyer who plans the work avoids it.
Maison Off-Market speaks only to sellers. An owner who wants to see what a direct offer would look like can use the contact form below, or call 401-219-4207, and ask for a figure with no showings, no listing and no obligation.
Source: Maison Off-Market. The fee figures are this brief's arithmetic and not claims about any sale.
Methodology and limitations
Prices, price per square foot, days on market, listing and rental counts and the neighborhood table come from a national listing site page with key indicators as of June 2026. Sale prices, sales counts, months of supply and discounts from asking come from a real estate firm's statistics page updated September 25, 2026 and from a second brokerage's market report refreshed October 1, 2026. The sources cover different months and sets of sales and are not independently verified.
Age, tenure, vacancy, income, rent and owner-estimated value come from the American Community Survey 2020-2024 five-year estimates for the postal-code area that includes Biscayne Park. The area is much larger than the town. Shares are calculated from published counts, and owner-estimated value carries a margin of error.
Days on market, active and new listings, median listing price and price reduced counts are Realtor.com series published by the Federal Reserve Bank of St. Louis for the Miami metropolitan area. They describe the region and not the town. Implied sizes and discounts are this brief's arithmetic. The brief makes no forecast and values no home.
Conclusion
The Biscayne Park record shows sold medians of $1.45 million, $1.245 million and $1.235 million, counts of 32, 23 and 12 homes for sale, and discounts from asking of 4% to 9%. It describes a small market in which each source sees a different slice, and in which a seller should plan for a wait of two to three months and a gap between asking and sale prices.
It does not fix a price for any one home. The choice between a public listing and a private sale comes down to whether an owner would rather meet showings, inspections and a repair list or take privacy, a flexible closing date, no commission, no closing costs and no inspections or repairs. To see what a direct offer would look like for your home, use the contact form below or call 401-219-4207.
Frequently Asked Questions
What is the median home price in Biscayne Park?
Realtor.com reports a median sold price of $1,450,000 for June 2026. A real estate firm reports $1,245,000 over twelve months, and a third brokerage reports $1,235,000.
How long do Biscayne Park homes take to sell?
Sources report 54 to 82 days, depending on the measure.
Do Biscayne Park homes sell below asking?
Yes. Sources report sales at 96%, 93.0% and 91.4% of asking.
How many homes are for sale?
Sources report 32, 23 and 12 on different dates.
Does a private sale always beat a public listing?
No. A public listing can attract competing bids. A private sale offers privacy, a flexible closing date, no commission, no closing costs and no inspections or repairs.
Compare your options before committing. Request a written private offer for your property, with no obligation, then weigh it against your listing plan.
Sources
- Realtor.com, 2026. Biscayne Park, FL Housing Market and Rental Trends. https://www.realtor.com/local/market/florida/miami-dade-county/biscayne-park.
- PBP Real Estate, 2026. Biscayne Park Real Estate Statistics 2026. https://www.pbprealestate.com/biscayne-park-real-estate-statistics/.
- Momentum Realty, 2026. Biscayne Park Housing Market. https://movewithmomentum.com/market/biscayne-park/.
- U.S. Census Bureau, 2026. American Community Survey 2020-2024 five-year estimates, the Biscayne Park area (via Census Reporter). https://censusreporter.org/profiles/86000US33161-33161/.
- Realtor.com, 2026. Housing Inventory: Median Days on Market in Miami-Fort Lauderdale-West Palm Beach, FL (CBSA). https://fred.stlouisfed.org/series/MEDDAYONMAR33100.
- Realtor.com, 2026. Housing Inventory: Active Listing Count in Miami-Fort Lauderdale-West Palm Beach, FL (CBSA). https://fred.stlouisfed.org/series/ACTLISCOU33100.
- Realtor.com, 2026. Housing Inventory: Price Reduced Count in Miami-Fort Lauderdale-West Palm Beach, FL (CBSA). https://fred.stlouisfed.org/series/PRIREDCOU33100.
Related research

Seller Guide · October 6, 2026
How to Prepare Point Pleasant Beach Rental Records Before Selling
Separate rental approval, income history and booked stays before comparing sale terms.

Seller Guide · October 6, 2026
How to Prepare Rumson Flood and Waterfront Records Before Selling
Separate flood disclosure, elevation, repairs and waterfront rights before comparing sale terms.

Seller Guide · October 6, 2026
How to Prepare Sarasota Condo Inspection and Reserve Records Before Selling
Separate building condition, reserve funding and resale documents before comparing sale terms.