Market Brief · by Aidan Sowa · October 5, 2026
How Hot Is Lakeview When Most Homes Sell Above List? Reading Redfin, Realtor.com and the Census Small Apartments and Young Renters
Reading Redfin, Realtor.com and the Census Small Apartments and Young Renters for Lakeview, IL, with each source dated and its limits noted, for owners weighing a listing against a direct sale.
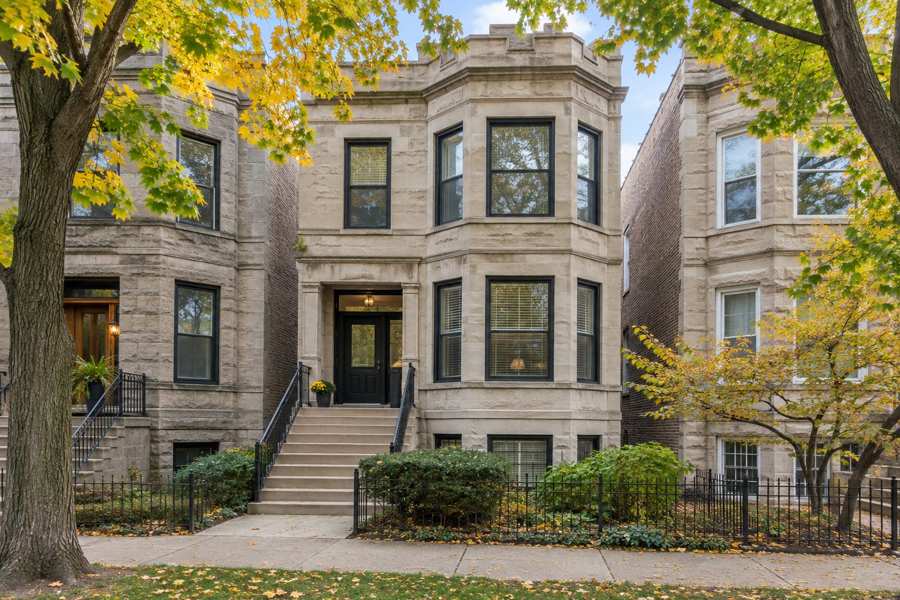
How hot is Lakeview when most homes sell above list? Redfin's page for Lake View says very, with a Compete Score of 80, a median sale price of $594,793 for the three months ending June 2026, up 8.3% in a year, a sale-to-list ratio of 105.0% and 64.2% of homes sold above their list price, up 11.3 points. Realtor.com's page for Lake View, for August 2026, shows a median sold price of $563,500, up 10.49%, a median listing price of $526,250, up 16.30%, and a sale-to-list ratio of 102%, and calls the market very hot and a seller's market. The Redfin sold median is 5.6% above the Realtor.com one, computed here, and the two pages cover different months.
Unlike many markets in this series, these pages mostly agree. Prices are up on every page, homes sell in about a month or less, and buyers pay at or above list. The disagreements are in size and in the details. Redfin shows 39 days on market, unchanged from a year earlier, while Realtor.com shows 26 days, down 4.35%, and 21 days for the postal area, down 8.70%. Redfin says the average home sells about 4% above list. Realtor.com says approximately the asking price. In a market where the typical buyer offers over the list price, the list price tells a seller what the first offer might be, not what the sale will bring, so a seller who reads only list prices will undersell the home.
Maison Off-Market speaks only to sellers, and this brief is written for an owner in Lakeview who has seen how strong the numbers are and wants to know what they mean for a particular home. The Census data for the postal area adds a point the price pages leave out: Lakeview is a neighborhood of small apartments and young renters, where 62.5% of occupied homes are rented, 45.6% of all homes have one bedroom or none, and 35.9% of residents are between 25 and 34. A house or a family-sized home is rare here, and its owner is selling into a market whose headline numbers describe mostly smaller units. Every figure below is dated and linked, the arithmetic is shown, and inferences are labeled.
Key Findings
- Redfin's page for Lake View, for the three months ending June 2026, showed a median sale price of $594,793, up 8.3%, $413 per square foot, up 15.0%, 612 homes sold in June against 567, 39 days on market against 39, a Compete Score of 80, a sale-to-list ratio of 105.0%, 64.2% of homes sold above list, 6.9% with price drops, an average sale about 4% above list and the fastest homes about 10% above list (Redfin, Lake View housing market).
- Realtor.com's page for Lake View, for August 2026, showed a median listing price of $526,250, up 16.30%, a median sold price of $563,500, up 10.49%, $374 per square foot, up 12.48%, 314 active listings, down 13.68%, 26 days on market, down 4.35%, 1,799 rental listings, down 12.02%, and a median rent of $2,294, up 9.50% (Realtor.com, Lake View housing market).
- Realtor.com's page for the postal area, for May 2026, showed a median listing price of $615,000, up 6.96%, a median sold price of $567,500, up 4.13%, $411 per square foot, up 13.54%, 232 active listings, down 12.39%, 21 days on market, down 8.70%, a sale-to-list ratio of 103% and a median rent of $2,150, up 4.88% (Realtor.com, postal area housing market).
- Zillow's page for Lake View, updated February 28, 2026, shows an average home value of $419,508, up 6.9% over the past year, a different kind of figure that includes many condominiums and apartments (Zillow, Lake View home values).
- The Census postal area that includes Lakeview has 42,943 housing units, 62.5% of occupied homes rented, 45.6% of homes with one bedroom or none, a median household income of $110,939, a median rent of $1,869, a median owner value of $537,800, plus or minus $31,604, and a median build year of 1962 (U.S. Census Bureau, American Community Survey 2020-2024 five-year estimates, via Census Reporter).
Why do the Lakeview medians differ so much?
Start with what each figure measures. Redfin's $594,793 is a median sale price across all home types for the three months ending June 2026. Realtor.com's $563,500 is a median sold price for August 2026 for the neighborhood, and its $567,500 is for May 2026 for the postal area. The Redfin figure is 5.6% above the first and 4.8% above the second, computed here. Gaps of that size between two price pages are ordinary and come from different months, different windows and different boundaries.
The year-on-year changes agree on direction. Redfin's rise of 8.3% implies a median of about $549,209 a year earlier. Realtor.com's rise of 10.49% for the neighborhood implies about $510,001, and its rise of 4.13% for the postal area implies about $544,992. The year-earlier values run from $510,001 to $549,209, a spread of 7.7%, and the current values run from $563,500 to $594,793. All the pages show prices up, by 4% to 10%, which is a tighter range than in most markets in this series.
Listing prices tell two different stories. On the neighborhood page the listing median of $526,250 is 6.6% below the sold median of $563,500, which is an unusual order, because asking prices normally run above closing prices. On the postal area page the listing median of $615,000 is 8.4% above the sold median of $567,500, the usual order. In a market where homes sell above list, a low listing median is consistent with sellers pricing to start a bidding contest, and the sold price comes out higher. That is an inference, and it fits Redfin's 105.0% sale-to-list ratio.
Zillow's figure is far lower. Its average home value of $419,508 is 29.5% below the Redfin sold median, computed here, and it implies about $392,430 a year earlier. Zillow's index covers the value of all homes, including the many small condominiums and apartments in the area, sold or not, and Redfin and Realtor.com cover homes that actually sold. The Census median owner value of $537,800, plus or minus $31,604, is 9.6% below the Redfin figure. Three different kinds of number, three different levels.
A seller can use the spread as a list of questions rather than a target. The sold figures run from $563,500 to $594,793, a span of $31,293, computed here. The right number for a home is the closed price of a similar property nearby in the same season, and in a neighborhood where most homes are small apartments, a house may have few close comparisons.
| Source | Figure | What it measures |
|---|---|---|
| Zillow | $419,508, up 6.9% | Average home value, Lake View, February 2026 |
| Realtor.com | $526,250, up 16.30% | Median listing price, Lake View, August 2026 |
| Census Reporter | $537,800 | Median owner value, postal area |
| Realtor.com | $563,500, up 10.49% | Median sold price, Lake View, August 2026 |
| Realtor.com | $567,500, up 4.13% | Median sold price, postal area, May 2026 |
| Redfin | $594,793, up 8.3% | Median sale price, Lake View, three months to June 2026 |
| Realtor.com | $615,000, up 6.96% | Median listing price, postal area, May 2026 |
Sources as cited. Ratios and year-earlier values in this section are computed from the published figures and percentages.
How long do homes in Lakeview take to sell, and how big are the premiums?
The discount question turns around here. Redfin shows a sale-to-list ratio of 105.0%, up 3.1 points, with 64.2% of homes sold above list, up 11.3 points, and only 6.9% with price drops, down 4.3 points. It says the average home sells about 4% above list and goes pending in around 39 days, and that the fastest homes sell about 10% above list in around 24 days. On a $594,793 median, 4% is $23,792 and 10% is $59,479, computed here. Realtor.com shows 102% for the neighborhood and 103% for the postal area, so its premium is smaller but points the same way.
Time on market is short. Redfin shows 39 days for the three months ending June 2026, the same as a year earlier. Realtor.com shows 26 days for August, down 4.35%, which implies about 27 a year earlier, and 21 days for the postal area in May, down 8.70%, which implies about 23. The pages count differently, but a well-priced home is under contract within about a month on every one of them.
Counts show a busy market. Redfin shows 612 homes sold in June against 567 a year earlier, an increase of 45 or 7.9%, computed here against the 8.0% printed. That is a large sample, so the Redfin median is firm. Realtor.com's inventory shows 314 active listings in the neighborhood, down 13.68%, which implies about 364 a year earlier, and 232 in the postal area, down 12.39%, which implies about 265. Over three years active listings are down 32.70% and 35.91%. Fewer homes for sale, quick sales and prices above list are the signs of a market where sellers have the advantage.
The Compete Score of 80 on a scale of 100 puts Lakeview in the very competitive range, higher than the 75 Redfin gives Lincoln Park. Realtor.com calls the neighborhood a very hot market and a seller's market, and the postal area a hot market and a seller's market. For a seller the practical point is that a fast market rewards preparation and punishes a wrong price in either direction. A price set too high loses the first weeks, which are the best. A price set too low can give away the premium the pages describe.
A private buyer removes the need to guess. The sale does not depend on a bidding contest in the first week, on staging for a stream of visitors or on waiving contingencies against competing offers. A seller who prefers certainty to the chance of a premium can ask what an offer on the house itself looks like and compare it with what the pages suggest a public sale might bring.
Sources as cited. Year-earlier values and dollar figures are computed from the published percentages.
What do per-foot prices and counts say about Lakeview?
Per-foot prices reduce the size effect. Redfin shows $413 per square foot, up 15.0%, which implies about $359 a year earlier. Realtor.com shows $374 for the neighborhood, up 12.48%, and $411 for the postal area, up 13.54%. The Redfin figure is 10.4% above the neighborhood figure and 0.5% above the postal area figure, computed here. All three per-foot prices rose by 12% to 15% in a year, faster than the sold medians, which rose 4% to 10%. A per-foot price that rises faster than the median suggests that smaller homes were a larger part of the sales. That is an inference, and it fits the Census mix.
Smaller homes are cheaper in total and can cost more per foot. In a postal area where 45.6% of homes have one bedroom or none, a median across all types is mostly a median of studios, one-bedroom apartments and small condominiums. An owner of a house, a two-flat or a large condominium should compare with homes of the same kind.
Rentals add a view of the other side. Realtor.com shows 1,799 rental listings in the neighborhood, down 12.02%, and a median rent of $2,294, up 9.50%, which implies about $2,095 a year earlier. For the postal area it shows 1,223 listings, down 15.30%, and a rent of $2,150, up 4.88%. The Census median rent of $1,869 is lower than both, because it includes long leases at older rates. Rising rents with fewer listings is a sign of a tight rental market.
Three-year changes on the neighborhood page add history. The listing median is up 18.17%, the sold median up 33.37%, the per-foot price up 27.65%, active listings down 32.70% and days on market down 24.14%. A market with a third more value in sold prices than three years ago, far fewer listings and faster sales is a market that has favored sellers for a while. These are Realtor.com's figures for one month, and they fit the Redfin picture.
For a seller the useful habit is to look at three things for a home like theirs: the closed prices of the last several comparable sales, the asking prices of homes still listed and the days those homes have been listed. These say more than a median. A private buyer looks at the same facts for one property, and can make an offer on that property alone.
Sources as cited. Year-earlier values and ratios are computed from the published percentages.
What do apartments, young renters and owner costs say about the postal area?
The Census describes a dense, young and rented place. The postal area that includes Lakeview has 42,943 housing units and 71,904 residents. Of the units, 15,767 are in buildings of fifty or more units, which is 36.7%, and 5,163 more are in buildings of twenty to forty-nine, so 48.7% of homes are in buildings of twenty or more. Buildings of three to four units hold 6,697 and buildings of five to nine hold 5,738. Detached houses are 3,323, which is 7.7%, and attached houses are 1,371, 3.2%, so only 10.9% of homes are houses of any kind.
The bedroom counts follow. Of all homes, 5,937 have no bedroom and 13,641 have one, which is 45.6% together, while 13,319 have two, 31.0%, and 10,046 have three or more, 23.4%. Among renters, 61.3% live in homes with one bedroom or none, and among owners, 43.0% live in homes with three or more bedrooms. Owners live in larger homes, and the typical home is a small one.
The people are young. Of 71,904 residents, 35.9% are between 25 and 34, 12.2% are between 18 and 24, 15.5% between 35 and 44, 14.6% between 45 and 64, 11.7% under 18 and 10.1% are 65 or older, computed here. Renter turnover is fast: 62.1% of renter households moved in since 2020. Owners are steadier, with 31.3% moved in since 2020, 41.5% between 2010 and 2019, 13.1% between 2000 and 2009 and 14.1% before 2000. The median household income is $110,939.
Rent burden is heavy. Of 25,339 renter households, 24,822 have a computed burden, and 9,628 of those pay 30% or more of income in rent, which is 38.8%, and 4,279 pay half or more, 17.2%. Owner burdens are lighter but not small. Of 11,241 owners with a mortgage, 11,166 have a computed burden, and 3,100 pay 30% or more, which is 27.8%, with 1,288 paying half or more, 11.5%. Of 3,940 owners without a mortgage, 3,878 have a computed burden, and 836 pay 30% or more, 21.6%.
The housing is old and mostly occupied. The median build year is 1962, and 72.0% of homes were built before 1980. Vacancy is 5.6%, which is 2,423 units, of which 956 are for rent, 39.5% of vacant units, 783 are classed as other vacant, 32.3%, 403 are seasonal, 0.9% of all units, and 130 are for sale only. A neighborhood this rented and this old means that many buildings have the kind of systems that a buyer's inspector will test, and a seller of an older house or building should expect questions. Readers comparing markets can also read the Lincoln Park brief and the North Center brief.
Source: U.S. Census Bureau, American Community Survey 2020-2024 five-year estimates, tables B25041, B25024, B25042, B25004, B25070, B25091, B25038 and B01001, via Census Reporter. Shares are computed here.
What should an owner ask, and what does a private sale change?
Five questions are worth asking before choosing how to sell. The first is what similar homes nearby actually sold for, because a median is not a price. The second is how long the sale will take and what it costs to wait. The third is what the fees will be. The fourth is how much of the price survives the buyer's inspection. The fifth is who will see the house and who will know it is for sale.
Fees are simple arithmetic and no rate is assumed here. Each 1% of a $450,000 sale is $4,500, of a $725,000 sale is $7,250 and of a $1,200,000 sale is $12,000. Three percent is $13,500, $21,750 and $36,000, and five percent is $22,500, $36,250 and $60,000. A seller can put their own quoted costs into those rows. With the pages showing homes selling at or above list, the fee is the largest known cost a seller can compare, and 1% of the Redfin median of $594,793 is $5,948.
Inspection is the fourth question. With a median build year of 1962 and 72.0% of homes built before 1980, an inspector is likely to find work. In a market with multiple offers, buyers sometimes waive contingencies, as Redfin notes, but a seller who counts on that may be disappointed in a slower month. A buyer who agrees to buy the home as it stands removes the question in any month.
Timing is the second question. Marketing times of 21 to 39 days are medians, so half of the homes took longer, and a house, which is rare in this postal area, may take longer than an apartment. A seller who has a job start, a school year or a family change has a date, and a public listing has a clock that does not care about it. A private buyer can agree a closing date that fits the seller, and that flexibility is the second of the five benefits below.
The benefits are plain. Maison Off-Market buys luxury homes and estates directly from their owners and speaks only to sellers. A private sale has no showings and no neighbors talking about it. It allows closing dates that give a seller time to find a new home. It has no commission costs and no closing costs, and it avoids inspection repairs. The company does not say that a private sale always beats a public listing, and in a market where one page shows $594,793 and another $563,500, an owner is right to ask what each route yields. If you would like a private, no-obligation offer for a home in Lakeview, call 401-219-4207 or use the contact form on this site.
Sources as cited. Fee illustrations are arithmetic only and assume no commission rate.
Methodology and limitations
Each page's date, title and place were read before use. The Redfin page is titled as of July and its figures are for the three months ending June 2026, the Realtor.com neighborhood page is for August 2026 and the postal area page is for May 2026, so they cover different periods. The Zillow page was updated on February 28, 2026 and is older than the others. Redfin's page also contains blocks for nearby areas, and those were not used. Only established data publishers and the Census are cited. The Census figures are five-year estimates for the postal area that includes Lakeview. Percent changes were taken as printed, and ratios, sums, fee figures and year-earlier values are this brief's arithmetic.
Conclusion
The record for Lakeview shows sold medians of $563,500 to $594,793, sale-to-list ratios of 102% to 105.0%, 21 to 39 days on market, and a postal area where 62.5% of homes are rented and only 10.9% are houses. The useful number for an owner is a closed sale of a similar property nearby, not a median, and a private buyer can price the property in front of them.
Frequently Asked Questions
What is the median home price in Lakeview?
Redfin shows a median sale price of $594,793 for the three months ending June 2026, and Realtor.com shows a sold median of $563,500 for August 2026 and $567,500 for the postal area in May 2026.
How long do homes take to sell in Lakeview?
Redfin shows 39 days on market and Realtor.com shows 26 days for the neighborhood and 21 days for the postal area.
Do homes in Lakeview sell above asking?
Redfin shows a sale-to-list ratio of 105.0%, with 64.2% of homes sold above list, and Realtor.com shows 102% to 103%.
What does the Census say about homes in Lakeview?
The postal area has 42,943 housing units, 62.5% of occupied homes rented, 45.6% of homes with one bedroom or none and a median build year of 1962.
Can I sell my home in Lakeview privately?
Yes. Maison Off-Market buys luxury homes and estates directly from their owners with no showings, flexible closing dates, no commission costs, no closing costs and no inspections or repairs. Call 401-219-4207 or use the contact form.
Compare your options before committing. Request a written private offer for your property, with no obligation, then weigh it against your listing plan.
Sources
- Redfin, Lake View housing market, 2026. Lake View, Chicago Housing Market: House Prices and Trends. https://www.redfin.com/neighborhood/157585/IL/Chicago/Lake-View/housing-market.
- Realtor.com, Lake View housing market, 2026. Lake View Neighborhood of Chicago, IL Housing Market. https://www.realtor.com/local/market/illinois/chicago/lake-view.
- Realtor.com, postal area housing market, 2026. Housing Market Data, Chicago, IL Home Prices and Rental Trends. https://www.realtor.com/local/market/illinois/zipcode-60657.
- Zillow, Lake View home values, 2026. Lake View Chicago, IL Housing Market: 2026 Home Prices and Trends. https://www.zillow.com/home-values/269589/lake-view-chicago-il/.
Related research

Seller Guide · October 6, 2026
How to Prepare Point Pleasant Beach Rental Records Before Selling
Separate rental approval, income history and booked stays before comparing sale terms.

Seller Guide · October 6, 2026
How to Prepare Rumson Flood and Waterfront Records Before Selling
Separate flood disclosure, elevation, repairs and waterfront rights before comparing sale terms.

Seller Guide · October 6, 2026
How to Prepare Sarasota Condo Inspection and Reserve Records Before Selling
Separate building condition, reserve funding and resale documents before comparing sale terms.