Market Brief · by Aidan Sowa · October 5, 2026
Is Your Downtown Boca House a Home or a Redevelopment Site? Reading the Golden Triangle, the Tower Fees and the Median Wait
Reading the Golden Triangle, the Tower Fees and the Median Wait for Downtown Boca, FL, with each source dated and its limits noted, for owners weighing a listing against a direct sale.
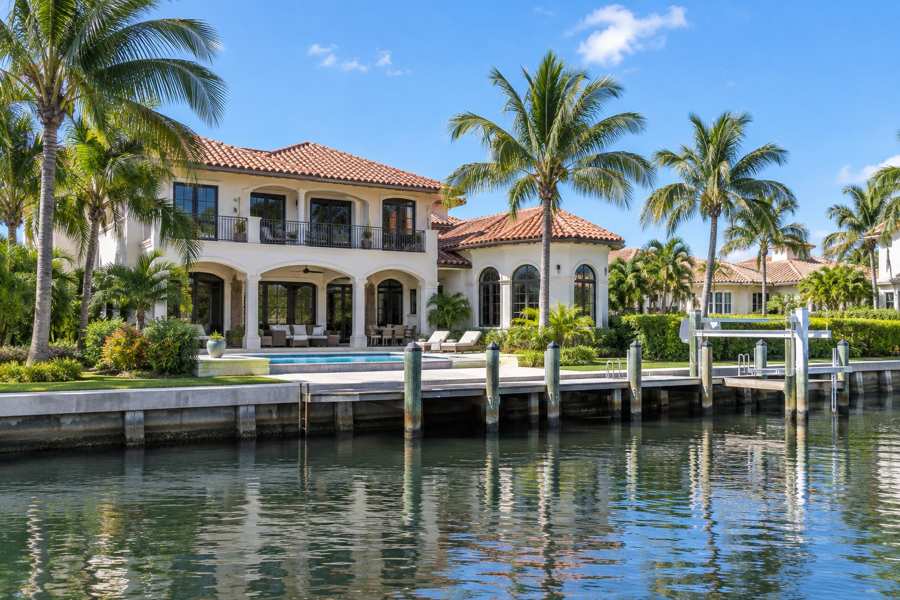
A seller of an older house in Downtown Boca is looking at a lot that may matter more than the house on it. A June 2026 guide to the Golden Triangle, the stretch east of Mizner Park, north of Palmetto Park Road and west of the Intracoastal, describes neighborhoods where older homes are being replaced by custom-built contemporary estates, where there is no homeowners association, and where homesites are limited. For an owner, that is both good news and a trap: the buyer who appears first is often a builder, and a builder prices the land.
This brief checks that picture against public figures. It reads the Census age and tenure profile of the postal area that includes Downtown Boca, a record luxury quarter reported by a Palm Beach brokerage, a daily price-cut snapshot from a Boca Raton firm, September 2026 sale statistics for houses and condominiums, and the South Florida metropolitan listing series for days on market, inventory, asking prices and price reductions. It then asks what a private direct sale changes for an owner who wants a quiet closing.
The limits are plain. The Census figures describe a postal area that includes more than the downtown, the brokerage figures are citywide or limited to sales above $3 million, and the metropolitan series cover Miami, Fort Lauderdale and West Palm Beach together. The brief says where each limit applies and does not estimate what any particular home is worth.
Key Findings
- In September 2026 Boca Raton single-family homes closed at a median of $1,162,500, up 24.3% in a year, after a median of 28 days, while condominiums and townhomes closed at $428,000 after 33 days with six months of inventory (Hammers Properties, October 2026).
- On October 5, 2026, 38.2% of the 526 houses listed for sale in Boca Raton (201 listings) were asking less than their original price, by a median of 5.4% or about $100,000; among 897 condominiums, 44.4% were reduced by a median of 6.7% (PBP Real Estate, October 2026).
- Second-quarter 2026 closings at $3 million and above reached a five-year record of $691.3 million on 113 sales, with 92 houses closing at a median of $905 a square foot against $1,355 for condominiums (Palm Beach Luxury, July 2026).
- In the Census postal area that includes Downtown Boca, 7,144 of 14,368 homes (49.7%) were built before 1980, and 3,538 units (24.6%) have no usual resident (U.S. Census Bureau, 2020-2024).
- The South Florida metropolitan median days on market rose from 74 in March 2026 to 85 in July, an increase of 11 days or 14.9% (Realtor.com, days on market).
How old is the stock under the downtown?
The Census counts 14,368 housing units in the postal area that includes Downtown Boca. The 1970s are the largest decade, with 3,932 homes, or 27.4% of the total. The 1960s follow with 2,361 (16.4%), and the 1980s with 1,949 (13.6%). Everything built before 1980 comes to 7,144 homes, 49.7% of the stock, and the median year built is 1980. The decades since 1990 each added between about 1,600 and 1,700 homes, and 355 have been built since 2020.
The age profile fits what the Golden Triangle guide describes. Boca Villas, it says, blends original Old Florida charm with a growing inventory of new construction luxury estates. Kings Court has been transformed in recent years, with older homes replaced by custom contemporary estates. Whisem offers a mix of original homes and newer luxury construction. Golden Harbour, with its deepwater canals and private docks, has a limited number of homes on five peninsulas. All four sit near Mizner Park (East Boca Raton Real Estate, June 2026).
A house from the 1960s or 1970s on a lot like that has a particular kind of value. Its systems are near or past the end of their lives, its floor plan is of a different era, and its lot is a rare and walkable parcel in a city where buyers pay premium prices for location. Which of those the buyer values is the question. A buyer who plans to live in the house will price the condition. A builder will price the dirt and subtract the cost of demolition.
For an owner, the useful move is to find out which buyer is on the other end of an offer. The guide says some remaining homesites carry no association, which makes them more flexible for a rebuild. A direct buyer who purchases homes off the market will say whether the offer is for the house or the lot, and a seller can ask for the reasoning behind the number.
| Decade built | Homes | Share of total |
|---|---|---|
| 1939 or earlier | 46 | 0.3% |
| 1940s | 149 | 1.0% |
| 1950s | 656 | 4.6% |
| 1960s | 2,361 | 16.4% |
| 1970s | 3,932 | 27.4% |
| 1980s | 1,949 | 13.6% |
| 1990s | 1,644 | 11.4% |
| 2000s | 1,614 | 11.2% |
| 2010s | 1,662 | 11.6% |
| 2020 or later | 355 | 2.5% |
Source: U.S. Census Bureau, American Community Survey 2020-2024 five-year estimates, table B25034. Shares are calculated from the published counts.
Who lives here, and how many homes sit empty?
The postal area has 21,834 residents and 10,830 occupied homes. Owners occupy 6,385 of them (59.0%) and renters 4,445 (41.0%). The most striking figure is the 3,538 housing units, 24.6% of all units, with no usual resident. That is one unit in four, which is the signature of a place where many owners live elsewhere for part of the year, and where condominium towers hold many seasonal homes.
Median household income is $107,045 and median gross rent is $2,361 a month, or $28,332 a year. A renter at the median pays 26.5% of the median income. Owners estimate the median home at $1,052,700, with a margin of error of $139,225, about 13.2%. That margin is wide, and it reflects a stock that mixes condominiums valued at a few hundred thousand dollars with houses valued in the millions.
The wide margin is a reminder that no single figure describes a downtown house. The postal-area owner estimate of just over $1.05 million lies close to the September closed-sale median of $1,162,500 for houses citywide, but they measure different things. The Census figure is what owners believe their homes are worth, across condominiums and houses alike. The September figure is what houses actually sold for.
A quarter of units without a full-time resident also has a practical effect on selling. A seller whose neighbors are mostly away can sell without the sight of a sign or a crowd of visitors being noticed. A seller in a tower faces the opposite: a board that knows everyone and a buyer-approval process. Both are reasons some owners prefer a quiet sale.
| Indicator | Value | Note |
|---|---|---|
| Population | 21,834 | Whole postal area |
| Housing units | 14,368 | All units |
| Owner-occupied homes | 6,385 | 59.0% of occupied |
| Renter-occupied homes | 4,445 | 41.0% of occupied |
| No usual resident | 3,538 | 24.6% of all units |
| Median household income | $107,045 | Estimate |
| Median gross rent | $2,361 | Monthly |
| Owner-estimated median value | $1,052,700 | Margin of error $139,225 |
Source: U.S. Census Bureau, American Community Survey 2020-2024 five-year estimates, tables B01003, B19013, B25003, B25064 and B25077.
What do houses and condominiums say about the same city?
The October 2026 update from a Boca Raton broker reports September figures from the regional listing service. Single-family homes closed at a median of $1,162,500, up 24.3% from September 2025, after a median of 28 days, at 96.0% of the final list price, with 3.3 months of inventory in early October. Condominiums and townhomes closed at a median of $428,000, up 15.7%, after 33 days, at 95.0% of final list price, with 6.0 months of inventory.
The broker describes the houses as a seller's market and the condominiums as balanced to favoring buyers, and gives the reason for the second: Florida's condominium safety laws require structural inspections and fully funded reserves, which has pushed special assessments and association fees higher in many older buildings. Buildings that have completed inspections and funded reserves are selling well, and buildings that have not are sitting longer and negotiating more. The broker also cautions that a single month's median can swing with the mix of homes that closed.
The 24.3% rise in the house median looks dramatic. The broker's own explanation is that it reflects more luxury homes closing, which means it is not a rise in what a particular house will fetch. That is the same mix lesson that the Palm Beach brokerage draws from the second-quarter record: the combined median moves with whatever mix of homes happened to sell, so the per-product figures describe prices better.
A fee is easy to turn into a yearly figure, and the figure is what a buyer does. Every $100 of monthly association charge is $1,200 a year, and a buyer who capitalizes that over the years they plan to own will take it off the price. A building with rising assessments, as the broker describes, is therefore priced lower by more than the fee alone. A tower owner who knows the reserve balance, the inspection status and any assessment on the way can answer those questions before a buyer asks, and a seller who cannot answer them has a reason to prefer a buyer who does not need to ask.
For a seller, the two products need to be kept apart. An owner of a house in the Golden Triangle is in a market with about three months of supply and a median of 28 days. An owner of a condominium in an older tower is in a market with six months of supply, fees that are rising and a buyer pool that asks about reserves first.
Source: Hammers Properties LLC, October 2026, which cites listing-service data compiled by PBP Real Estate for September 2026. Brokerage content, not independently verified.
How many houses are already being cut?
The most recent snapshot in this brief comes from a Boca Raton firm that publishes a daily analysis of listing-service data. As of October 5, 2026, it found 526 single-family homes listed for sale in Boca Raton, 201 of them, 38.2%, asking less than their original list price. The median reduction among those 201 was 5.4%, about $100,000. Across Palm Beach County the share of houses asking below their original price was 41.7%.
Condominiums showed more weakness. Of 897 condominium listings, 44.4% were asking below the original price, by a median of 6.7%. Among active houses, the median recorded cumulative days on market was 76 and the median recorded days on market was 62, and 45.6% of houses had exceeded 90 days. The firm notes that these are fields recorded in the listing service and not a reconstructed price history.
Another detail is worth reading with care. Of the 204 houses under contract at the snapshot, 34.3% had a recorded asking price below the original, with a median reduction of 6.4%. The firm says the remainder were not recorded as below their original price, which is not a price history, and that agreed contract prices cannot be inferred from asking prices. A cut does not mean a sale happened at the cut price. It shows that a large share of sellers adjusted before they found a buyer.
These facts sit alongside a median of 28 days to close. They are consistent if the houses that sell fast are the correctly priced ones and the houses that linger are the ones that started high. For a seller, the lesson is that the first price matters. About two in five houses on the market have already moved off their original ask.
Source: PBP Real Estate, press release of October 5, 2026, analyzing listing-service data as of that date. Figures are the firm's and were not independently verified.
What does the luxury record mean for a downtown owner?
A Palm Beach brokerage reported that second-quarter 2026 closings at $3 million and above in Boca Raton set a five-year volume record of $691.3 million on 113 sales, 36% more than a year earlier. Nine of those sales were at $10 million or more, against six a year earlier. Even without the quarter's largest sale, a $75 million estate at the Royal Palm Yacht and Country Club, volume of $616.3 million still topped every prior second quarter in its record.
The report adds details that bear on the downtown. It counted 92 house closings at $3 million and above, against 53 a year earlier, at a median close of $4.7 million and $905 a square foot. Condominium closings thinned from 29 to 20, at a median of $4.6 million and $1,355 a square foot. The brokerage's conclusion is that sellers should show discipline rather than celebration, since the volume arrived at firm but rational prices.
This is a market far above the median house in the Census postal area. Few downtown owners will sell at $3 million or more. What the record shows is depth: when 104 sales close below $10 million in a quarter at the top of the market, buyers are present across the range. It also shows that waterfront and gated communities, not the downtown, supplied the biggest sales. The six largest closings came from the yacht club estates, the beachfront towers and the golf communities.
For a downtown owner, the record is a reason to ask what a builder or end user would pay for a walkable parcel, but not to assume the top of the market applies to every house. The figures describe a segment, and the segment is expensive.
Source: Palm Beach Luxury, Boca Raton Market Report Q2 2026, July 24, 2026, which cites closed residential sales at $3 million and above from the regional listing service. Not independently verified.
What have the South Florida listing series done since spring?
The local reports describe Boca Raton. The Realtor.com series describe the Miami-Fort Lauderdale-West Palm Beach metropolitan area, a far larger region. The median days on market there was 74 in March 2026, 77 in April, 79 in May, 82 in June and 85 in July, a climb of 11 days, or 14.9%, in four months.
Active listings were 43,929 in May, 42,976 in June and 41,524 in July, then 40,908 in August and 41,277 in September, a decline of 6.0% from May (Realtor.com, active listings). The median listing price was $499,000 in May and June, $495,000 in July and $490,000 in August and September, a decline of 1.8% (Realtor.com, median listing price). The count of listings with a price reduction fell from 10,942 in March to 8,810 in July (Realtor.com, price reduced listings), a drop of 19.5% that follows the seasonal fall in listings.
The regional median asking price of $490,000 is far below the $1,162,500 median house price in Boca Raton, and the regional clock of 85 days is far above the 28 days the broker reports for Boca houses. Both gaps show how far the city sits from the region. Boca Raton houses are, by these reports, quicker and dearer than the surrounding market, while its condominiums are slower.
What the regional series add is direction. Inventory has eased and asking prices have slipped a little, but the clock has stretched, so buyers across South Florida are taking longer. A seller in the city should not assume the region's slowdown has bypassed them, particularly if the home is a condominium or priced above its comparables. Readers comparing markets can also read the Aqualane Shores brief and the Boca Raton Riviera brief.
Source: Realtor.com via FRED, Housing Inventory: Median Days on Market, Active Listing Count, Median Listing Price and Price Reduced Count, Miami-Fort Lauderdale-West Palm Beach, FL (CBSA).
What does a private sale change downtown?
A direct sale to a buyer who purchases homes off the market changes five things. There are no showings and no neighbors talking about you selling, which is the privacy benefit. The closing date can be flexible, giving time to find a new home. There are no commission costs and no closing costs for the seller. And there are no inspections or repairs, which matters for a house from 1970 with an original roof and plumbing, or a condominium whose building has not finished its inspections.
The arithmetic of the fee benefit is simple and needs no assumed rate. For every 1% of a sale price that would otherwise go to fees, a sale at $1,162,500 keeps $11,625 and a sale at $2,000,000 keeps $20,000. An owner can set whatever percentage applies against a private offer and compare the two on net proceeds, not on the headline figure.
The 5.4% median cut in the October snapshot gives a second yardstick. On a $1,162,500 listing, a 5.4% reduction is $62,775. A seller who lists high and cuts later pays that in price and pays the carrying cost of the months in between. A private buyer who offers a firm number on a date of the seller's choosing removes that uncertainty, though it removes the chance of a competing bid as well.
That tradeoff is the same one every private sale carries. In a market where the broker reports houses closing in 28 days at 96% of the final list price, a well-priced house might do very well in public. A seller with an older house, a building that has not finished its inspections or a wish for privacy might prefer a quiet sale. The decision belongs to the owner.
Source: calculation from stated sale prices and the median reduction reported by PBP Real Estate; no commission rate or closing cost is assumed.
Methodology and limitations
Housing age, tenure, vacancy, income, rent, population and owner-estimated value come from the American Community Survey 2020-2024 five-year estimates, tabulated for the postal-code area that includes Downtown Boca. The area is wider than the downtown, so the figures describe the area and not the downtown alone. Shares are calculated from published counts. Owner-estimated value carries a stated margin of error.
Days on market, active listings, median listing price and price reduced counts are Realtor.com series published through the Federal Reserve Bank of St. Louis for the Miami-Fort Lauderdale-West Palm Beach metropolitan area. The price-reduced series ends in July 2026 and the others in September 2026. Listing prices are asking prices and not sale prices.
The neighborhood guide, the October update, the price-cut snapshot and the luxury report are brokerage content. Their medians, shares and descriptions were not independently verified, and the luxury report covers only sales at $3 million and above. The brief makes no forecast and does not estimate what any particular home would sell for.
Conclusion
For an owner in Downtown Boca, the public record supports a short list of conclusions. Half the homes in the surrounding area predate 1980, a quarter of units have no full-time resident, houses closed fast in September while more than a third of the houses for sale had already been cut, condominiums are in a slower and costlier market, and the luxury segment set a volume record that most downtown homes do not share.
It does not support a price for any one house, and it does not support a forecast. The choice between a public listing and a private sale comes down to how much an owner values a possible higher price against privacy, a flexible closing date, no commission, no closing costs and no inspections or repairs.
Frequently Asked Questions
Why do the Boca Raton figures differ so much from the South Florida series?
The local reports describe one city, and the Realtor.com series describe a metropolitan area that includes Miami and Fort Lauderdale. The city sits well above the region on price and below it on days to sell for houses.
Does a 24.3% rise in the house median mean my house gained that much?
Not necessarily. The broker attributes part of it to more luxury homes closing, and a monthly median moves with the mix of sales.
Why are condominiums slower than houses?
The broker points to Florida's inspection and reserve rules, which have raised assessments and fees in older buildings. Buildings that have finished their work sell better.
Do the price-cut figures mean houses are selling for less?
They show asking prices below original prices on 38.2% of houses for sale. They do not show the price at which any house sold.
Does a private sale always beat a public listing?
No. A public listing can attract competing bids and sometimes a higher price. A private sale offers privacy, a flexible closing date, no commission, no closing costs and no inspections or repairs, in exchange for a single offer.
Compare your options before committing. Request a written private offer for your property, with no obligation, then weigh it against your listing plan.
Sources
- Hammers Properties LLC, 2026. Boca Raton Housing Market Update: October 2026. https://hammersproperties.com/boca-raton-housing-market-update-october-2026/.
- PBP Real Estate, 2026. Boca Raton housing data press release, October 5, 2026. https://www.pbprealestate.com/press/boca-raton/.
- Palm Beach Luxury, 2026. Boca Raton Market Report: Q2 2026. https://www.palmbeachluxury.com/insights/boca-raton-q2-2026-report/.
- U.S. Census Bureau, 2026. American Community Survey 2020-2024 five-year estimates, the Downtown Boca area (via Census Reporter). https://censusreporter.org/profiles/86000US33432-33432/.
- Realtor.com, 2026. Housing Inventory: Median Days on Market in Miami-Fort Lauderdale-West Palm Beach, FL (CBSA). https://fred.stlouisfed.org/series/MEDDAYONMAR33100.
- Anthony Carriuolo, East Boca Raton Real Estate, 2026. Boca Raton's Golden Triangle | Everything You Need To Know. https://www.bocaratonrealestate.com/blog/boca-raton-golden-triangle/.
- Realtor.com, 2026. Housing Inventory: Active Listing Count in Miami-Fort Lauderdale-West Palm Beach, FL (CBSA). https://fred.stlouisfed.org/series/ACTLISCOU33100.
- Realtor.com, 2026. Housing Inventory: Median Listing Price in Miami-Fort Lauderdale-West Palm Beach, FL (CBSA). https://fred.stlouisfed.org/series/MEDLISPRI33100.
- Realtor.com, 2026. Housing Inventory: Price Reduced Count in Miami-Fort Lauderdale-West Palm Beach, FL (CBSA). https://fred.stlouisfed.org/series/PRIREDCOU33100.
Related research

Seller Guide · October 6, 2026
How to Prepare Point Pleasant Beach Rental Records Before Selling
Separate rental approval, income history and booked stays before comparing sale terms.

Seller Guide · October 6, 2026
How to Prepare Rumson Flood and Waterfront Records Before Selling
Separate flood disclosure, elevation, repairs and waterfront rights before comparing sale terms.

Seller Guide · October 6, 2026
How to Prepare Sarasota Condo Inspection and Reserve Records Before Selling
Separate building condition, reserve funding and resale documents before comparing sale terms.