Market Brief · by Aidan Sowa · October 5, 2026
Does the McLean Median Describe Your House? Reading the Headline Median and the Rebuild Line
Reading the Headline Median and the Rebuild Line for McLean, VA, with each source dated and its limits noted, for owners weighing a listing against a direct sale.
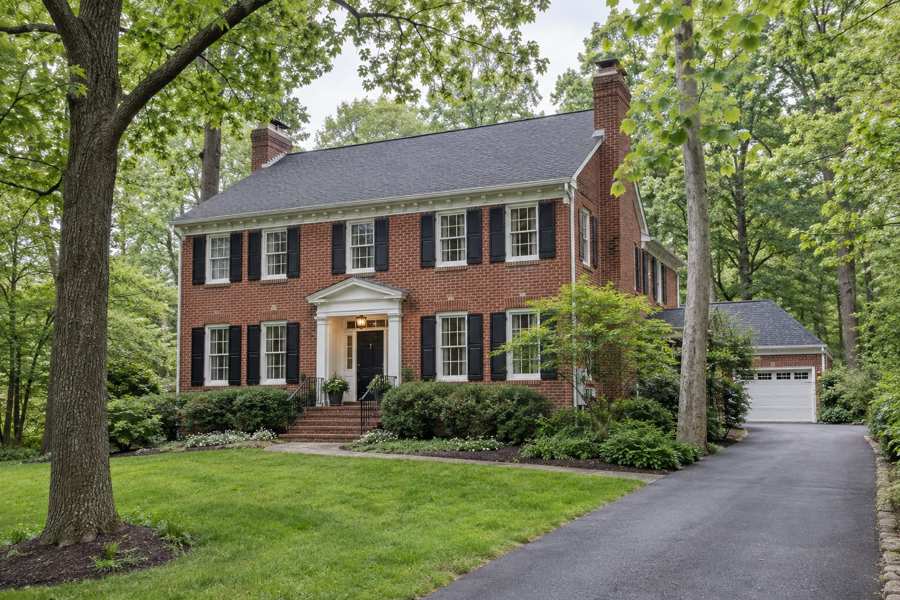
A seller in McLean who looks up the market finds a confident headline. Redfin reports a median sale price of $1.9 million for the three months ending May 2026, up 9.7% on a year earlier, with homes selling in about 19 days against 26 the year before and an average of two offers. It reads like a market accelerating on every front.
A local brokerage then makes the point that the median describes no single house. McLean runs from mid-century ramblers on quarter-acre lots to estates priced at $20 million or more to new condominiums near Tysons, and a month with a run of estate sales lifts the median while a month of attached homes pulls it down. The number is real. It just does not describe one product.
This brief reads both claims against the Census profile of the postal area that includes McLean and the Washington metropolitan listing series from Realtor.com. In that area, 6,781 of 11,436 homes (59.3%) were built before 1980, and the median year built is 1975. The brief does not price any house. The market figures are brokerage commentary and are labeled as such, and the 70 percent rebuild line below is a rule of thumb attributed to custom builders, not a statistic.
Key Findings
- Redfin reported a McLean median sale price of $1.9 million for the three months ending May 2026, up 9.7%, with homes selling in about 19 days against 26 a year earlier, a median of $465 per square foot and 181 homes sold in May (Redfin, McLean housing market).
- A local brokerage argued that the McLean median blends two markets, that custom builders treat a renovation costing roughly 70 percent or more of replacement cost as a rebuild, and that premium lots commonly trade between $900,000 and $2 million before the house is considered (Sullivan Brownell, 2026).
- In the Census postal area, 6,781 of 11,436 housing units (59.3%) were built before 1980, and 9,231 of 11,014 occupied homes (83.8%) are owner-occupied (U.S. Census Bureau, 2020-2024).
- The Washington metropolitan median days on market rose from 29 in April 2026 to 43 in August (Realtor.com, days on market).
- Active listings in the metropolitan area rose from 14,560 in May to 16,579 in September (Realtor.com, active listings).
What does the $1.9 million median actually measure?
Redfin's figure is a median of closed sales in the McLean housing market over three months, and the page that publishes it also gives the median price per square foot, $465, which it says is up 7.5% on a year earlier. A median is the middle sale, so half of the sales were below $1.9 million and half above. In a market where houses range from a few hundred thousand dollars for an attached unit to many millions for an estate, the middle can fall in a place where few houses actually sit.
The page reports 181 homes sold in May 2026, the same as a year earlier, and it lists a median time on market of about 19 days for the three-month period. It also shows a different figure elsewhere on the same page, saying homes sell in 28 days. Different cuts of the same data, a three-month window against a single month or a median against an average, can produce different clocks, and the page does not reconcile them in the text used here.
The Census gives a second view that is not about sales at all. Owners in the postal area estimate the median home at $1,449,900, with a margin of error of $71,384, or 4.9%. That figure sits below the Redfin median of $1.9 million by about $450,000, which is what one would expect when the Census covers all owner-occupied homes, including those that have not changed hands in years, and Redfin covers only those that sold in the quarter.
For an owner, then, the median says that the market is active and that recent sales cluster well above what owners in general believe their homes are worth. It does not say that a particular house will sell at or near it. The question that matters is what kind of house a buyer sees when the buyer looks at yours, and the answer depends on the lot, the age, the condition and the street.
One more reading of the Redfin figures helps an owner. The page reports that homes in McLean receive two offers on average. An average of two offers does not mean every house gets two, since some may get five and others none. It does mean that a buyer in this market expects competition, and buyers who expect competition tend to make cleaner offers, with fewer conditions and shorter deadlines. A seller who prepares a house for the public market can benefit from that behavior. A seller who would rather not prepare, show and wait can note that a private buyer is offering a different trade: one offer, with no showings, no commission, no closing costs and no inspections or repairs, closing on a date that suits the seller.
Source: Redfin, McLean housing market page, data for the three months ending May 2026; U.S. Census Bureau, American Community Survey 2020-2024. Brokerage content, not independently verified.
Why would a local broker say the median is two markets?
The Sullivan Brownell post says the McLean median blends different products. It points to Zillow figures for the spring of 2026 that put a typical home value in one McLean postal area near $1.7 million and in the neighboring postal area near $840,000, roughly half. The post is clear that the gap is not an error. It reflects what is for sale in each pocket: mid-century ramblers on quarter-acre lots, estates priced at $20 million or more, and new condominiums near Tysons.
The post then names the pockets. It says Chesterbrook commands a premium for school-pyramid demand even in dated homes. It says McLean Hamlet, Westgate and Broyhill Estates sit at entry-tier pricing with redevelopment upside. It says Langley Forest, Franklin Park, Salona Village and West McLean are the active teardown corridor, where lot economics set the floor and not the kitchen, and that Lewinsville draws buyers who want convenience over acreage.
Those are one brokerage's descriptions and not official classifications, and the post gives no sales counts for any of them. They are useful because they describe how buyers talk about the place. A buyer who is shopping Chesterbrook for the school pyramid is not comparing houses in the same way as a buyer who is shopping West McLean for a half-acre. A seller whose house sits in one of those pockets should expect to be compared with that pocket's sales, not with the town as a whole.
The practical advice in the post, which this brief repeats as advice and not as fact, is to compare within the subdivision and the postal area rather than against the town-wide median. That advice cuts both ways. A seller in a pocket that has been very strong should not assume that the town median is a ceiling. A seller in a pocket that has been weak should not assume that the median is a floor.
Source: Sullivan Brownell, 2026. Brokerage commentary; area descriptions are the broker's and not official classifications.
What is the 70 percent line, and why does it matter to an owner?
The same post describes a rule of thumb it attributes to custom builders. Once the cost of renovating climbs to roughly 70 percent or more of what it would cost to replace the home outright, it says, a full rebuild becomes the more rational path. It says that threshold shows up often across McLean's 1960s and 1970s houses, where aging foundations, boxy floor plans, low ceilings and outdated mechanical systems make a partial renovation an expensive way to end up with a compromised house.
The post adds that once a property crosses that line, the sale price stops tracking the house and starts tracking the land. It says premium McLean lots, depending on size, proximity to Washington and school pyramid, commonly trade in the $900,000 to $2 million range on their own, before anyone has touched the structure. Neither figure is backed by a sales list in the post, and this brief treats both as a broker's estimate.
The rule is useful as a way of thinking even if the exact percentage is a matter of opinion. It says that a buyer asks two questions of an older house: what would it cost to make this house what I want, and what would it cost to build the house I want on this lot? If the first answer is close to the second, the existing house has little value to the buyer, and the offer reflects the land less the cost of removal.
For a seller, the practical meaning is that the age of the house may count against it with one kind of buyer and not another. A family buyer who will live in the house as it is does not apply the 70 percent line. A builder does. A seller who markets to the first group may wait for a buyer who does not come, and a seller who markets to the second may accept a price that reflects the cost of rebuilding.
Source: Sullivan Brownell, 2026. The 70 percent figure and the $900,000 to $2 million range are the broker's statements and were not independently verified.
How old is the stock, and who owns it?
Of the 11,436 homes in the postal area, 2,285 were built in the 1960s (20.0%), 2,147 in the 1950s (18.8%) and 2,002 in the 1970s (17.5%). With 347 homes built before 1950, the pre-1980 total is 6,781, or 59.3%. The newer end is smaller but real: 1,325 homes were built in the 2010s (11.6%) and 396 since 2020 (3.5%), which together are 15.1% of the stock, a sign of the redevelopment that has been going on.
Owners live in 9,231 of the 11,014 occupied homes (83.8%) and renters in 1,783 (16.2%). Only 422 homes (3.7%) have no usual resident. Median gross rent is $3,501 a month, or $42,012 a year. Median household income is reported at $250,001, which is the Census top-code, meaning the true median is at or above $250,000 and cannot be stated more precisely from this table.
That mix describes a community of long-term owner-occupants with high incomes. Owners who bought decades ago may hold their houses with a low basis and a high market value, and many are at the age where downsizing becomes a question. The Sullivan Brownell post says as much when it describes a segment of large-lot owners who want an exit that does not sacrifice square footage.
A buyer pool that sees such a stock thinks in terms of what can be done with it. Some will renovate, some will rebuild and some will look for a house that needs nothing. The seller's job is to understand which of those buyers is most likely to want the house and what they will pay.
The vacancy figure, 3.7%, adds to this picture. Almost every home in the postal area is somebody's residence, which means that when a house goes on the market, a neighbor is almost certain to notice. In a place with that little turnover, a for-sale sign is news, and owners who would prefer that their plans stay their own have a reason to consider a sale that never reaches a listing site.
| Indicator | Value | Note |
|---|---|---|
| Population | 30,953 | Whole postal area |
| Housing units | 11,436 | All units |
| Owner-occupied homes | 9,231 | 83.8% of occupied |
| Renter-occupied homes | 1,783 | 16.2% of occupied |
| No usual resident | 422 | 3.7% of all units |
| Median household income | $250,001 | Census top-code, so at least $250,000 |
| Median gross rent | $3,501 | Monthly |
| Owner-estimated median value | $1,449,900 | Margin of error $71,384 |
| Median year built | 1975 | Estimate |
Source: U.S. Census Bureau, American Community Survey 2020-2024 five-year estimates, tables B01003, B19013, B25002, B25003, B25034, B25064 and B25077.
What are the new projects doing to the supply of large lots?
The Sullivan Brownell post describes two developments that bear on the question. The first is Knolewood, a 24-lot subdivision on roughly 25 acres near Lewinsville Road and Lancia Drive. It says a site plan was submitted in December 2023 and completed review in September 2025, that the land, a historic estate with a manor house dating to 1875, has been fully cleared, and that three local builders are building on individual lots ranging from 0.82 to 1.2 acres. It calls Knolewood the last significant expanse of undeveloped land in McLean.
The second is The Ritz-Carlton Residences, McLean, Tysons, a 102-unit branded condominium project from developer Renaissance Centro, which the post says breaks ground in 2026 with completion targeted for late 2028, priced from roughly $1 million. The post says the developer describes a buyer profile of large-lot owners who want to stay in the area without a large house to maintain.
The post draws a conclusion that this brief reports as the broker's opinion: the two projects are two ends of one pipeline, one creating new land for buyers who want to build and the other offering an exit for owners whose land is the reason a buyer wants it. If that is right, more older houses on large lots may come to market as owners downsize, and the buyers who want them will be builders.
The effect for a current owner is not certain. More supply of large lots could soften prices, and a continued shortage of land could firm them. The brief takes no side. It notes only that the market in which a McLean seller competes is changing, and that the pace of change is set by decisions that other owners and developers make.
Source: Sullivan Brownell, 2026, citing county records and local reporting. Project details were not independently verified.
What does the Washington clock say?
Realtor.com publishes listing series for the Washington-Arlington-Alexandria metropolitan area through the Federal Reserve Bank of St. Louis. They show direction, not the level for McLean. The median days on market was 29 in April 2026, 30 in May, 36 in June, 39 in July and 43 in August, a lengthening of 14 days in four months.
Active listings rose from 14,560 in May to 15,223 in June, 15,203 in July, 15,290 in August and 16,579 in September, up 13.9% since May. New listings fell from 9,336 in May to 6,696 in August and ticked up to 7,648 in September (Realtor.com, new listings). The median listing price was $550,000 in February and $585,000 in June (Realtor.com, median listing price). Listings with a price reduction rose from 4,042 in April to 5,556 in July and stood at 5,444 in August (Realtor.com, price reduced listings).
Put together, the metropolitan picture shows a spring peak in speed, with the clock lengthening through the summer, more listings on offer and more of them with price cuts. That is a cooling from a very fast pace and not a collapse, since 43 days is still short by the standards of many other areas in this series.
The McLean figures are of a different scale. Redfin has homes selling in about 19 days, a speed well below the metropolitan 43 in August, though the periods differ. The direction in the metropolitan data is a reminder that the spring numbers on a market page may describe a season that has passed. Readers comparing markets can also read the Arlington brief and the Vienna brief.
Source: Realtor.com via FRED, Housing Inventory: Median Days on Market, Active Listing Count, New Listing Count, Median Listing Price and Price Reduced Count, Washington-Arlington-Alexandria, DC-VA-MD-WV (CBSA).
What would a private sale change for a McLean owner?
A direct sale to a buyer who purchases homes off the market changes five things for the seller. There are no showings and no neighbors talking about you selling, which matters on a street where owners have known each other for decades. The closing date can be flexible, giving time to find a new home, whether that is a smaller house, a condominium or a move out of the area. There are no commission costs and no closing costs for the seller. And there are no inspections or repairs, which for a house built in the 1960s or 1970s is the step that most often reshapes a price.
The fee benefit needs no assumed rate. For every 1% of a sale price that would otherwise go to fees, a sale at $1,449,900 keeps $14,499, a sale at $1,900,000 keeps $19,000 and a sale at $2,000,000 keeps $20,000. An owner can set whatever percentage applies against a private offer and compare the two on net proceeds.
The trade-off is the usual one. A public listing can bring several offers, and Redfin's figure of two offers on average is a reminder that competition is real in this market. A private sale brings one offer, on a date the seller chooses. A seller who values the chance of competing bids may prefer the public route, and a seller who values privacy, certainty and freedom from preparation may prefer the private one.
What a seller should not do is take any median as a price. The broker's point that the median describes no single product is the right caution. The right comparison is between a specific private offer and the net a public sale of that specific house would likely produce after fees, credits and time.
Source: calculation from stated prices; no commission rate, closing cost or repair cost is assumed.
Methodology and limitations
Age, tenure, vacancy, income, rent, population and owner-estimated value come from the American Community Survey 2020-2024 five-year estimates for the postal-code area that includes McLean. The area is not identical to the community. Shares are calculated from published counts, owner-estimated value carries a stated margin of error, and median household income is at the survey's top-code.
Days on market, active listings, new listings, median listing price and price reduced counts are Realtor.com series published by the Federal Reserve Bank of St. Louis for the Washington-Arlington-Alexandria metropolitan area. The series end between June and September 2026. Listing prices are asking prices and not sale prices.
The sales figures and teardown commentary come from Redfin and a local brokerage. They were not independently verified, and the 70 percent line and lot price range are the broker's statements. The brief makes no forecast and does not estimate what any particular home would sell for.
Conclusion
The public record supports a short list for a McLean owner. The headline median is strong, a local broker says it blends two markets, nearly 60% of the homes were built before 1980, and the rule of thumb among builders is that a renovation near 70 percent of replacement cost tips a house into a teardown.
It does not support a price for any one property. The choice between a public listing and a private sale comes down to how much an owner values the chance of competing bids against privacy, a flexible closing date, no commission, no closing costs and no inspections or repairs.
Frequently Asked Questions
What is the McLean median sale price?
Redfin reported $1.9 million for the three months ending May 2026, up 9.7% from a year earlier.
Why might the median mislead?
A local broker says it blends products from older ramblers on small lots to estates and new condominiums.
What is the 70 percent line?
A builder rule of thumb cited by a local broker: a renovation costing roughly 70 percent or more of replacement cost makes a rebuild the likelier path. It is not a statistic.
Does the Washington metropolitan data describe McLean?
No. It covers a multi-county region and shows direction only.
Does a private sale always beat a public listing?
No. A public listing can attract competing bids. A private sale offers privacy, a flexible closing date, no commission, no closing costs and no inspections or repairs, in exchange for a single offer.
Compare your options before committing. Request a written private offer for your property, with no obligation, then weigh it against your listing plan.
Sources
- Redfin, 2026. McLean, VA Housing Market. https://www.redfin.com/city/24355/VA/McLean/housing-market.
- Sullivan Brownell, 2026. The McLean Median Is Two Different Markets Wearing One Name. https://sullivanbrownell.com/blog/the-mclean-median-is-two-different-markets-wearing-one-name.
- U.S. Census Bureau, 2026. American Community Survey 2020-2024 five-year estimates, the McLean area (via Census Reporter). https://censusreporter.org/profiles/86000US22101-22101/.
- Realtor.com, 2026. Housing Inventory: Median Days on Market in Washington-Arlington-Alexandria, DC-VA-MD-WV (CBSA). https://fred.stlouisfed.org/series/MEDDAYONMAR47900.
- Realtor.com, 2026. Housing Inventory: Active Listing Count in Washington-Arlington-Alexandria, DC-VA-MD-WV (CBSA). https://fred.stlouisfed.org/series/ACTLISCOU47900.
- Realtor.com, 2026. Housing Inventory: New Listing Count in Washington-Arlington-Alexandria, DC-VA-MD-WV (CBSA). https://fred.stlouisfed.org/series/NEWLISCOU47900.
- Realtor.com, 2026. Housing Inventory: Median Listing Price in Washington-Arlington-Alexandria, DC-VA-MD-WV (CBSA). https://fred.stlouisfed.org/series/MEDLISPRI47900.
- Realtor.com, 2026. Housing Inventory: Price Reduced Count in Washington-Arlington-Alexandria, DC-VA-MD-WV (CBSA). https://fred.stlouisfed.org/series/PRIREDCOU47900.
Related research

Seller Guide · October 6, 2026
How to Prepare Point Pleasant Beach Rental Records Before Selling
Separate rental approval, income history and booked stays before comparing sale terms.

Seller Guide · October 6, 2026
How to Prepare Rumson Flood and Waterfront Records Before Selling
Separate flood disclosure, elevation, repairs and waterfront rights before comparing sale terms.

Seller Guide · October 6, 2026
How to Prepare Sarasota Condo Inspection and Reserve Records Before Selling
Separate building condition, reserve funding and resale documents before comparing sale terms.