Market Brief · by Aidan Sowa · October 5, 2026
Does an El Dorado Hills Seller Still Have Room to Bargain With a Family Buyer? Reading Redfin, Zillow, Realtor.com and the Census Family Homes
Reading Redfin, Zillow, Realtor.com and the Census Family Homes for El Dorado Hills, CA, with each source dated and its limits noted, for owners weighing a listing against a direct sale.
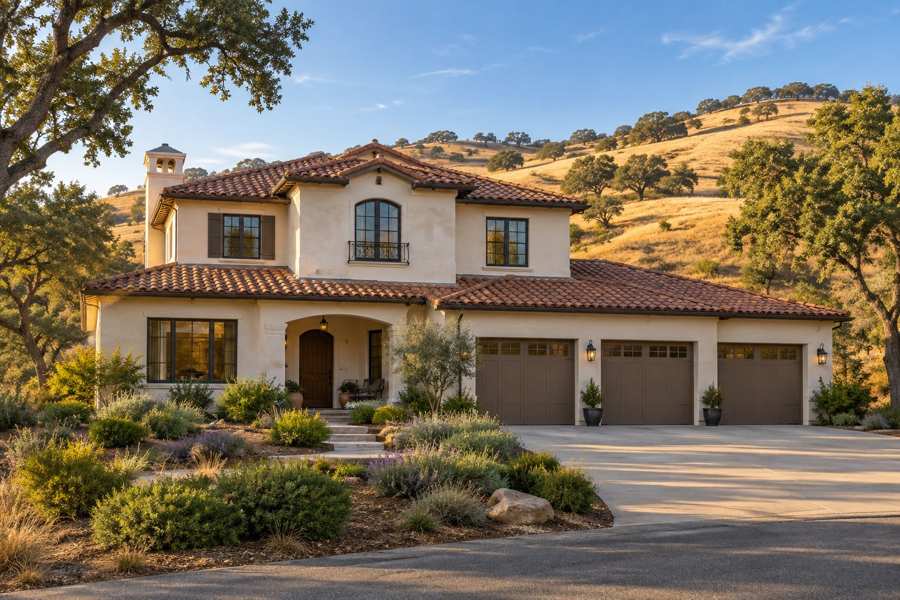
Does an El Dorado Hills seller still have room to bargain with a family buyer? Redfin's page for El Dorado Hills, for the three months ending August 2026, shows a median sale price of $904,401, down 7.7%, with homes selling in about 32 days and 25.4% of them above the list price. Realtor.com's page for El Dorado Hills, for August 2026, shows a median sold price of $930,000, up 1.64% in a year, and a sale-to-list ratio of 99%. The two sources disagree on direction, and the reason is worth understanding before a seller names a price.
The Census shows a family market. In the postal area that includes El Dorado Hills, 24.5% of residents are under 18, 86.8% of occupied homes are owner-occupied, 89.4% of homes are detached houses and 63.4% of owner households live in a home with four or more bedrooms, all computed here. The median household income is $165,467, and the median owner value is $916,000. A seller here is usually selling a large family house to another family.
Maison Off-Market speaks only to sellers, and this brief is for an owner in El Dorado Hills. It uses the sheet's name for the town and the Census postal area that the sheet lists for it. Every figure below is dated and linked, the arithmetic is shown, and inferences are labeled.
Key Findings
- Redfin's page for El Dorado Hills, for the three months ending August 2026, showed a median sale price of $904,401, down 7.7% from the same period last year, $356 per square foot, down 1.4%, 231 homes sold in August against 199 a year earlier, up 16.0%, and a median of 32 days on market, unchanged from a year earlier. The sale-to-list ratio was 99.0%, up 0.7 points, 25.4% of homes sold above list, up 0.2 points, and 39.4% of homes had price drops, up 0.8 points. Redfin's Compete Score was 60 out of 100, somewhat competitive: some homes get multiple offers, the average home sold about 1% below list and went pending in around 41 days, and hot homes sold around list in around 16 days (Redfin, El Dorado Hills housing market). The page title says as of September.
- Zillow's page for El Dorado Hills, updated April 30, 2026, showed a home value index of $920,973, down 0.7% over the past year, with homes going pending in around 15 days. The update date is five months old, so the page is used here only as a spring reference (Zillow, El Dorado Hills home values).
- Realtor.com's page for El Dorado Hills, for August 2026, showed a median listing price of $1,099,000, down 4.77% in a year and up 0.88% in three, a median sold price of $930,000, up 1.64% in a year and up 9.41% in three, $375 per square foot, down 2.05%, 479 active listings, up 13.75% in a year and up 67.28% in three, 46 days on market, down 6%, 39 rental properties, down 33.85%, and a median rent of $2,636 per month, up 4.19%. Homes sold for approximately the asking price, a ratio of 99%, and the page calls it a warm market (Realtor.com, El Dorado Hills housing market).
- In the Census postal area that includes El Dorado Hills, 17,673 housing units were counted, 17,080 were occupied, 89.4% of units were detached houses, the median build year was 2002, the median household income was $165,467 and the median owner value was $916,000, plus or minus $15,557 (U.S. Census Bureau, American Community Survey 2020-2024 five-year estimates, via Census Reporter).
- Of the 47,657 people counted in the postal area, 24.5% are under 18, 12.0% are 35 to 44, 30.7% are 45 to 64 and 20.7% are 65 or older. Of 14,830 owner households, 74.9% have a mortgage and 63.4% live in a home with four or more bedrooms (U.S. Census Bureau, American Community Survey 2020-2024 five-year estimates, tables B01001, B25091 and B25042).
Why do the El Dorado Hills price figures disagree?
The two current sources show opposite signs, and the cause is mostly what each measures. Redfin's $904,401 is a three-month median of all home types through August, down 7.7%, which implies about $979,849 a year earlier. Realtor.com's $930,000 is the August median sold price, up 1.64%, which implies about $914,994 a year earlier. A fall from $979,849 to $904,401 and a rise from $914,994 to $930,000 cannot both describe the same homes, and the likely cause is a different mix of homes sold in each window. That is an inference.
The per-foot figures show how much a mix effect can explain. Redfin's $356 per square foot is down 1.4%, which implies about $361 a year earlier, and Realtor.com's $375 listing price per foot is down 2.05%, which implies about $383. The per-foot price fell only a little while the median price fell 7.7% on Redfin, which suggests that smaller homes made up more of the sales. A seller with a large house should look at the per-foot figure and at the sales of homes of the same size.
Realtor.com's listing median is $1,099,000, 18.2% above its sold median, computed here, and down 4.77% in a year, which implies about $1,154,048 a year earlier. Listings are priced above sales, and the asking prices are coming down. The three-year change is small, with the listing median up 0.88%, while the sold median is up 9.41%, which implies about $850,000 three years earlier, so sales have caught up part of the way to asking prices.
The Zillow page is an older reading. Its index of $920,973 was updated on April 30, 2026, and was down 0.7% in a year, which implies about $927,465 a year earlier. It sits close to the Realtor.com sold median, 1.0% below it, computed here, and 1.8% above the Redfin median. The three current readings give a range of about $0.90M to $0.93M, and a seller should treat the middle of that range as the market's level, not the high end of the listings.
The Census owner value of $916,000, plus or minus $15,557, is 1.5% below the Realtor.com sold median and 5.5 times the Census median household income of $165,467, computed here. The owner value is the owner's own estimate of what the home would sell for, and it sits within the range of the sale figures, so owners in this area are not far from the market in their own sense of value.
A practical rule follows. When two sources of equal standing disagree, a seller is better served by the narrower comparison than by either headline. A median for the whole city, over three months, says little about a four-bedroom house built in the 2000s. Sales of houses of that size and age on nearby streets, in the last few months, say much more, and they are the figures that a buyer's own agent will bring to the table. A private buyer will do the same work, so an owner who has done it first can judge any offer on its merits.
| Source | Figure | What it measures |
|---|---|---|
| Redfin | $904,401, down 7.7% | Median sale price, three months to August 2026 |
| Census Reporter | $916,000 | Median owner value, postal area |
| Zillow | $920,973, down 0.7% | Home value index, April 2026 |
| Realtor.com | $930,000, up 1.64% | Median sold price, August 2026 |
| Realtor.com | $1,099,000, down 4.77% | Median listing price, August 2026 |
Sources as cited. Ratios and year-earlier values in this section are computed from the published figures and percentages.
How competitive is El Dorado Hills, and how fast do homes sell?
Redfin rates El Dorado Hills somewhat competitive, with a score of 60 out of 100. Some homes get multiple offers. The average home sells about 1% below list and goes pending in around 41 days, and the hottest homes sell around list in around 16 days. That is a market with room to bargain, but a home that is priced well moves in a few weeks.
The sale-to-list ratio is high. Redfin shows 99.0%, up 0.7 points, which implies about 98.3% a year earlier, and Realtor.com shows 99%. A home that sells for 99% of the ask leaves about $9,000 of room on a $900,000 price, computed here, so a buyer's bargaining is a matter of a percent or so, not of ten percent. A seller who prices at the market gives up little in negotiation.
One home in four sells above list. Redfin shows 25.4% of homes sold above list, up 0.2 points, and 39.4% with price drops, up 0.8 points, which implies about 38.6% a year earlier. Both figures are high, and together they show a market in which pricing is the whole game. A home priced right draws bids, and a home priced high is cut after weeks on the market.
Days on market are in the range of one to six weeks. Redfin shows a median of 32 days, unchanged in a year, and a time to pending of around 41 days for the average home. Realtor.com shows 46 days, down 6%, which implies about 49 days a year earlier, and Zillow's spring reading was around 15 days to pending. The pace is slower in late summer than in spring, which is the usual pattern.
Supply is the thing to watch. Realtor.com shows 479 active listings, up 13.75% in a year, which implies about 421 a year earlier, and up 67.28% in three years, which implies about 286. Redfin counted 231 sales in August, up 16.0%, which implies about 199 a year earlier, so the 479 listings are about 2.1 times a month of sales, computed here and an inference, since the two sources count differently. More homes for sale and more sales mean a bigger market with more choice for a buyer.
Rents give a side view. Realtor.com shows a median rent of $2,636, up 4.19%, which implies about $2,530 a year earlier, on 39 rental listings, down 33.85%, which implies about 59 a year earlier. Fewer homes for rent and higher rents point to a tight rental market, which is a counterweight to the rising for-sale supply. For an owner who might let a house instead of selling it, the Census median rent of $2,567 is a fair benchmark, and the gap between rent and the carrying cost of a $900,000 house is wide.
Sources as cited. Year-earlier values and differences are computed from the published percentages.
What do the family homes of El Dorado Hills look like in the Census?
The postal area is newer than most. Of 17,673 housing units, 6,279, or 35.5%, were built in the 2000s, 3,199, or 18.1%, in the 2010s and 826, or 4.7%, in 2020 or later, so 10,304 units, 58.3%, were built since 2000. Another 3,387, or 19.2%, date from the 1990s and 1,838, or 10.4%, from the 1980s. Only 2,144 units, 12.1%, were built before 1980. The median build year is 2002.
A newer house shifts the seller's questions. A home built since 2000 has a roof, a heating and cooling system and plumbing that are usually still within their working lives, though the earliest of them are now in their third decade. An inspector will look at the roof, the air conditioning and the water heater, and a seller in the oldest part of the stock should expect those to be the main items on a repair list.
Houses dominate. Of the units, 15,801, or 89.4%, are detached, 305, or 1.7%, are attached, 264, or 1.5%, are in buildings of two to four units and 1,082, or 6.1%, are in buildings of five or more. Mobile homes are 221 units, 1.3%. Vacancy is low, at 593 units, 3.4%, and of those, 364, or 61.4%, are held for seasonal use, 115, or 19.4%, are vacant for other reasons, 69, or 11.6%, are for sale only, 24, or 4.0%, are sold and not yet occupied and 21, or 3.5%, are for rent.
The homes are large. Of 14,830 owner households, 4,311, or 29.1%, live in a three-bedroom home, 6,549, or 44.2%, in a four-bedroom and 2,855, or 19.3%, in one with five or more bedrooms, so 63.4% have four or more bedrooms. Only 1,115 owner households, 7.5%, live in a home with two bedrooms or fewer. A buyer for a large house is nearly always a family, and often one with children at school.
Renters are a smaller group. Of 17,080 occupied homes, 2,250, or 13.2%, are rented, and 1,082 of those households, 48.1%, moved in since 2020, a sign of high turnover. Of the rented homes, 943, or 41.9%, have two bedrooms and 934, or 41.5%, have three or four bedrooms. The Census median rent is $2,567, and Realtor.com's median rent of $2,636 on 39 rental listings is close to it.
The age profile has a practical meaning for the roof in particular. A tile or composition roof laid in 2003 is now in its twenty-third year, and a buyer's inspector will note its remaining life. Air conditioning units from the same year are near the end of a typical life as well. None of this makes a house hard to sell, but each item is a line on a repair request, and a seller who prefers to avoid the negotiation can ask for a private offer for the house as it stands, which is the fifth benefit.
Source: U.S. Census Bureau, American Community Survey 2020-2024 five-year estimates, tables B25034, B25024, B25004 and B25042, via Census Reporter. Shares are computed here.
Who owns the homes, and what do they spend?
Owners are the large majority. Of 17,080 occupied homes, 14,830 are owner-occupied, 86.8%, and 2,250 are rented, 13.2%. The Census median household income is $165,467, and the median owner value is $916,000, which is 5.5 times income, computed here. A household at the median income cannot buy at the median value without a large down payment or equity from a previous home, which is a point about who the buyers are: mostly move-up buyers with equity.
Tenure is mixed. Of 14,830 owner households, 251 moved in during 2023 or later and 2,686 between 2020 and 2022, so 2,937, or 19.8%, moved in since 2020. Another 6,459, 43.6%, moved in between 2010 and 2019, 3,639, 24.5%, between 2000 and 2009, 1,359, 9.2%, in the 1990s and 436, 2.9%, before 1990. In all, 63.4% arrived since 2010, and only 12.1% have been in place since before 2000.
Mortgage use is high. Of 14,830 owners, 11,101, or 74.9%, have a mortgage and 3,729, or 25.1%, do not. Among owners with a mortgage, 3,488, or 31.4%, spent 30% or more of income on housing, and 1,574, or 14.2%, spent half or more. Among owners without a mortgage, 578, or 15.5%, spent 30% or more, and 324, or 8.7%, spent half or more. In all, 4,066 owner households, 27.5% of those with a computed figure, carry a heavy cost.
The Census describes a young population for a high-income suburb. Of 47,657 residents, 11,691, or 24.5%, are under 18, 2,793, or 5.9%, are 18 to 24, 2,954, or 6.2%, are 25 to 34, 5,733, or 12.0%, are 35 to 44, 14,609, or 30.7%, are 45 to 64 and 9,877, or 20.7%, are 65 or older. Households in their middle years with children are the center of the market on both sides.
This matters for timing. A family that sells usually wants to move between school years, and a family that buys wants to arrive before a term begins, so the busy window is narrow and a seller who misses it may wait months. A sale that can close on a date of the seller's choosing, without showings in a house where children live, answers both needs.
Put together, the picture is of a family neighborhood in which most owners bought within the last fifteen years, borrowed a large part of the price and are now in the middle of their working lives. Some of them will sell for a job change, a school choice or a move to be near relatives, and each of those has a deadline. A seller whose deadline is fixed has less power in a public sale, where a buyer can see the date, and more in a private one, where the date is set in advance and agreed. Readers comparing markets can also read the Rancho Mirage brief and the Redondo Beach brief.
Source: U.S. Census Bureau, American Community Survey 2020-2024 five-year estimates, tables B25003, B25038, B25091, B01001, B19013 and B25077, via Census Reporter. Shares are computed here.
What should an El Dorado Hills owner ask, and what does a private sale change?
Five questions are worth asking. Is my home priced against sales or against listings, which sit more than 18% higher? How long can I wait, and does the school calendar matter? Does my home compare with sales of the same size and age? What will the fees be? How much of the price survives the buyer's inspection?
Fees are simple arithmetic, and no rate is assumed here. Each 1% of a $450,000 sale is $4,500, of a $725,000 sale is $7,250 and of a $1,200,000 sale is $12,000. Three percent is $13,500, $21,750 and $36,000, and five percent is $22,500, $36,250 and $60,000. A seller can put their own quoted costs into those rows. On the Redfin median of $904,401, 1% is $9,044, 3% is $27,132 and 5% is $45,220.
A private sale has no showings and no neighbors talking about it, which is the first benefit. In a family area, a seller with children at home may value that more than most, since open houses mean strangers walking through bedrooms. The second benefit is a closing date that suits the seller, which helps a family that must time a move around a school year.
The third and fourth benefits are no commission costs and no closing costs, and the fifth is no inspection repairs. In a stock where 58.3% of homes were built since 2000, repairs are often smaller than in an older suburb, but the roof, the air conditioning and the water heater of a house from the 2000s are now due for attention, and a buyer's inspector will find them.
Maison Off-Market buys luxury homes and estates directly from their owners and speaks only to sellers. It does not say that a private sale always beats a public listing, and in a market where one home in four sells above the ask, an owner is right to compare an offer with what the same home would net after costs. If you would like a private, no-obligation offer for a home in El Dorado Hills, call 401-219-4207 or use the contact form on this site.
Sources as cited. Fee illustrations are arithmetic only and assume no commission rate.
Methodology and limitations
Each page's date, title and place were read before use. The Redfin page is for the three months ending August 2026 and is titled as of September. The Zillow page was updated April 30, 2026, which is five months old, and is used only as a spring reference. The Realtor.com page is for August 2026 and compares with a year earlier and three years earlier. Redfin and Realtor.com disagree on the direction of the median, and the brief reports both and offers a labeled inference about the mix of homes sold. Only established data publishers and the Census are cited. The Census figures are five-year estimates for the postal area that the sheet lists for El Dorado Hills. Percent changes were taken as printed, and ratios, sums, fee figures and year-earlier values are this brief's arithmetic.
Conclusion
The record for El Dorado Hills shows a level of about $0.90M to $0.93M, homes that sell at 99% of the ask in about a month, one sale in four above list and a postal area of newer, large, owner-occupied family houses. The useful number for an owner is a closed sale of a comparable house of the same size and age, and a private buyer can price the house in front of them and close on the family's schedule.
Frequently Asked Questions
What is the median home price in El Dorado Hills?
Redfin shows a median sale price of $904,401 for the three months ending August 2026, and Realtor.com shows $930,000 sold in August 2026.
How long do homes take to sell in El Dorado Hills?
Redfin shows a median of 32 days on market and around 41 days to pending for the average home, and Realtor.com shows 46 days.
Do homes in El Dorado Hills sell above asking?
Some do. Redfin shows a sale-to-list ratio of 99.0%, with 25.4% of homes selling above list.
What does the Census say about homes near El Dorado Hills?
In the postal area, 86.8% of occupied homes are owner-occupied, 89.4% are detached houses and 58.3% were built since 2000.
Can I sell my home in El Dorado Hills privately?
Yes. Maison Off-Market buys luxury homes and estates directly from their owners with no showings, flexible closing dates, no commission costs, no closing costs and no inspections or repairs. Call 401-219-4207 or use the contact form.
Compare your options before committing. Request a written private offer for your property, with no obligation, then weigh it against your listing plan.
Sources
- Redfin, El Dorado Hills housing market, 2026. El Dorado Hills Housing Market: House Prices and Trends. https://www.redfin.com/city/22489/CA/El-Dorado-Hills/housing-market.
- Realtor.com, El Dorado Hills housing market, 2026. El Dorado Hills, CA Housing Market and Rental Trends. https://www.realtor.com/local/market/california/el-dorado-county/el-dorado-hills.
- Zillow, El Dorado Hills home values, 2026. El Dorado Hills, CA Housing Market: 2026 Home Prices and Trends. https://www.zillow.com/home-values/17931/el-dorado-hills-ca/.
Related research

Seller Guide · October 6, 2026
How to Prepare Point Pleasant Beach Rental Records Before Selling
Separate rental approval, income history and booked stays before comparing sale terms.

Seller Guide · October 6, 2026
How to Prepare Rumson Flood and Waterfront Records Before Selling
Separate flood disclosure, elevation, repairs and waterfront rights before comparing sale terms.

Seller Guide · October 6, 2026
How to Prepare Sarasota Condo Inspection and Reserve Records Before Selling
Separate building condition, reserve funding and resale documents before comparing sale terms.